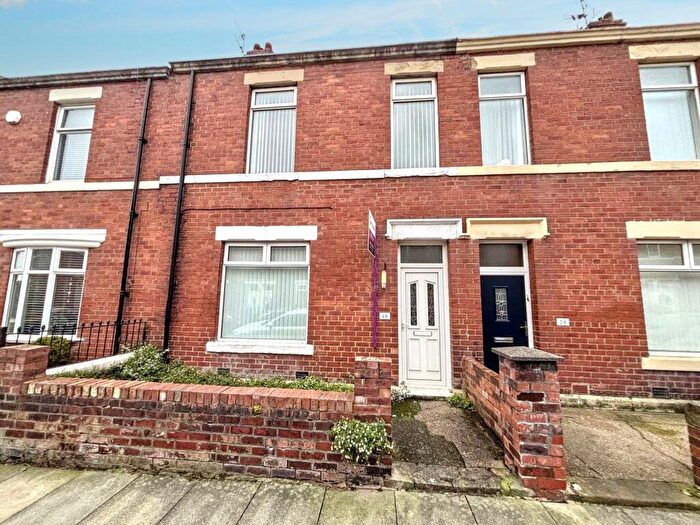
Houses for sale & to rent in Monkton, Hebburn
House Prices in Monkton
Properties in Monkton have an average house price of £163,135.00 and had 211 Property Transactions within the last 3 years¹.
Monkton is an area in Hebburn, South Tyneside with 1,662 households², where the most expensive property was sold for £364,995.00.
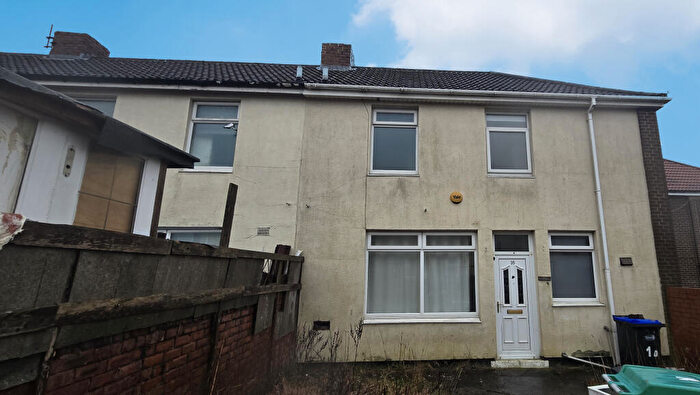
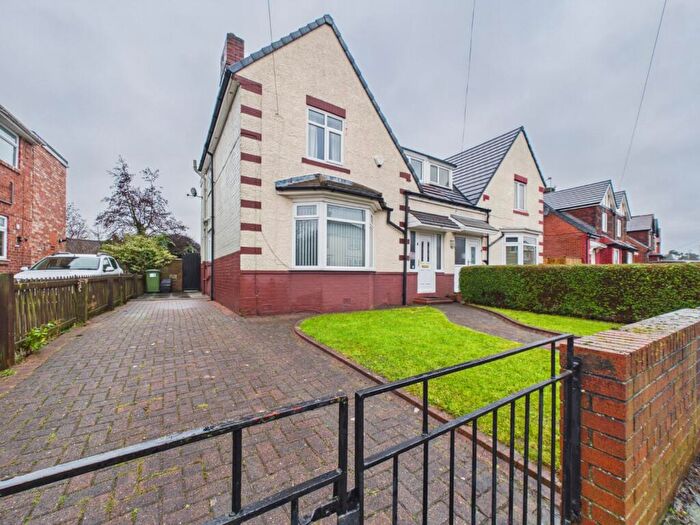
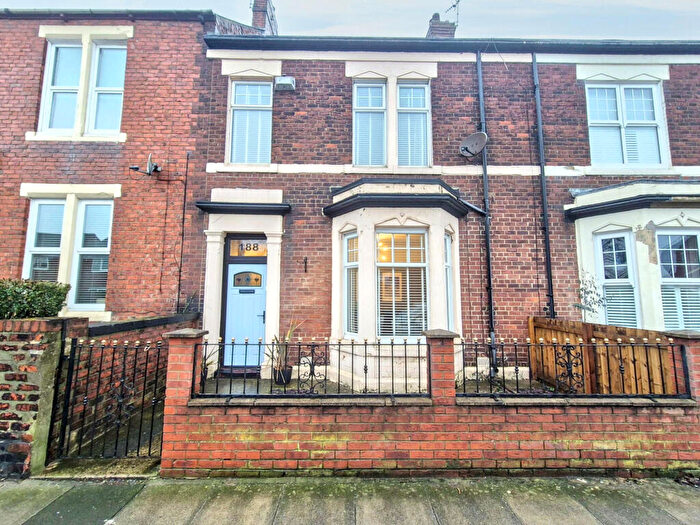
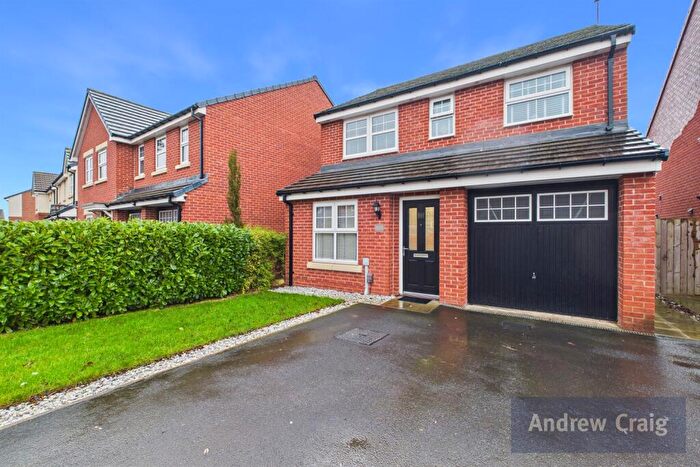
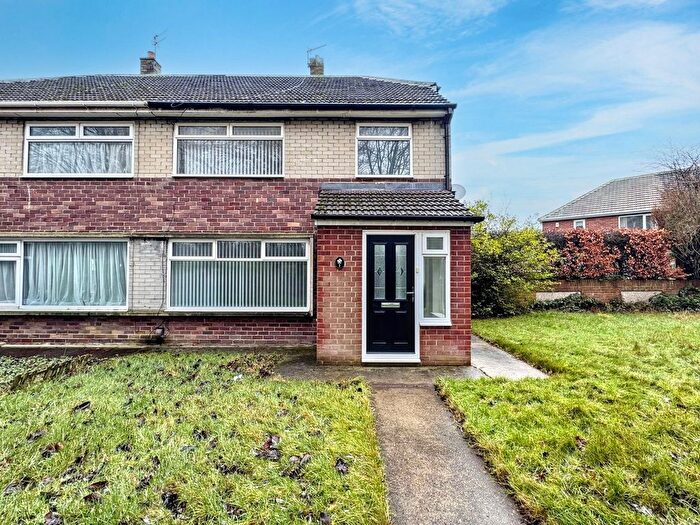
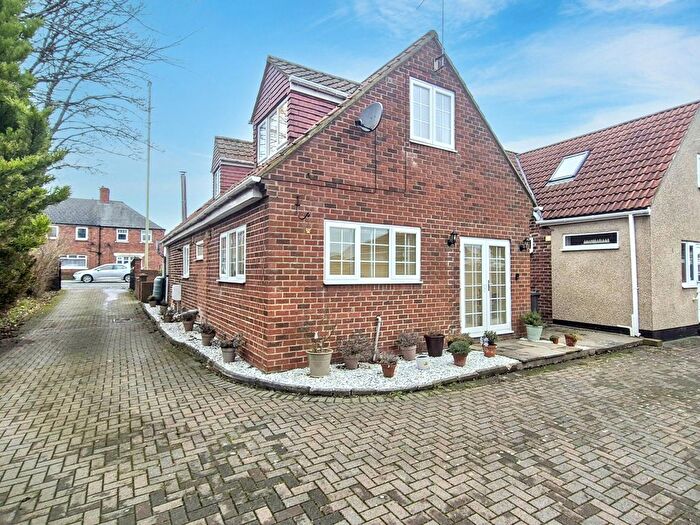
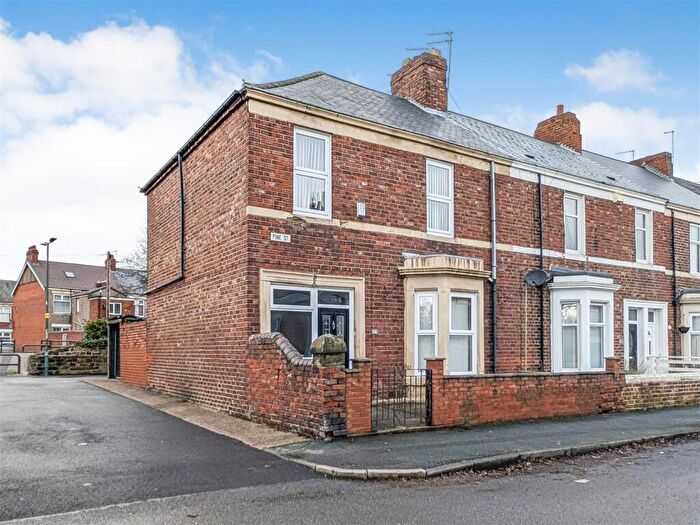
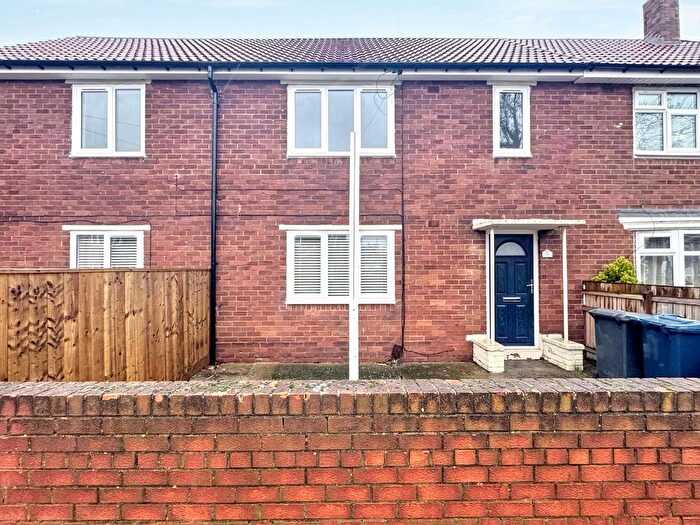
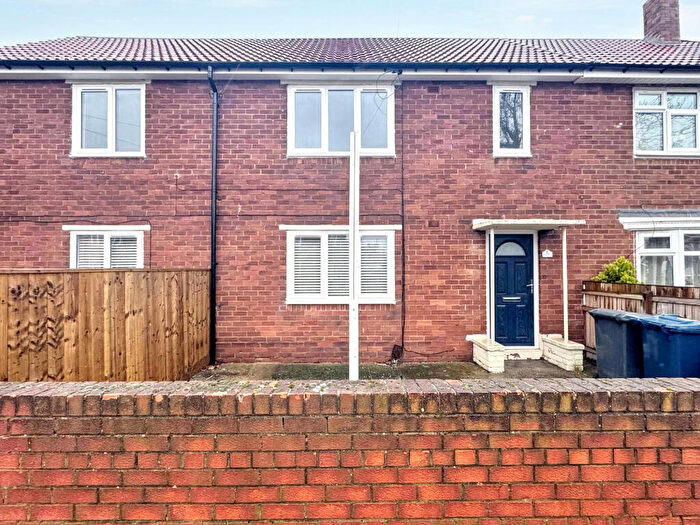
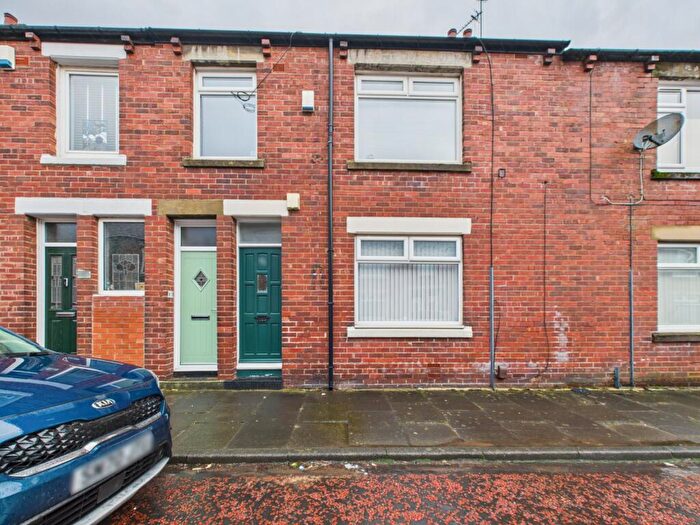
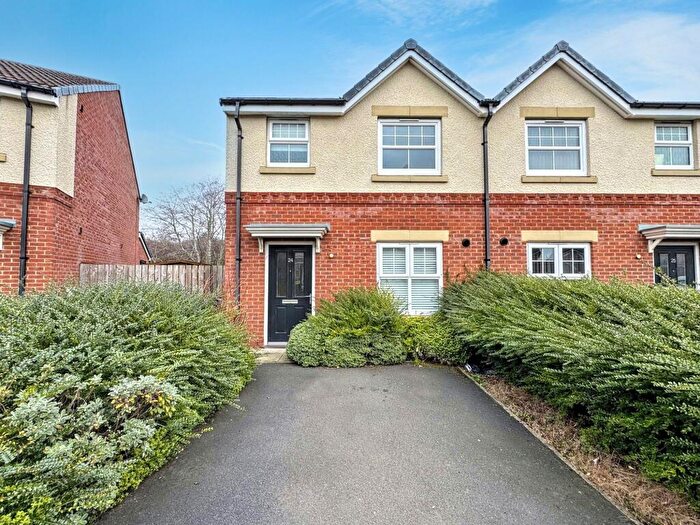
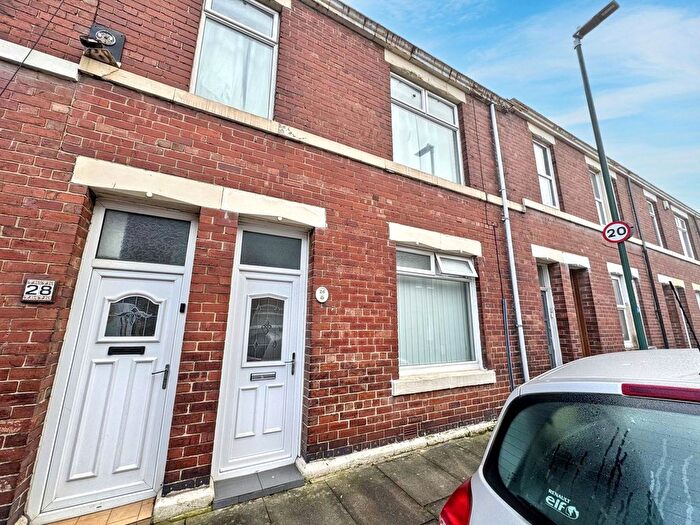
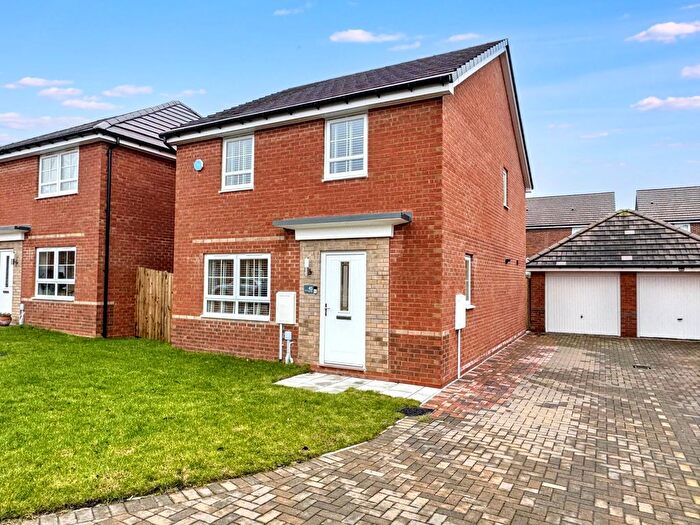
Properties for sale in Monkton
Roads and Postcodes in Monkton
Navigate through our locations to find the location of your next house in Monkton, Hebburn for sale or to rent.
| Streets | Postcodes |
|---|---|
| Adair Way | NE31 2BS NE31 2BZ |
| Bede Walk | NE31 2SB |
| Bedewell Industrial Park | NE31 2XQ |
| Blackpool Parade | NE31 2AF |
| Bonnar Court | NE31 2YN |
| Bournemouth Parade | NE31 2AU |
| Bridlington Parade | NE31 2AE |
| Brighton Parade | NE31 2AA NE31 2AB NE31 2AZ |
| Cambridge Avenue | NE31 2RT NE31 2RX NE31 2RY NE31 2RZ NE31 2XU NE31 2XX |
| Campbell Park Road | NE31 2SH NE31 2SP NE31 2FJ |
| Civic Court | NE31 2YB |
| Clegwell Terrace | NE31 1YB NE31 2UZ |
| Collingwood Street | NE31 2XW |
| Colwyn Parade | NE31 2AN |
| Coniston Avenue | NE31 2RR |
| Dorset Avenue | NE31 2SF |
| Douglas Parade | NE31 2AS |
| Duchess Gardens | NE31 2FH |
| Eastbourne Parade | NE31 2AT |
| Eton Square | NE31 2XA |
| Frobisher Street | NE31 2XB NE31 2XE |
| Gladstone Street | NE31 2XD NE31 2XJ |
| Grasmere Road | NE31 2RW |
| Hastings Parade | NE31 2AG |
| Hatfield Avenue | NE31 2XY |
| Hautmont Road | NE31 2RQ |
| Howe Street | NE31 2XH NE31 2XL |
| Jervis Street | NE31 2XP NE31 2XR |
| Jubilee Court | NE31 2YD |
| Kings Avenue | NE31 2SQ |
| Lukes Lane Estate | NE31 2BB |
| Marine Drive | NE31 2BA |
| Marr Road | NE31 2SD |
| Morecambe Parade | NE31 2AH |
| Nevilles Cross Road | NE31 2SA |
| Oxford Crescent | NE31 2XT |
| Palmer Crescent | NE31 2XZ |
| Penrith Road | NE31 2RG NE31 2RJ |
| Penzance Parade | NE31 2AP |
| Portrush Drive | NE31 2FA NE31 2FB |
| Red House Road | NE31 2XF NE31 2XG NE31 2XS NE31 2EH |
| Rhyl Parade | NE31 2AW |
| Rother Close | NE31 2FG |
| Scarborough Parade | NE31 2AL |
| Skegness Parade | NE31 2AJ |
| Southend Parade | NE31 2AR |
| Southport Parade | NE31 2AQ |
| Thirlmere Court | NE31 2RP |
| Torquay Parade | NE31 2AD |
| Troon Walk | NE31 2FD |
| Turnberry Drive | NE31 2EJ NE31 2EL |
| Ushaw Road | NE31 2YA NE31 2YE |
| Victoria Road East | NE31 1YD NE31 1YE NE31 1YF NE31 2FF |
| Wentworth Close | NE31 2FE |
| Windermere Crescent | NE31 2RL NE31 2RN |
| Witty Avenue | NE31 2SE |
| NE31 2RH |
Transport near Monkton
- FAQ
- Price Paid By Year
- Property Type Price
Frequently asked questions about Monkton
What is the average price for a property for sale in Monkton?
The average price for a property for sale in Monkton is £163,135. This amount is 4% lower than the average price in Hebburn. There are 1,294 property listings for sale in Monkton.
What streets have the most expensive properties for sale in Monkton?
The streets with the most expensive properties for sale in Monkton are Adair Way at an average of £239,997, Wentworth Close at an average of £237,897 and Turnberry Drive at an average of £237,731.
What streets have the most affordable properties for sale in Monkton?
The streets with the most affordable properties for sale in Monkton are Collingwood Street at an average of £62,000, Victoria Road East at an average of £63,875 and Howe Street at an average of £70,750.
Which train stations are available in or near Monkton?
Some of the train stations available in or near Monkton are Heworth, Manors and Newcastle.
Property Price Paid in Monkton by Year
The average sold property price by year was:
| Year | Average Sold Price | Price Change |
Sold Properties
|
|---|---|---|---|
| 2025 | £141,549 | -14% |
29 Properties |
| 2024 | £161,701 | -6% |
83 Properties |
| 2023 | £170,660 | 9% |
99 Properties |
| 2022 | £154,942 | 19% |
99 Properties |
| 2021 | £126,082 | -5% |
92 Properties |
| 2020 | £132,263 | -2% |
77 Properties |
| 2019 | £134,456 | -5% |
53 Properties |
| 2018 | £140,845 | 2% |
78 Properties |
| 2017 | £137,978 | 46% |
58 Properties |
| 2016 | £74,845 | 5% |
29 Properties |
| 2015 | £70,907 | -5% |
28 Properties |
| 2014 | £74,503 | 1% |
30 Properties |
| 2013 | £73,882 | 2% |
20 Properties |
| 2012 | £72,388 | -8% |
9 Properties |
| 2011 | £78,500 | 4% |
12 Properties |
| 2010 | £75,077 | -12% |
18 Properties |
| 2009 | £84,187 | -10% |
16 Properties |
| 2008 | £92,970 | 9% |
22 Properties |
| 2007 | £84,546 | -5% |
74 Properties |
| 2006 | £88,917 | 13% |
87 Properties |
| 2005 | £77,687 | 17% |
54 Properties |
| 2004 | £64,125 | 27% |
73 Properties |
| 2003 | £46,565 | 30% |
75 Properties |
| 2002 | £32,602 | 13% |
84 Properties |
| 2001 | £28,481 | -2% |
25 Properties |
| 2000 | £28,946 | 2% |
32 Properties |
| 1999 | £28,432 | -1% |
23 Properties |
| 1998 | £28,771 | 12% |
28 Properties |
| 1997 | £25,187 | -4% |
21 Properties |
| 1996 | £26,200 | 1% |
24 Properties |
| 1995 | £25,839 | - |
19 Properties |
Property Price per Property Type in Monkton
Here you can find historic sold price data in order to help with your property search.
The average Property Paid Price for specific property types in the last three years are:
| Property Type | Average Sold Price | Sold Properties |
|---|---|---|
| Semi Detached House | £179,585.00 | 62 Semi Detached Houses |
| Detached House | £296,828.00 | 31 Detached Houses |
| Terraced House | £149,872.00 | 76 Terraced Houses |
| Flat | £64,172.00 | 42 Flats |

