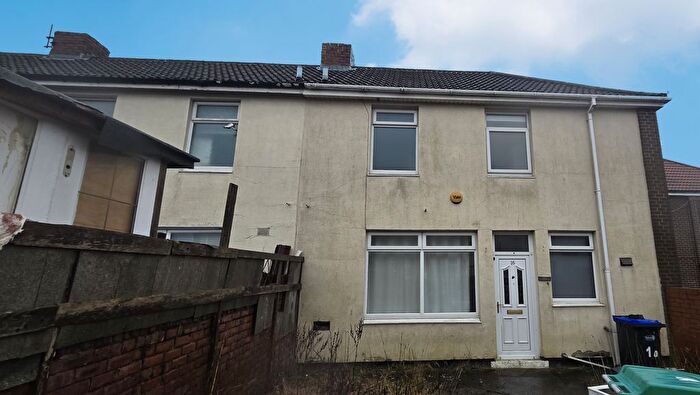
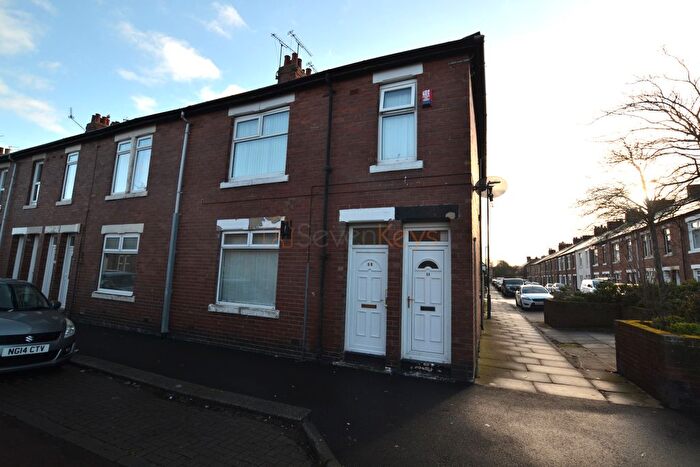
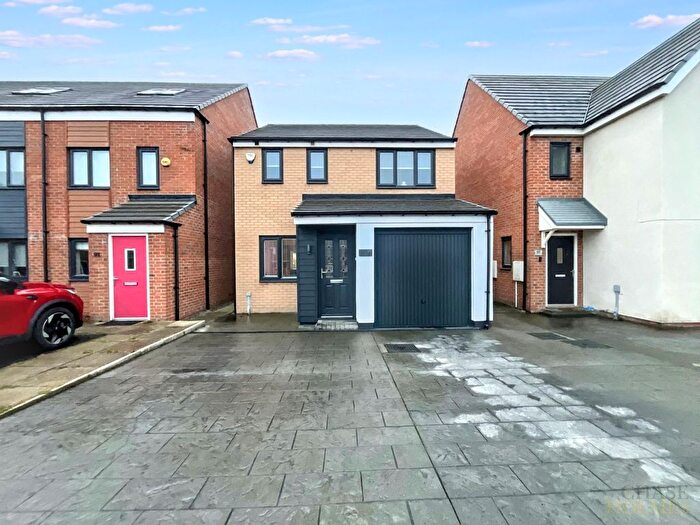
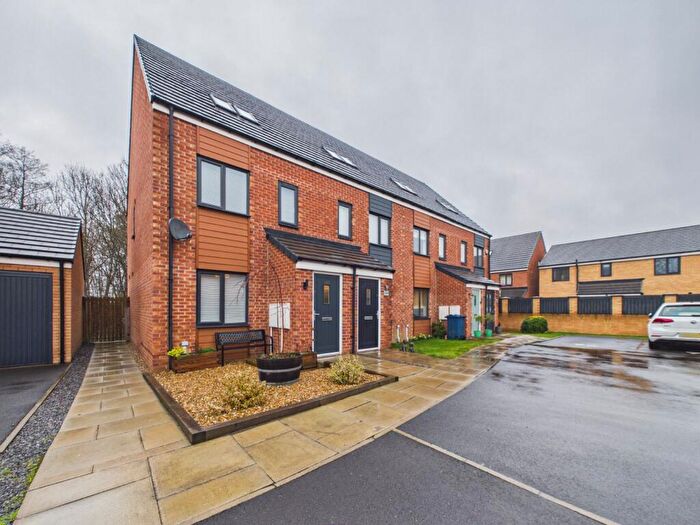
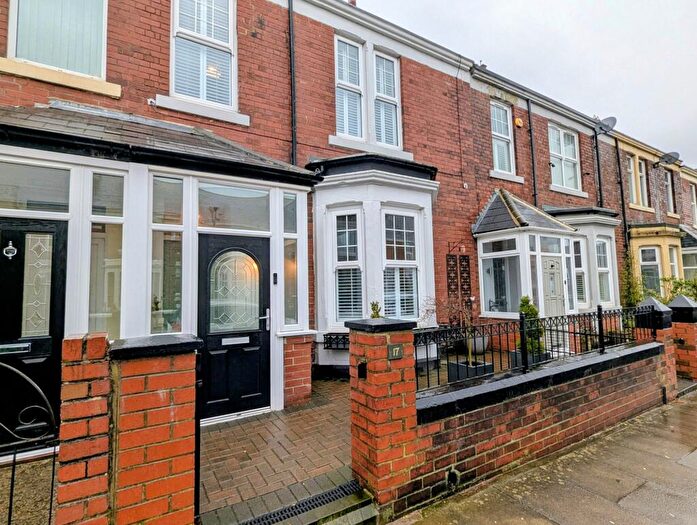
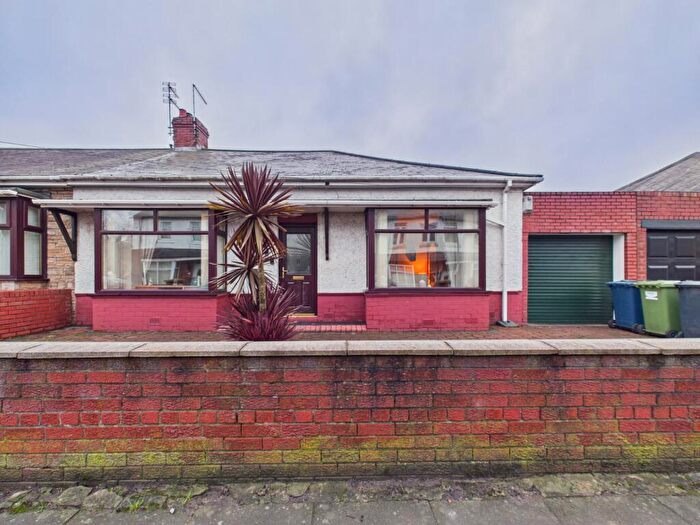
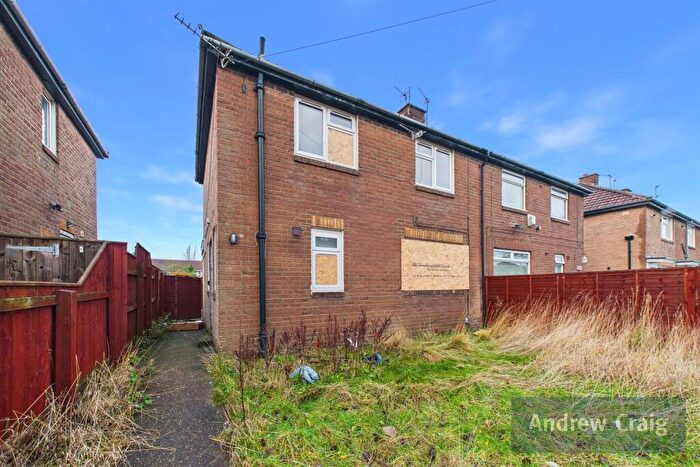
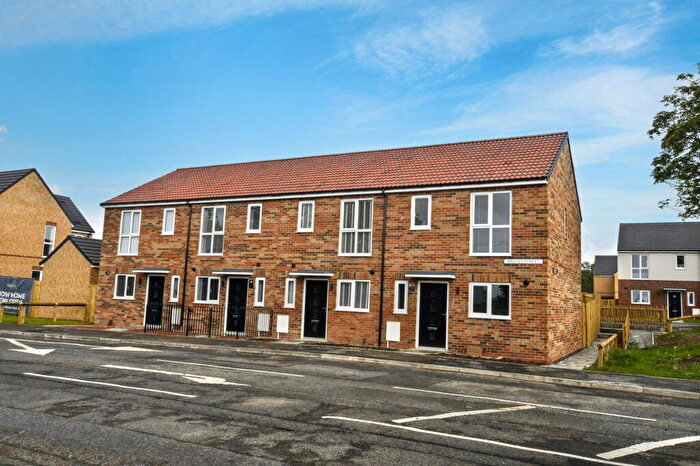
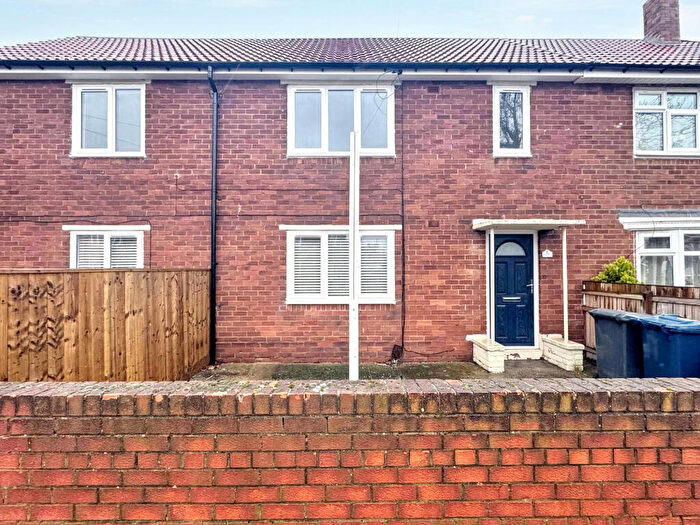
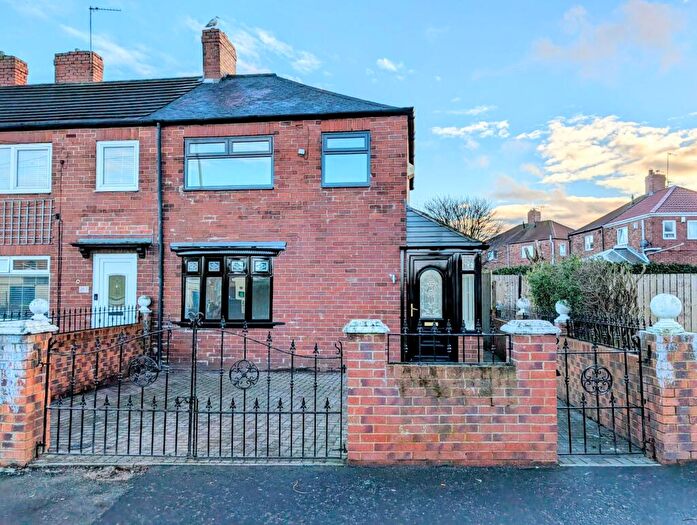
Houses for sale & to rent in Hebburn North, Hebburn
House Prices in Hebburn North
Properties in Hebburn North have an average house price of £137,373.00 and had 331 Property Transactions within the last 3 years¹.
Hebburn North is an area in Hebburn, South Tyneside with 3,651 households², where the most expensive property was sold for £525,000.00.
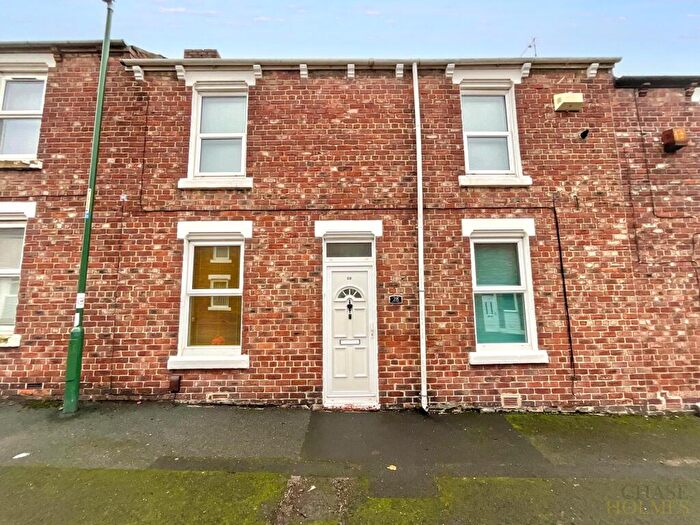
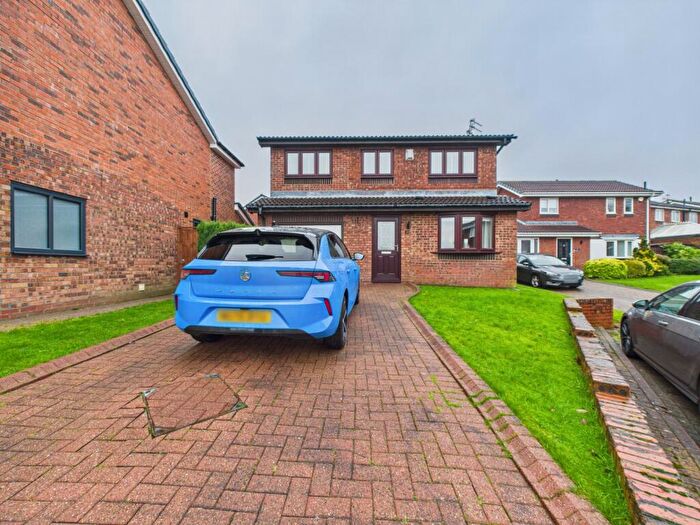
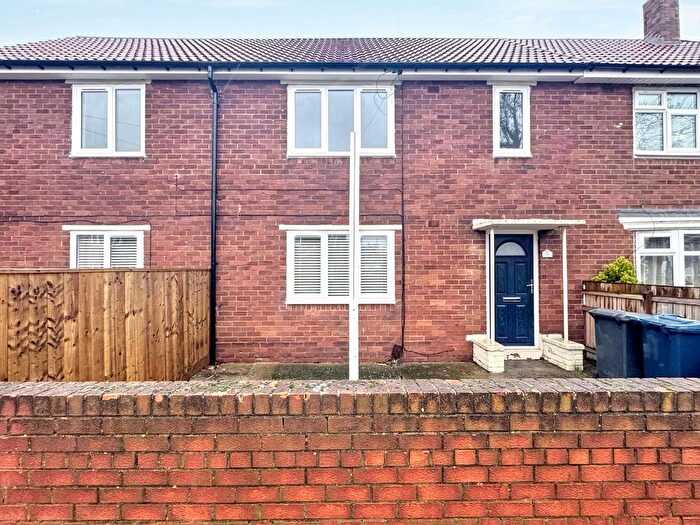
Properties for sale in Hebburn North
Roads and Postcodes in Hebburn North
Navigate through our locations to find the location of your next house in Hebburn North, Hebburn for sale or to rent.
| Streets | Postcodes |
|---|---|
| Agincourt | NE31 1AN NE31 1AW |
| Albert Street | NE31 1DW NE31 1EL |
| Aln Street | NE31 1XS NE31 1XT |
| Alwin Grange | NE31 1HG |
| Ann Street | NE31 1DP |
| Argyle Street | NE31 1BQ NE31 1RD |
| Ashwood Croft | NE31 1BT |
| Auckland Road | NE31 1SU |
| Barnard Crescent | NE31 1HW |
| Bellona Close | NE31 1FF |
| Bicester Grove | NE31 1AQ |
| Black Road | NE31 1HQ NE31 1HY |
| Brancepeth Road | NE31 1SJ |
| Buchanan Street | NE31 1NB |
| Byron Avenue | NE31 1JE NE31 1JJ NE31 1JL NE31 1JP |
| Caledonian Street | NE31 1BY |
| Campbell Park Road | NE31 1PS NE31 1QF NE31 1QH NE31 1QJ NE31 1QY |
| Carter Avenue | NE31 1QS |
| Church Street | NE31 1DR |
| Coleridge Square | NE31 1QD |
| Colliery Close | NE31 1TA |
| Coppergate Court | NE31 1SH |
| Cressida Gardens | NE31 1FJ |
| Cuthbert Street | NE31 1DD NE31 1DJ |
| Davies Hall | NE31 1BN |
| Davy Close | NE31 1TG |
| Douglass Close | NE31 1AD |
| Durham Court | NE31 1JX NE31 1JY |
| East Street | NE31 1HL |
| Edward Street | NE31 1DX |
| Ellison Street | NE31 1BP NE31 1BW NE31 1EE |
| Elsdon Mews | NE31 1RE |
| Falkland Avenue | NE31 1PU |
| Glen Street | NE31 1NE NE31 1NG NE31 1NU NE31 1AB |
| Glenmoor | NE31 1DE |
| Graham Road | NE31 1NA |
| Hawthorne Avenue | NE31 1JG NE31 1QB |
| Hazelmoor | NE31 1DH |
| Hedgeley Road | NE31 1EZ NE31 1HA NE31 1HB NE31 1HD NE31 1HE NE31 1HF NE31 1PP NE31 1PR NE31 1PW NE31 1EX |
| High Lane Row | NE31 1SW NE31 1JR NE31 1SQ NE31 1SX |
| Hollystone Drive | NE31 1TB |
| Holystone Trading Estate | NE31 1BJ |
| Innesmoor | NE31 1XH |
| Jedmoor | NE31 1ET |
| Jutland Avenue | NE31 1QG NE31 1QP |
| Kipling Avenue | NE31 1JF |
| Lambton Road | NE31 1SL |
| Lamport Street | NE31 1DG |
| Landfall Drive | NE31 1FE |
| Lincoln Court | NE31 1JS |
| Lumley Court | NE31 1SE |
| Lycaon Gardens | NE31 1FH |
| Lyon Street | NE31 1DN NE31 1EG NE31 1DB |
| Makendon Street | NE31 1RF |
| Marina View | NE31 1RX NE31 1RY |
| May Close | NE31 1FD |
| Mcintyre Road | NE31 1SY |
| Milton Avenue | NE31 1PX NE31 1PY |
| Mons Avenue | NE31 1QL |
| Montrose Crescent | NE31 1TF |
| Oakwood | NE31 1EB |
| Olwen Drive | NE31 1AR |
| Page Street | NE31 1HJ |
| Parliament Street | NE31 1ED |
| Pinewood | NE31 1YP |
| Price Street | NE31 1DZ |
| Prince Consort Industrial Estate | NE31 1EH |
| Prince Consort Road | NE31 1DL NE31 1DS NE31 1BE |
| Railway Street | NE31 1HH |
| Ralph Street | NE31 1HP |
| Rede Avenue | NE31 1QT |
| River Gardens | NE31 1TN |
| School Street | NE31 1TE |
| Shakespeare Avenue | NE31 1PT NE31 1PZ |
| Sharpendon Street | NE31 1RZ |
| Shinwell Court | NE31 1FN |
| South Street | NE31 1JN |
| Spencer Street | NE31 1JW |
| Springwood | NE31 1DA |
| St Aloysius View | NE31 1RH NE31 1RQ NE31 1SZ NE31 1TJ |
| St Andrews Street | NE31 1AY |
| St Annes Close | NE31 1TL |
| St Anthonys Gardens | NE31 1RG |
| St Gabriel Avenue | NE31 1AG |
| St James Mall | NE31 1LE NE31 1LF |
| St Johns Precinct | NE31 1LQ |
| St Lukes Place | NE31 1RR |
| St Michaels Vale | NE31 1RL |
| St Nicholas Way | NE31 1RJ |
| St Oswalds | NE31 1HS NE31 1HT NE31 1HU NE31 1HX |
| St Oswalds Road | NE31 1HR |
| St Rollox Street | NE31 1ND |
| Station Road | NE31 1LA NE31 1AA NE31 1BD NE31 1LB NE31 1NX NE31 1PN |
| Tennant Street | NE31 1LN |
| Tennyson Avenue | NE31 1QA |
| The Cornfields | NE31 1YH NE31 1YJ |
| The Riverside | NE31 1BG |
| Thomas Drive | NE31 1RU |
| Tidespring Row | NE31 1AS |
| Triumph Drive | NE31 1FB |
| Troilus Gardens | NE31 1FG |
| Tweed Street | NE31 1XP NE31 1XW |
| Tyne View | NE31 1EA |
| Usway Close | NE31 1TD |
| Verdun Avenue | NE31 1QQ |
| Victoria Road East | NE31 1JA NE31 1JB NE31 1JD NE31 1QN NE31 1QW NE31 1XQ NE31 1HZ NE31 1YQ |
| Victoria Road West | NE31 1AZ NE31 1LD |
| Victoria Street | NE31 1DY |
| Vimy Avenue | NE31 1QR |
| Wagonway Road | NE31 1SP |
| Walsh Avenue | NE31 1TT NE31 1TU |
| Waterside Park | NE31 1RS |
| West Street | NE31 1HN |
| Whickham Road | NE31 1QU NE31 1QX |
| Whites Gardens | NE31 1AU |
| Wilkinson Gardens | NE31 1TH |
| William Street | NE31 1BZ |
| William Street West | NE31 1DQ |
| William Terrace | NE31 1DF |
| Windmill Way | NE31 1AT NE31 1SR |
| Windsor Crescent | NE31 1JQ NE31 1JH |
| Witton Road | NE31 1SN |
| Wordsworth Avenue | NE31 1QE |
| Yorkwood | NE31 1YR |
| NE31 1LG |
Transport near Hebburn North
- FAQ
- Price Paid By Year
- Property Type Price
Frequently asked questions about Hebburn North
What is the average price for a property for sale in Hebburn North?
The average price for a property for sale in Hebburn North is £137,373. This amount is 19% lower than the average price in Hebburn. There are 860 property listings for sale in Hebburn North.
What streets have the most expensive properties for sale in Hebburn North?
The streets with the most expensive properties for sale in Hebburn North are St Lukes Place at an average of £341,250, Whites Gardens at an average of £340,000 and Waterside Park at an average of £282,500.
What streets have the most affordable properties for sale in Hebburn North?
The streets with the most affordable properties for sale in Hebburn North are Victoria Street at an average of £50,993, Vimy Avenue at an average of £55,250 and Prince Consort Road at an average of £73,303.
Which train stations are available in or near Hebburn North?
Some of the train stations available in or near Hebburn North are Heworth, Manors and Newcastle.
Property Price Paid in Hebburn North by Year
The average sold property price by year was:
| Year | Average Sold Price | Price Change |
Sold Properties
|
|---|---|---|---|
| 2025 | £145,405 | 5% |
114 Properties |
| 2024 | £138,662 | 8% |
115 Properties |
| 2023 | £126,942 | -10% |
102 Properties |
| 2022 | £140,180 | 7% |
166 Properties |
| 2021 | £130,640 | 9% |
156 Properties |
| 2020 | £118,562 | 0,1% |
98 Properties |
| 2019 | £118,468 | 1% |
133 Properties |
| 2018 | £117,285 | -5% |
138 Properties |
| 2017 | £123,074 | 1% |
176 Properties |
| 2016 | £122,458 | -2% |
166 Properties |
| 2015 | £125,435 | 2% |
163 Properties |
| 2014 | £122,514 | 12% |
168 Properties |
| 2013 | £107,952 | -13% |
127 Properties |
| 2012 | £122,443 | 3% |
98 Properties |
| 2011 | £119,209 | -15% |
89 Properties |
| 2010 | £137,638 | 11% |
94 Properties |
| 2009 | £122,768 | -6% |
104 Properties |
| 2008 | £129,809 | 3% |
124 Properties |
| 2007 | £126,095 | 8% |
263 Properties |
| 2006 | £116,124 | 16% |
248 Properties |
| 2005 | £97,740 | 17% |
152 Properties |
| 2004 | £80,818 | 20% |
143 Properties |
| 2003 | £64,889 | 28% |
191 Properties |
| 2002 | £46,551 | 5% |
197 Properties |
| 2001 | £44,035 | -19% |
155 Properties |
| 2000 | £52,199 | 21% |
192 Properties |
| 1999 | £41,070 | -1% |
131 Properties |
| 1998 | £41,469 | -2% |
132 Properties |
| 1997 | £42,116 | 5% |
118 Properties |
| 1996 | £40,142 | -3% |
156 Properties |
| 1995 | £41,326 | - |
139 Properties |
Property Price per Property Type in Hebburn North
Here you can find historic sold price data in order to help with your property search.
The average Property Paid Price for specific property types in the last three years are:
| Property Type | Average Sold Price | Sold Properties |
|---|---|---|
| Flat | £80,332.00 | 87 Flats |
| Semi Detached House | £156,961.00 | 63 Semi Detached Houses |
| Detached House | £289,675.00 | 31 Detached Houses |
| Terraced House | £130,753.00 | 150 Terraced Houses |

