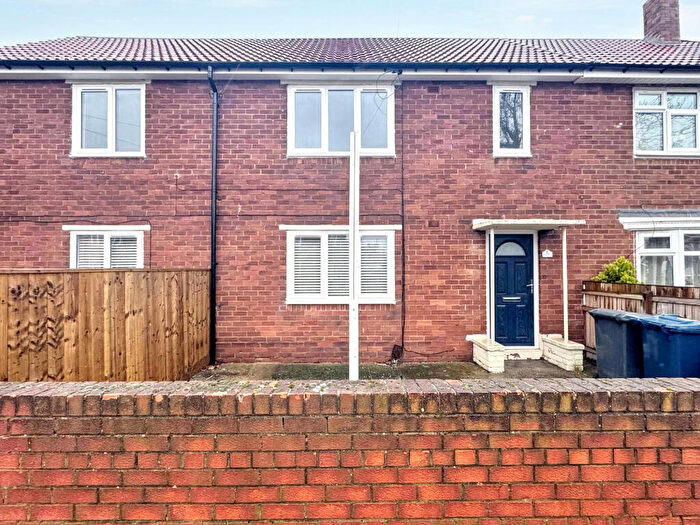
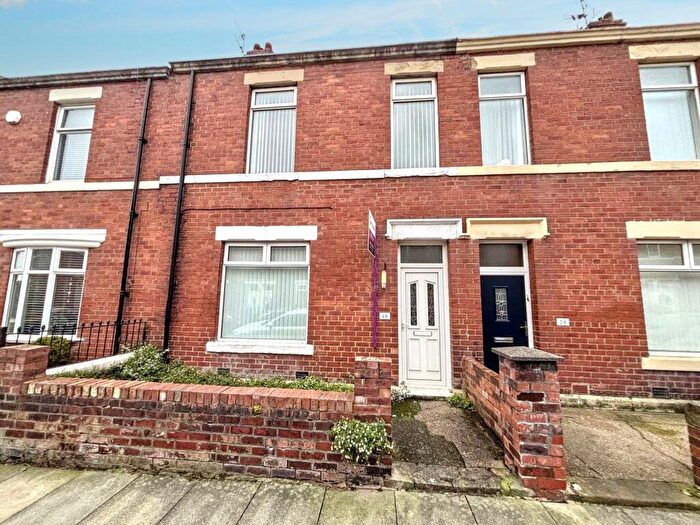
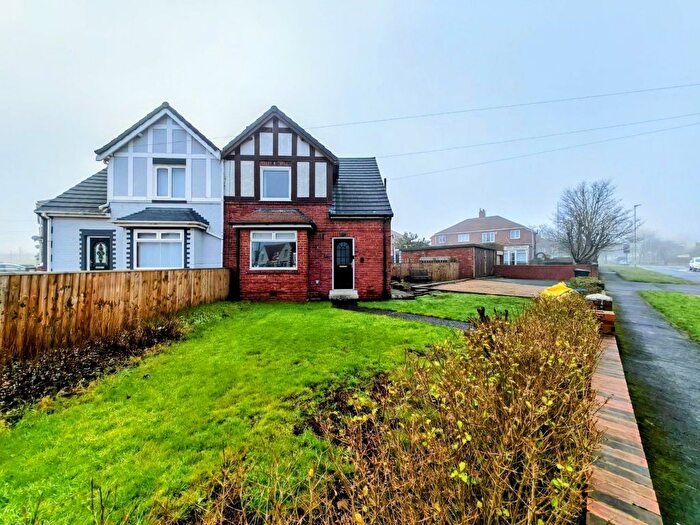
Houses for sale & to rent in Monkton, Jarrow
House Prices in Monkton
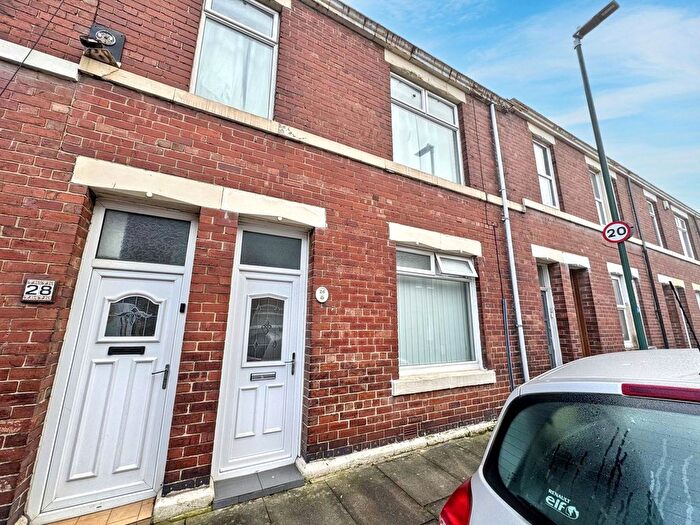
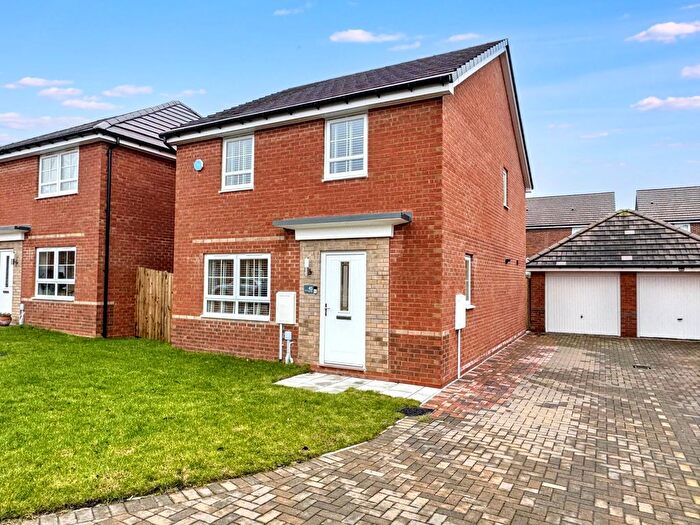
Properties in Monkton have an average house price of £171,275.00 and had 192 Property Transactions within the last 3 years¹.
Monkton is an area in Jarrow, South Tyneside with 1,959 households², where the most expensive property was sold for £700,000.00.
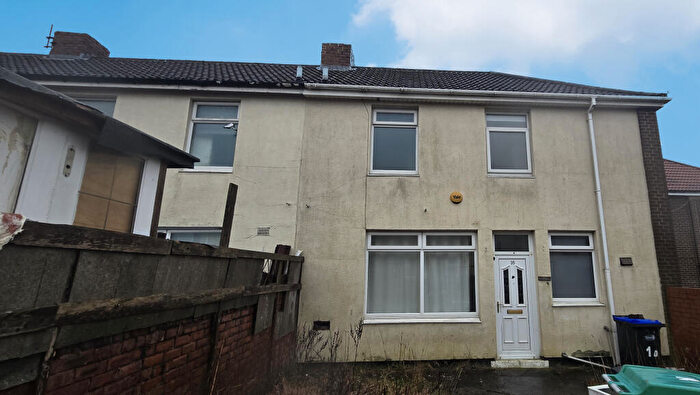
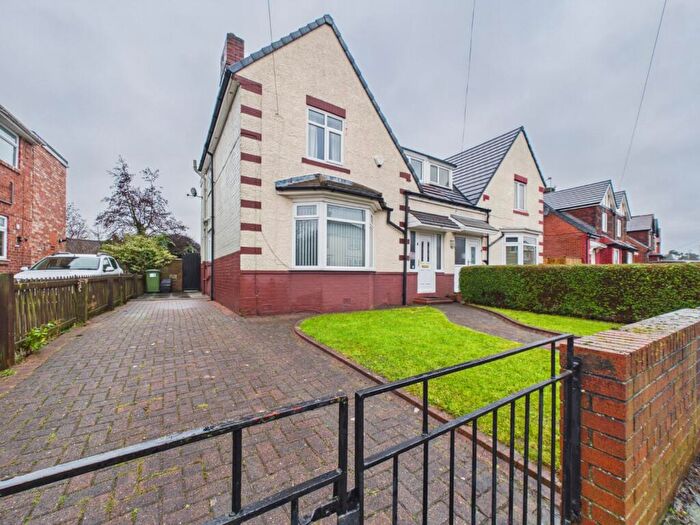
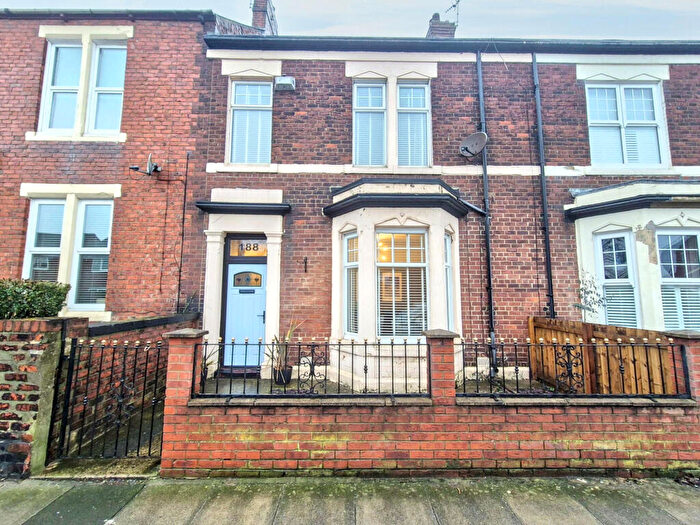
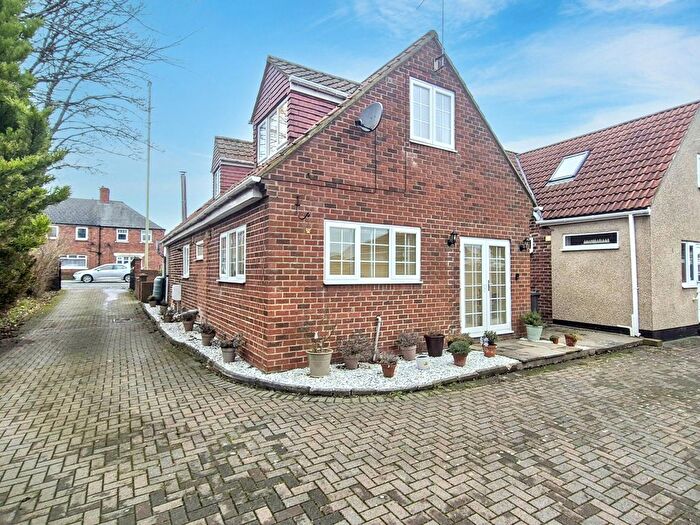
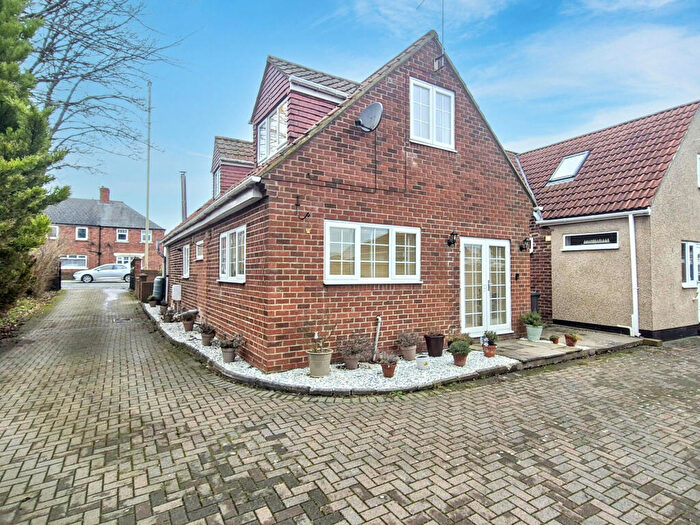
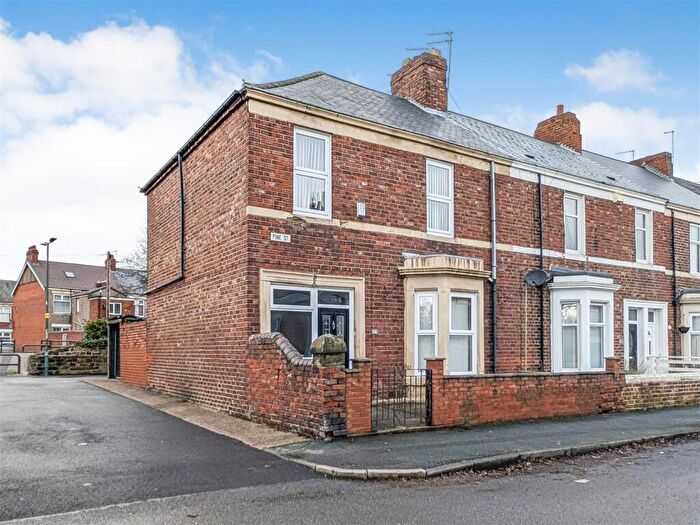
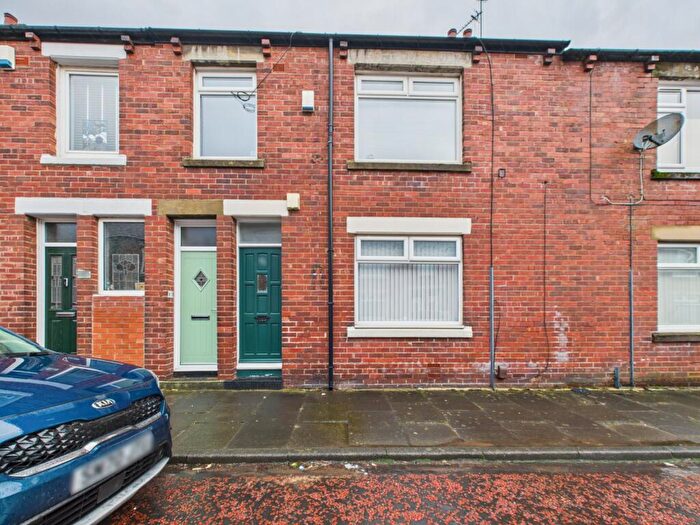
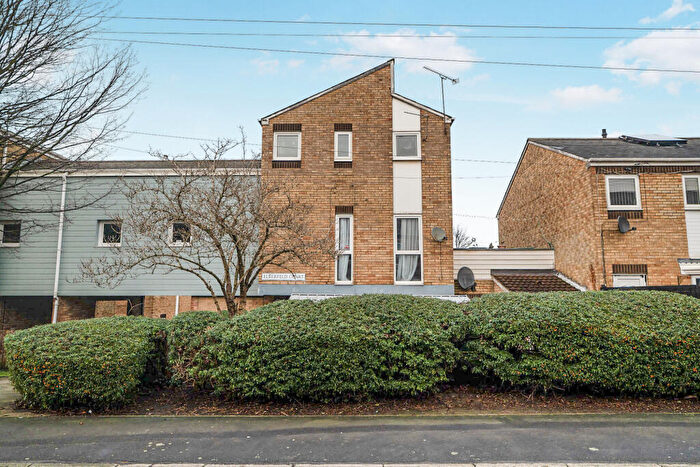
Properties for sale in Monkton
Roads and Postcodes in Monkton
Navigate through our locations to find the location of your next house in Monkton, Jarrow for sale or to rent.
| Streets | Postcodes |
|---|---|
| Albany Terrace | NE32 5NW |
| Albert Road | NE32 5JA NE32 5JB NE32 5JU NE32 5RR NE32 5RS NE32 5AD |
| Barns Close | NE32 5NY |
| Beaumont Terrace | NE32 5SG |
| Bede Burn Road | NE32 5AS NE32 5AT NE32 5AU NE32 5AX NE32 5AY NE32 5AZ NE32 5BW NE32 5RU NE32 5RX NE32 5AR NE32 5BA |
| Bede Burn View | NE32 5PQ |
| Beech Street | NE32 5LD |
| Belsfield Gardens | NE32 5QB |
| Birch Street | NE32 5HY |
| Breamish Street | NE32 5SH NE32 5SQ |
| Butchers Bridge Road | NE32 5QA |
| Caroline Street | NE32 5HP |
| Cheviot Road | NE32 5NT |
| Coquet Street | NE32 5LZ NE32 5SW |
| Crusade Walk | NE32 5LH |
| Dene Terrace | NE32 5NH NE32 5NJ NE32 5NQ |
| Dillon Street | NE32 5NA NE32 5SP |
| Edith Street | NE32 5HS |
| Elm Street | NE32 5JD |
| Ettrick Road | NE32 5SL NE32 5SN |
| Field Terrace | NE32 5PH NE32 5PP NE32 5BR |
| Fir Street | NE32 5LE |
| Grant Street | NE32 5HN |
| Havelock Terrace | NE32 5PW |
| Hazel Street | NE32 5LB |
| High Back Close | NE32 5PA NE32 5PB |
| Hill Street | NE32 5HU |
| Holly Street | NE32 5HZ |
| Kent Street | NE32 5RZ |
| Kent Villas | NE32 5SA |
| Kitchener Terrace | NE32 5PU |
| Laburnum Gardens | NE32 5NF |
| Maple Street | NE32 5JE |
| Marlborough Court | NE32 5RB |
| Mayfield Gardens | NE32 5LF |
| Monkton Lane | NE32 5NN NE32 5NP NE32 5NR NE32 5NS |
| Monkton Village | NE32 5NL |
| North View | NE32 5JQ |
| Northbourne Road | NE32 5JR NE32 5JS |
| Oak Street | NE32 5JY |
| Park Road | NE32 5JH NE32 5JL NE32 5SE |
| Park View | NE32 5QE |
| Penshaw View | NE32 5QG NE32 5RD |
| Pine Street | NE32 5JF |
| Railway Street | NE32 5HW |
| Rede Street | NE32 5SU |
| Roberts Terrace | NE32 5PY |
| Rothbury Avenue | NE32 5NU |
| Sherburn Grange North | NE32 5NB |
| Sherburn Grange South | NE32 5LS |
| South View | NE32 5JP |
| Surrey Street | NE32 5SB |
| Sussex Street | NE32 5SD |
| Teviot Way | NE32 5SJ |
| The Crescent | NE32 5NG |
| The Treetops | NE32 5ES |
| Tweed Street | NE32 5ND |
| Victoria Terrace | NE32 5SF |
| Wansbeck Road | NE32 5SR NE32 5SS NE32 5ST |
| Wellesley Street | NE32 5PJ |
| Wood Terrace | NE32 5LU NE32 5LY |
| Woodlea Court | NE32 5DB |
| Woodside Close | NE32 5AB |
| Wooler Walk | NE32 5NX |
| York Avenue | NE32 5LP NE32 5LT |
| York Street | NE32 5RY |
Transport near Monkton
- FAQ
- Price Paid By Year
- Property Type Price
Frequently asked questions about Monkton
What is the average price for a property for sale in Monkton?
The average price for a property for sale in Monkton is £171,275. This amount is 17% higher than the average price in Jarrow. There are 1,080 property listings for sale in Monkton.
What streets have the most expensive properties for sale in Monkton?
The streets with the most expensive properties for sale in Monkton are Wood Terrace at an average of £429,000, South View at an average of £335,000 and High Back Close at an average of £332,990.
What streets have the most affordable properties for sale in Monkton?
The streets with the most affordable properties for sale in Monkton are Park Road at an average of £43,250, Marlborough Court at an average of £50,500 and Elm Street at an average of £69,000.
Which train stations are available in or near Monkton?
Some of the train stations available in or near Monkton are Heworth, Manors and Newcastle.
Property Price Paid in Monkton by Year
The average sold property price by year was:
| Year | Average Sold Price | Price Change |
Sold Properties
|
|---|---|---|---|
| 2025 | £180,556 | 10% |
59 Properties |
| 2024 | £162,669 | -6% |
72 Properties |
| 2023 | £172,458 | 4% |
61 Properties |
| 2022 | £165,889 | 17% |
90 Properties |
| 2021 | £137,773 | -5% |
96 Properties |
| 2020 | £144,369 | 8% |
55 Properties |
| 2019 | £133,070 | -12% |
74 Properties |
| 2018 | £148,813 | 16% |
67 Properties |
| 2017 | £125,052 | 1% |
70 Properties |
| 2016 | £124,014 | 10% |
78 Properties |
| 2015 | £111,828 | -16% |
69 Properties |
| 2014 | £129,309 | 8% |
74 Properties |
| 2013 | £118,880 | -0,1% |
73 Properties |
| 2012 | £119,054 | -12% |
62 Properties |
| 2011 | £132,867 | 6% |
42 Properties |
| 2010 | £124,611 | 3% |
36 Properties |
| 2009 | £120,484 | 5% |
33 Properties |
| 2008 | £113,932 | -20% |
39 Properties |
| 2007 | £136,715 | 11% |
112 Properties |
| 2006 | £121,255 | 4% |
90 Properties |
| 2005 | £115,852 | 3% |
79 Properties |
| 2004 | £112,018 | 28% |
116 Properties |
| 2003 | £80,572 | 26% |
113 Properties |
| 2002 | £59,709 | 2% |
103 Properties |
| 2001 | £58,338 | 17% |
119 Properties |
| 2000 | £48,532 | 7% |
87 Properties |
| 1999 | £45,091 | -14% |
81 Properties |
| 1998 | £51,199 | 14% |
92 Properties |
| 1997 | £43,928 | 6% |
84 Properties |
| 1996 | £41,379 | -2% |
77 Properties |
| 1995 | £42,227 | - |
61 Properties |
Property Price per Property Type in Monkton
Here you can find historic sold price data in order to help with your property search.
The average Property Paid Price for specific property types in the last three years are:
| Property Type | Average Sold Price | Sold Properties |
|---|---|---|
| Semi Detached House | £211,541.00 | 61 Semi Detached Houses |
| Detached House | £344,768.00 | 11 Detached Houses |
| Terraced House | £156,576.00 | 87 Terraced Houses |
| Flat | £77,768.00 | 33 Flats |

