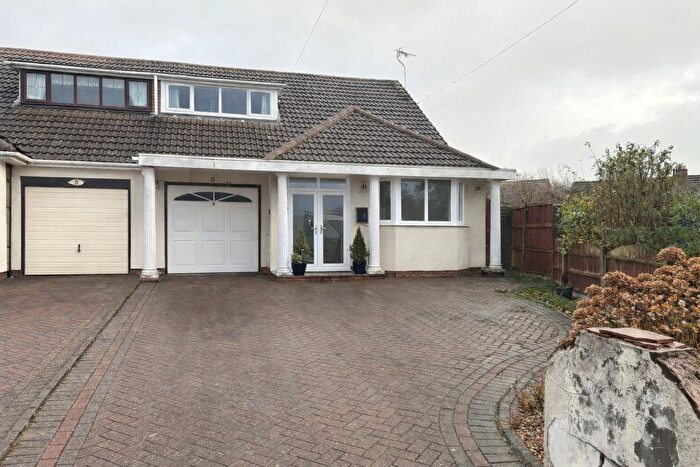
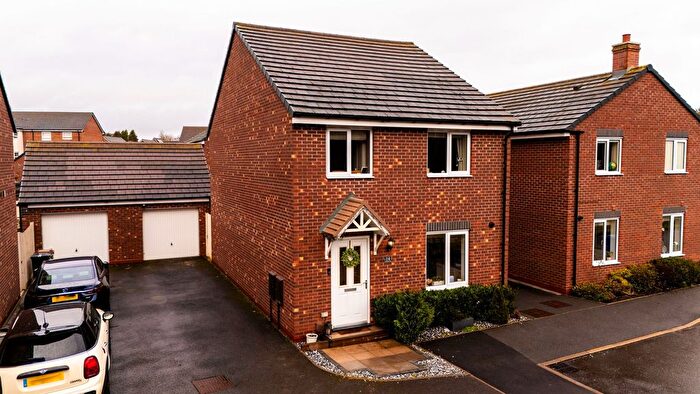
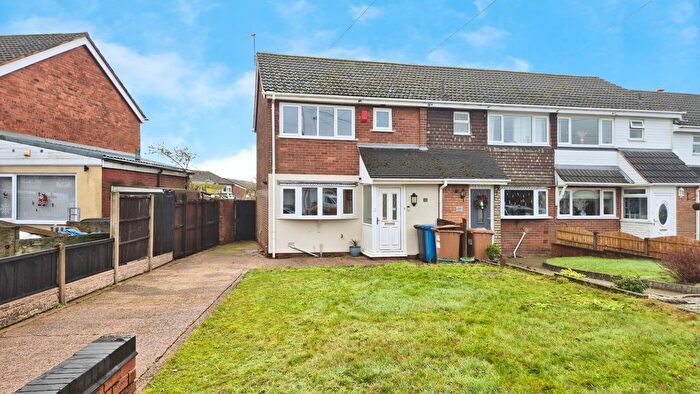
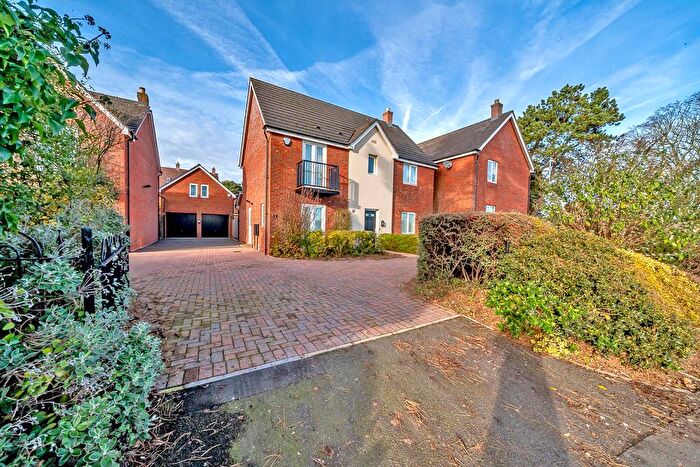
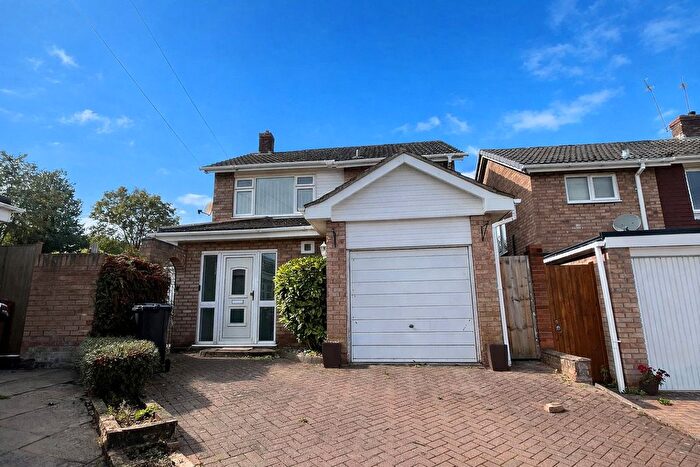
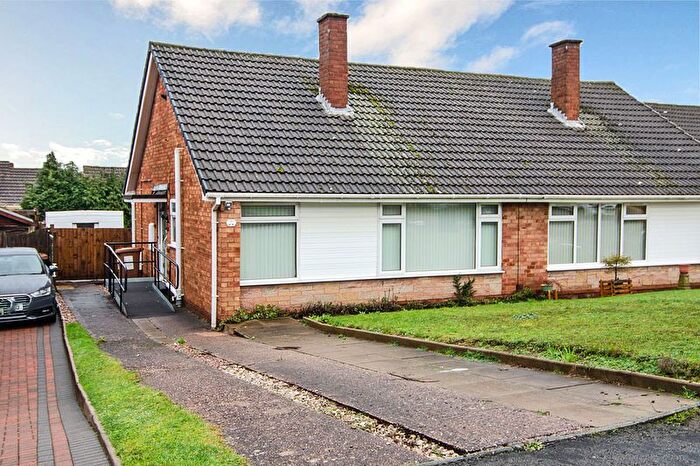
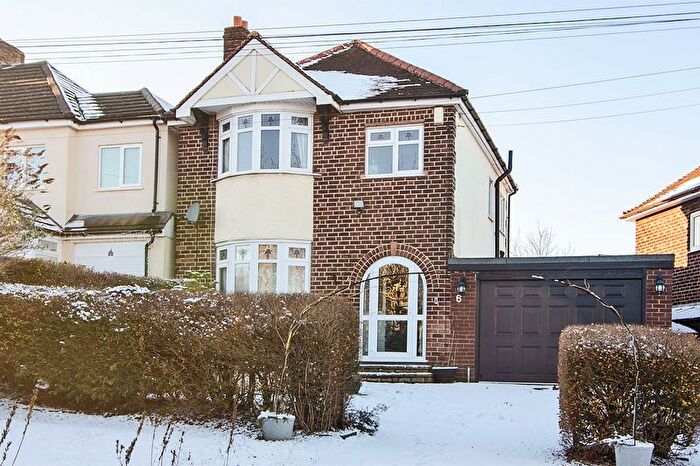
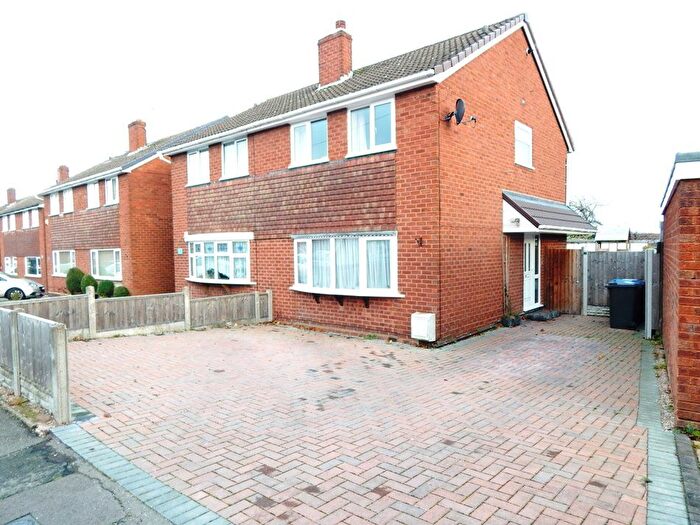
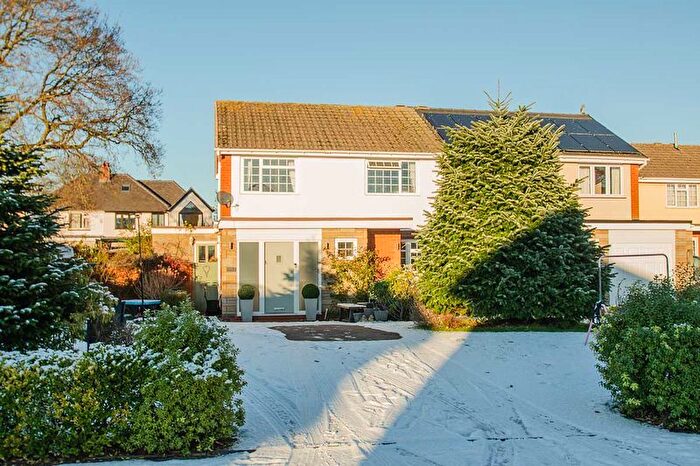
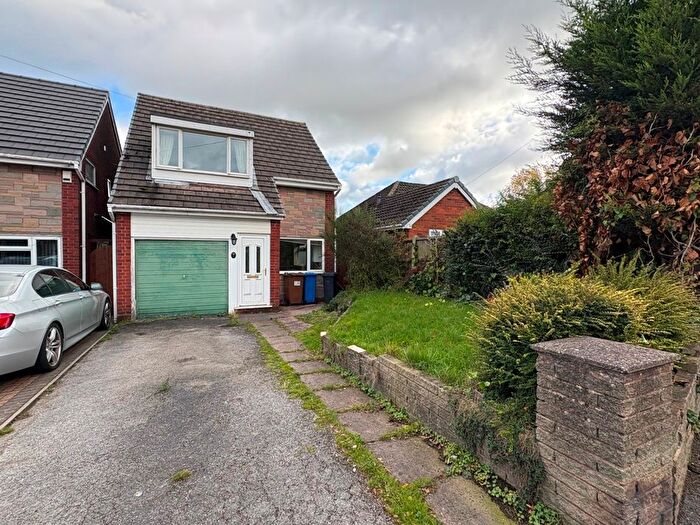
Houses for sale & to rent in Hammerwich, Burntwood
House Prices in Hammerwich
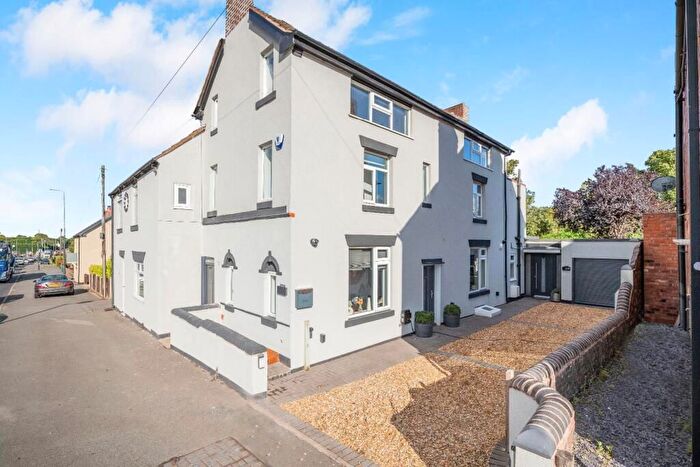
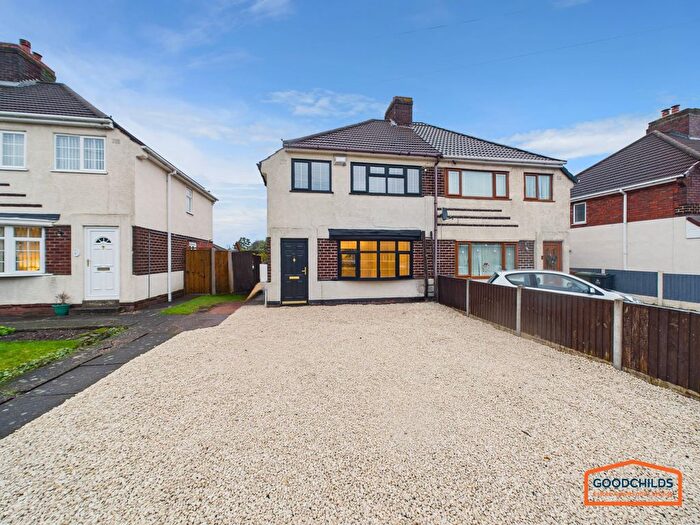
Properties in Hammerwich have an average house price of £338,403.00 and had 110 Property Transactions within the last 3 years¹.
Hammerwich is an area in Burntwood, Staffordshire with 1,295 households², where the most expensive property was sold for £1,000,000.00.
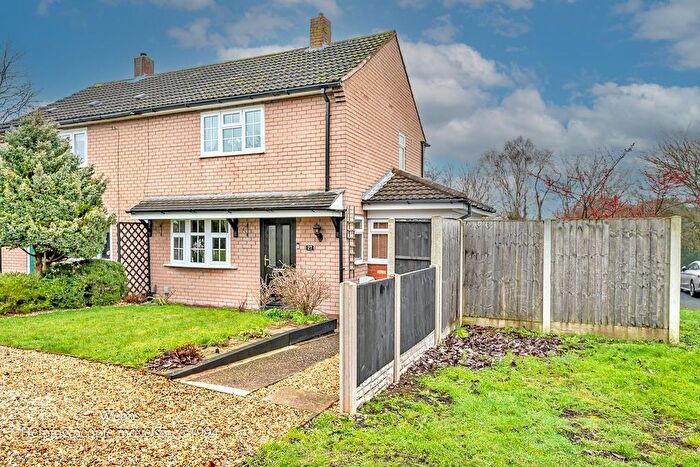
Properties for sale in Hammerwich
Previously listed properties in Hammerwich
Roads and Postcodes in Hammerwich
Navigate through our locations to find the location of your next house in Hammerwich, Burntwood for sale or to rent.
| Streets | Postcodes |
|---|---|
| Ashmall | WS7 0NA |
| Barncroft | WS7 4YG |
| Blackroot Close | WS7 0LA |
| Blackthorne Avenue | WS7 4YJ |
| Brook End | WS7 4SN |
| Brooklyn Road | WS7 4SJ |
| Burleigh Croft | WS7 4SL |
| Burntwood Road | WS7 0JG WS7 0JL WS7 0JQ WS7 0JW |
| Church Lane | WS7 0JS |
| Coppice Lane | WS7 0JX WS7 0JY |
| Coppy Nook Lane | WS7 0LL |
| Copthorne Avenue | WS7 4YH |
| Crane Drive | WS7 4SW |
| Elmhurst Drive | WS7 4YQ |
| Field Fare | WS7 0LW |
| Firs Walk | WS7 4UG |
| Forge Close | WS7 0JH |
| Foxcroft Close | WS7 4ST |
| Gorse Way | WS7 4TB |
| Hall Lane | WS7 0JP WS7 0JT WS7 0JU |
| Hanney Hay Road | WS7 4QZ |
| Hazelmere Drive | WS7 4YP |
| Highfields Road | WS7 4QT |
| Hillcrest Rise | WS7 4SH |
| Hospital Road | WS7 0ED WS7 0EJ WS7 0EQ WS7 4SF WS7 4SG |
| Knoll Close | WS7 4TD |
| Larkspur Avenue | WS7 4SR WS7 4SS |
| Lawnswood Avenue | WS7 4SZ WS7 4YD WS7 4YE |
| Lichfield Road | WS7 0HP WS7 0HT |
| Lions Den | WS7 0LE |
| Mansion Drive | WS7 0JD |
| Meerash Lane | WS7 0LF |
| Middleton Close | WS7 0LT |
| Mill Lane | WS7 0JR |
| Oatfield Close | WS7 4YF |
| Ogley Hay Road | WS7 4RA |
| Overhill Road | WS7 4SU |
| Overton Lane | WS7 0LH WS7 0LQ |
| Park Avenue | WS7 0EG |
| Park Road | WS7 0EE |
| Pine Tree Close | WS7 4TE |
| Pingle Lane | WS7 0JJ |
| Redfern Drive | WS7 4TA |
| Sedgemoor Avenue | WS7 0EF |
| Siskin Close | WS7 0LN |
| Station Road | WS7 0JZ |
| Stockhay Lane | WS7 0JE |
| The Ridgeway | WS7 4SP WS7 4SQ |
| Warren Road | WS7 4SY |
| Wharf Lane | WS7 4QY |
| Wheatcroft Close | WS7 4SX |
Transport near Hammerwich
-
Shenstone Station
-
Lichfield City Station
-
Landywood Station
-
Hednesford Station
-
Cannock Station
-
Lichfield Trent Valley Station
- FAQ
- Price Paid By Year
- Property Type Price
Frequently asked questions about Hammerwich
What is the average price for a property for sale in Hammerwich?
The average price for a property for sale in Hammerwich is £338,403. This amount is 28% higher than the average price in Burntwood. There are 1,168 property listings for sale in Hammerwich.
What streets have the most expensive properties for sale in Hammerwich?
The streets with the most expensive properties for sale in Hammerwich are Mill Lane at an average of £757,500, Siskin Close at an average of £590,000 and Mansion Drive at an average of £589,500.
What streets have the most affordable properties for sale in Hammerwich?
The streets with the most affordable properties for sale in Hammerwich are Lawnswood Avenue at an average of £223,333, Wharf Lane at an average of £227,500 and Pine Tree Close at an average of £227,500.
Which train stations are available in or near Hammerwich?
Some of the train stations available in or near Hammerwich are Shenstone, Lichfield City and Landywood.
Property Price Paid in Hammerwich by Year
The average sold property price by year was:
| Year | Average Sold Price | Price Change |
Sold Properties
|
|---|---|---|---|
| 2025 | £299,000 | -16% |
32 Properties |
| 2024 | £347,985 | -4% |
41 Properties |
| 2023 | £361,864 | 5% |
37 Properties |
| 2022 | £344,152 | 12% |
42 Properties |
| 2021 | £301,482 | 9% |
52 Properties |
| 2020 | £275,376 | 5% |
39 Properties |
| 2019 | £260,500 | 7% |
42 Properties |
| 2018 | £242,359 | 0,2% |
41 Properties |
| 2017 | £241,818 | 0,2% |
45 Properties |
| 2016 | £241,290 | -8% |
55 Properties |
| 2015 | £260,269 | 31% |
46 Properties |
| 2014 | £179,997 | -3% |
65 Properties |
| 2013 | £186,182 | -22% |
41 Properties |
| 2012 | £227,270 | 25% |
20 Properties |
| 2011 | £171,580 | -15% |
29 Properties |
| 2010 | £197,973 | -5% |
48 Properties |
| 2009 | £208,614 | 4% |
30 Properties |
| 2008 | £200,647 | 10% |
27 Properties |
| 2007 | £181,486 | -7% |
43 Properties |
| 2006 | £193,403 | -5% |
49 Properties |
| 2005 | £202,528 | -8% |
37 Properties |
| 2004 | £219,667 | 10% |
46 Properties |
| 2003 | £198,395 | 43% |
54 Properties |
| 2002 | £113,083 | 4% |
46 Properties |
| 2001 | £109,045 | 14% |
30 Properties |
| 2000 | £94,033 | 8% |
41 Properties |
| 1999 | £86,962 | -4% |
38 Properties |
| 1998 | £90,532 | 0,3% |
37 Properties |
| 1997 | £90,296 | 18% |
50 Properties |
| 1996 | £73,855 | 10% |
41 Properties |
| 1995 | £66,775 | - |
29 Properties |
Property Price per Property Type in Hammerwich
Here you can find historic sold price data in order to help with your property search.
The average Property Paid Price for specific property types in the last three years are:
| Property Type | Average Sold Price | Sold Properties |
|---|---|---|
| Semi Detached House | £311,507.00 | 59 Semi Detached Houses |
| Detached House | £412,084.00 | 35 Detached Houses |
| Terraced House | £312,846.00 | 13 Terraced Houses |
| Flat | £118,500.00 | 3 Flats |

