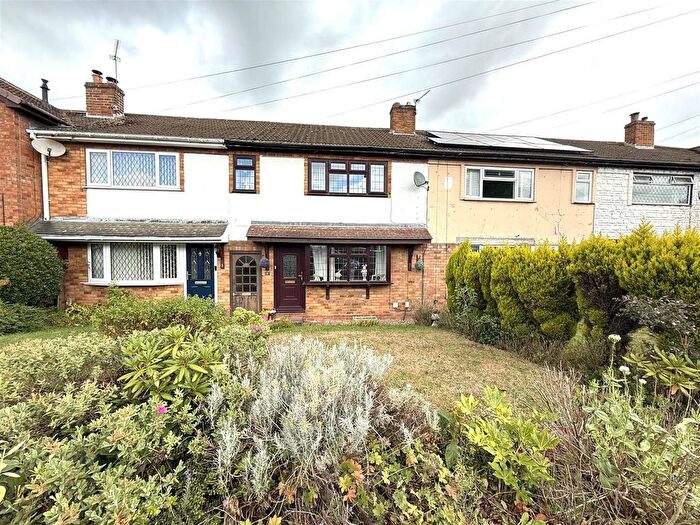
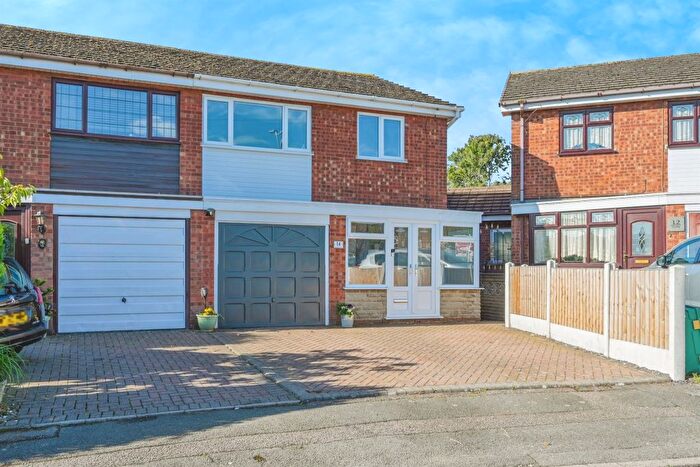
Houses for sale & to rent in All Saints, Burntwood
House Prices in All Saints
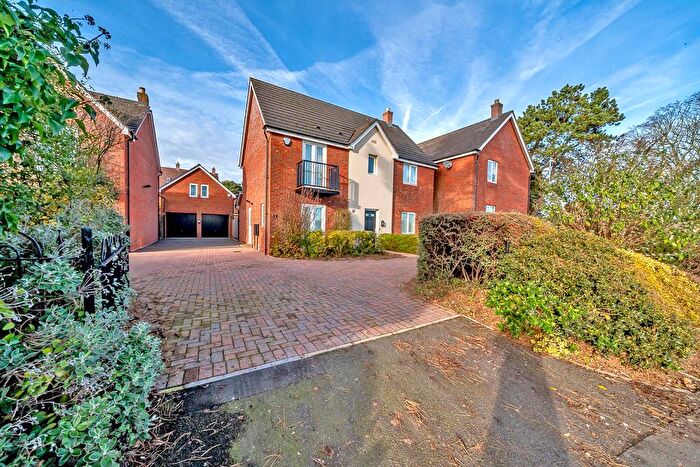
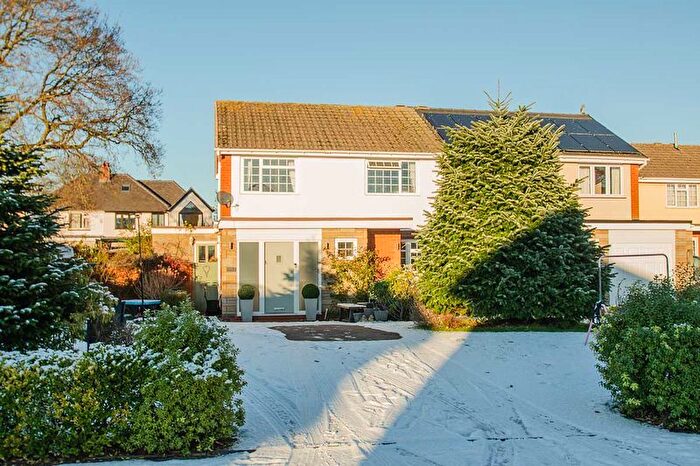
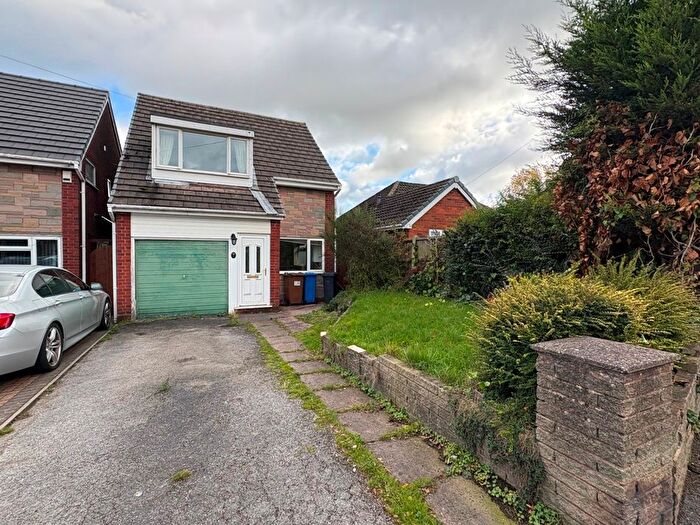
Properties in All Saints have an average house price of £250,038.00 and had 169 Property Transactions within the last 3 years¹.
All Saints is an area in Burntwood, Staffordshire with 1,483 households², where the most expensive property was sold for £850,000.00.
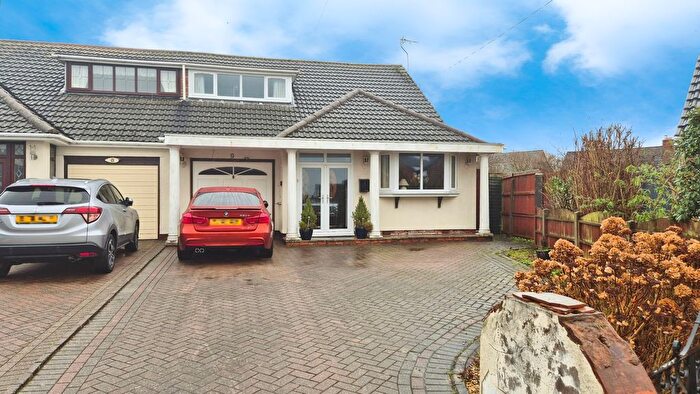
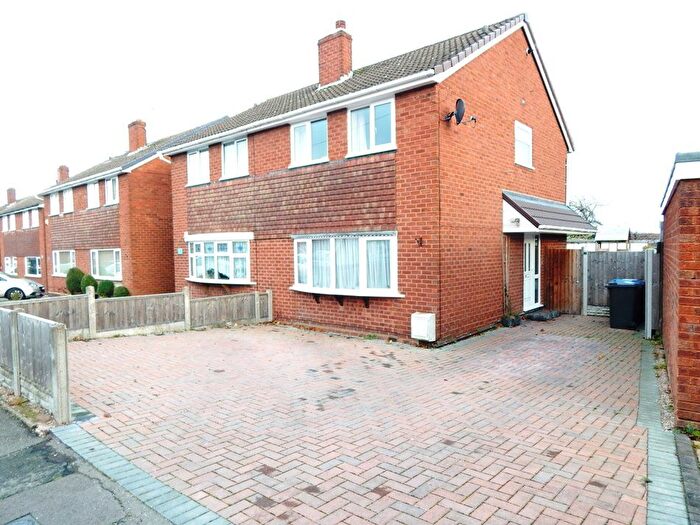
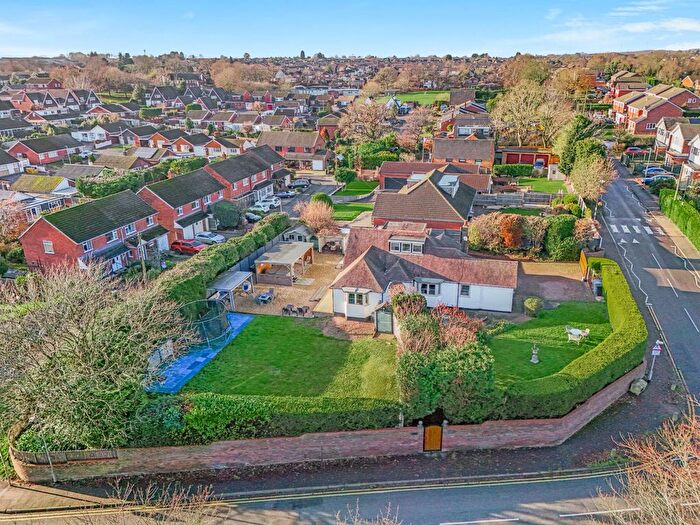
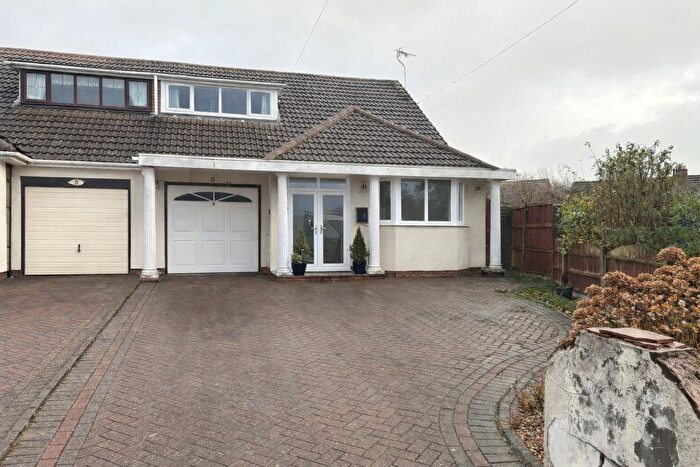
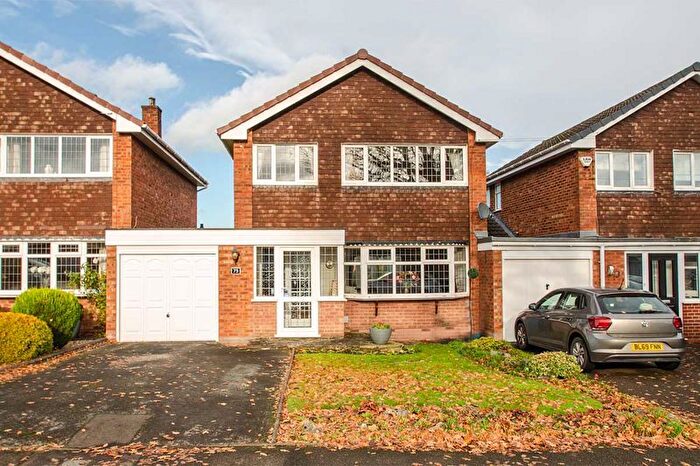
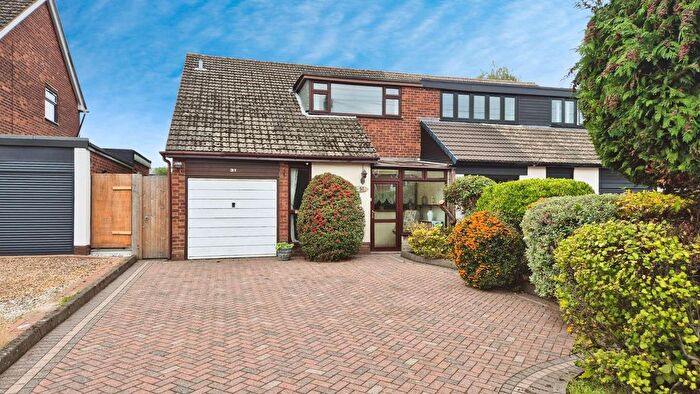
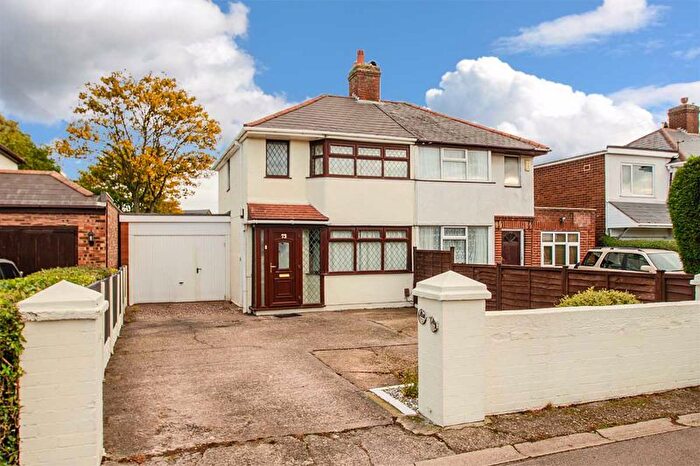
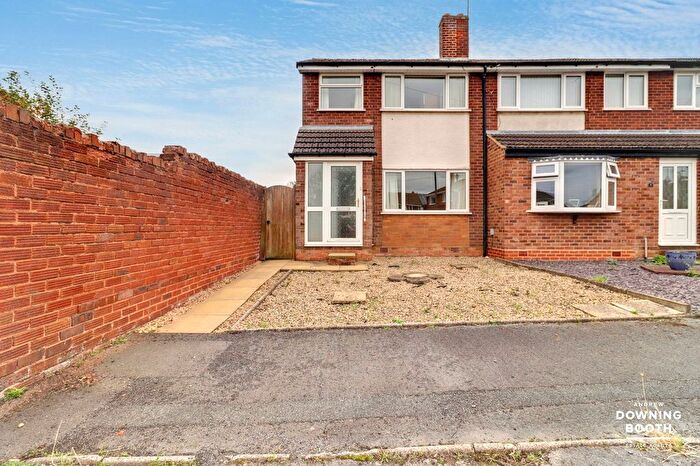
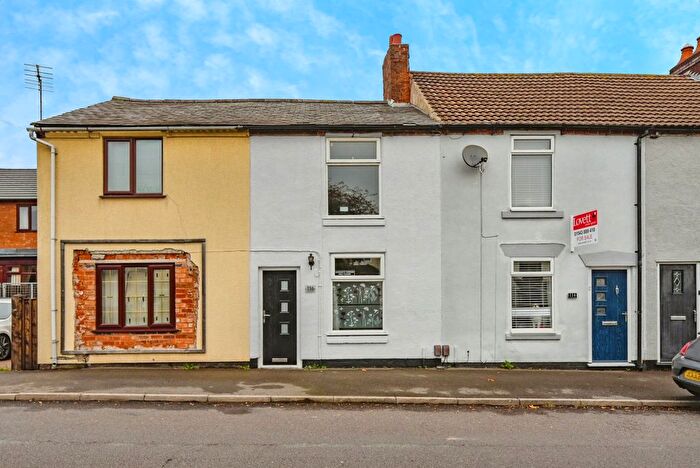
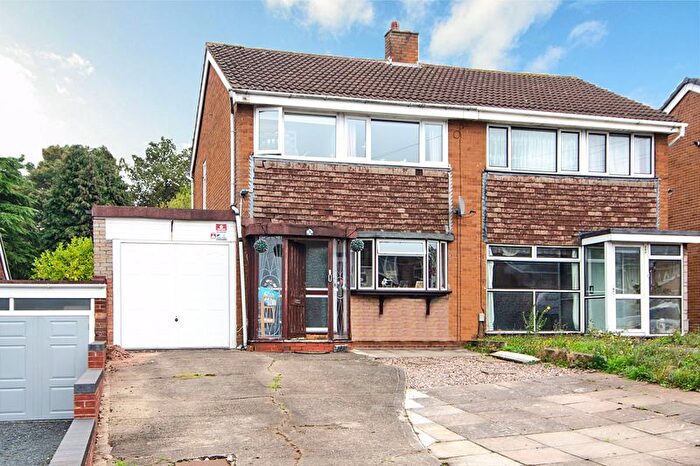
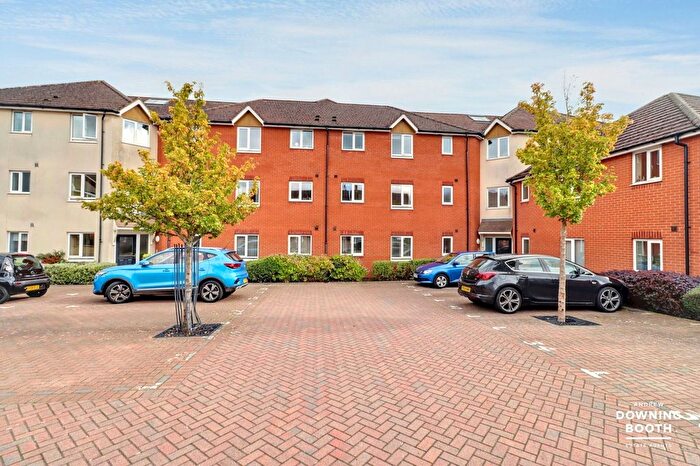
Properties for sale in All Saints
Previously listed properties in All Saints
Roads and Postcodes in All Saints
Navigate through our locations to find the location of your next house in All Saints, Burntwood for sale or to rent.
| Streets | Postcodes |
|---|---|
| Anson Close | WS7 9HW |
| Blandford Gardens | WS7 0EZ |
| Boney Hay Road | WS7 9AL |
| Bracken Close | WS7 9BD |
| Browning Road | WS7 9BH |
| Burns Drive | WS7 9BQ |
| Cannock Road | WS7 0BE WS7 0BJ WS7 0BL WS7 0BP WS7 0BS |
| Chase Road | WS7 0DP WS7 0DS WS7 0DT WS7 0DU |
| Chaseley Gardens | WS7 9DJ |
| Dale Drive | WS7 9AA |
| Darwin Close | WS7 9HP |
| Dewsbury Drive | WS7 0EX |
| Elder Lane | WS7 9BT |
| Emmanuel Road | WS7 9AD |
| Fairford Gardens | WS7 0EP |
| Garrick Rise | WS7 9HR |
| Gorstey Lea | WS7 9BG WS7 9DH |
| Highfields | WS7 9DB |
| Hudson Drive | WS7 0EW |
| Hunter Avenue | WS7 9AF WS7 9AQ |
| Jerome Way | WS7 9HS |
| Laurel Drive | WS7 9BL |
| Leigh Avenue | WS7 9AH |
| Lichfield Road | WS7 0HJ |
| Lime Grove | WS7 0HA |
| Maidstone Drive | WS7 0ET |
| Meadow View | WS7 0HL |
| Nailers Drive | WS7 0ER WS7 0ES WS7 0EY |
| New Road | WS7 0BU WS7 0BX |
| Norton Lane | WS7 0HE WS7 0HN WS7 0HW |
| Pooles Way | WS7 9BB |
| Rose Lane | WS7 9BU |
| Rugeley Road | WS7 9BA WS7 9BE WS7 9BJ |
| St Benedicts Road | WS7 0BY |
| St Giles Road | WS7 0BZ |
| St Lukes Road | WS7 0DH |
| St Marks Road | WS7 0DQ |
| St Pauls Road | WS7 0DF WS7 0DG |
| St Peters Road | WS7 0DJ |
| St Stephens Road | WS7 0DB |
| Stapleford Gardens | WS7 0EU |
| Swanfields | WS7 0BH |
| The Orchard | WS7 9NA |
| Tudor Close | WS7 0BW |
| Tudor Park Gardens | WS7 0BA |
| Tudor Road | WS7 0BN |
| Wedgewood Close | WS7 9HT |
| Westbourne Crescent | WS7 9AJ |
| Whitehouse Crescent | WS7 9AG |
| Willow Avenue | WS7 0HD |
| Woodford Crescent | WS7 9AE |
Transport near All Saints
-
Lichfield City Station
-
Shenstone Station
-
Hednesford Station
-
Lichfield Trent Valley Station
-
Cannock Station
-
Landywood Station
- FAQ
- Price Paid By Year
- Property Type Price
Frequently asked questions about All Saints
What is the average price for a property for sale in All Saints?
The average price for a property for sale in All Saints is £250,038. This amount is 5% lower than the average price in Burntwood. There are 449 property listings for sale in All Saints.
What streets have the most expensive properties for sale in All Saints?
The streets with the most expensive properties for sale in All Saints are Wedgewood Close at an average of £470,000, Norton Lane at an average of £342,800 and Darwin Close at an average of £312,500.
What streets have the most affordable properties for sale in All Saints?
The streets with the most affordable properties for sale in All Saints are Highfields at an average of £134,166, Lime Grove at an average of £186,666 and Woodford Crescent at an average of £190,000.
Which train stations are available in or near All Saints?
Some of the train stations available in or near All Saints are Lichfield City, Shenstone and Hednesford.
Property Price Paid in All Saints by Year
The average sold property price by year was:
| Year | Average Sold Price | Price Change |
Sold Properties
|
|---|---|---|---|
| 2025 | £280,305 | 9% |
36 Properties |
| 2024 | £253,919 | 9% |
38 Properties |
| 2023 | £229,854 | -6% |
46 Properties |
| 2022 | £243,739 | 8% |
49 Properties |
| 2021 | £223,337 | 4% |
65 Properties |
| 2020 | £214,068 | 9% |
58 Properties |
| 2019 | £195,851 | -5% |
42 Properties |
| 2018 | £204,723 | 13% |
61 Properties |
| 2017 | £178,151 | 6% |
58 Properties |
| 2016 | £167,231 | -2% |
51 Properties |
| 2015 | £170,516 | 5% |
53 Properties |
| 2014 | £162,525 | 4% |
55 Properties |
| 2013 | £155,440 | 8% |
66 Properties |
| 2012 | £142,557 | -12% |
33 Properties |
| 2011 | £159,030 | 3% |
39 Properties |
| 2010 | £154,839 | 16% |
34 Properties |
| 2009 | £130,138 | -3% |
35 Properties |
| 2008 | £133,649 | -20% |
30 Properties |
| 2007 | £160,733 | 1% |
68 Properties |
| 2006 | £159,503 | 16% |
69 Properties |
| 2005 | £134,605 | -1% |
35 Properties |
| 2004 | £136,472 | 14% |
63 Properties |
| 2003 | £116,825 | 25% |
54 Properties |
| 2002 | £87,869 | 6% |
75 Properties |
| 2001 | £82,680 | 14% |
80 Properties |
| 2000 | £71,336 | 12% |
67 Properties |
| 1999 | £63,057 | 3% |
58 Properties |
| 1998 | £61,094 | 12% |
49 Properties |
| 1997 | £53,490 | -1% |
63 Properties |
| 1996 | £53,885 | 12% |
58 Properties |
| 1995 | £47,187 | - |
54 Properties |
Property Price per Property Type in All Saints
Here you can find historic sold price data in order to help with your property search.
The average Property Paid Price for specific property types in the last three years are:
| Property Type | Average Sold Price | Sold Properties |
|---|---|---|
| Semi Detached House | £237,697.00 | 114 Semi Detached Houses |
| Detached House | £335,626.00 | 28 Detached Houses |
| Terraced House | £220,440.00 | 25 Terraced Houses |
| Flat | £125,250.00 | 2 Flats |

