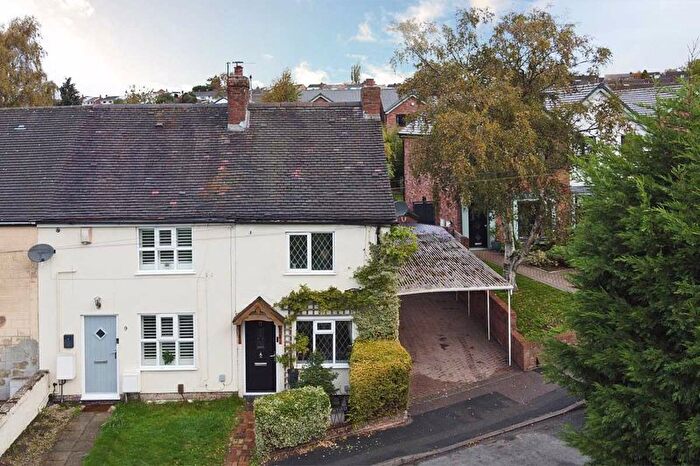
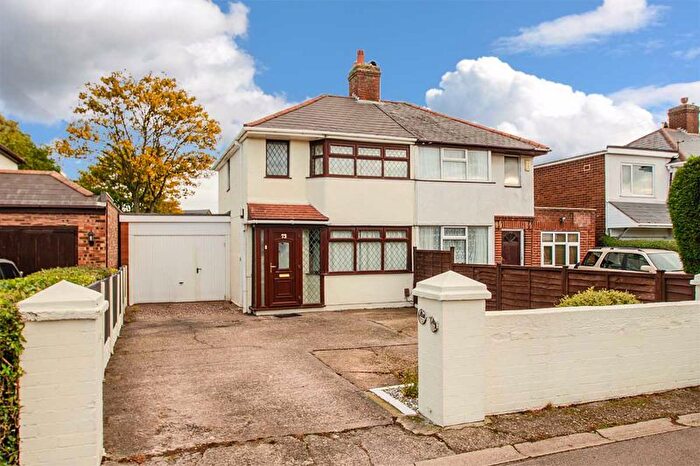
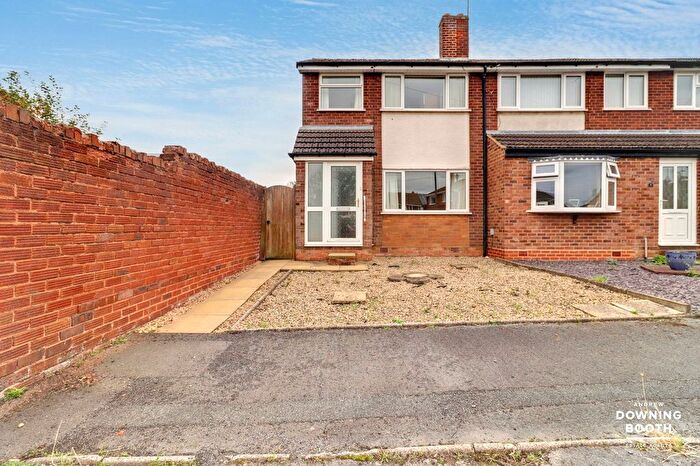
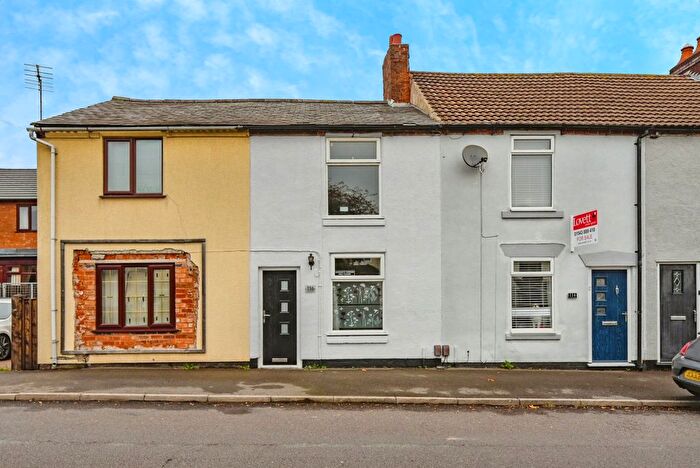
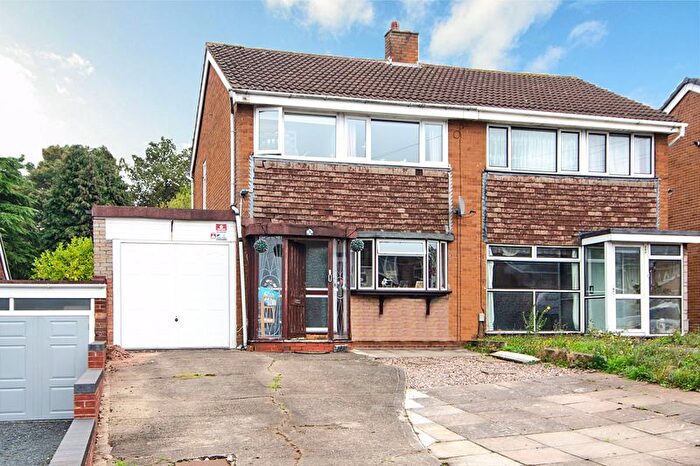
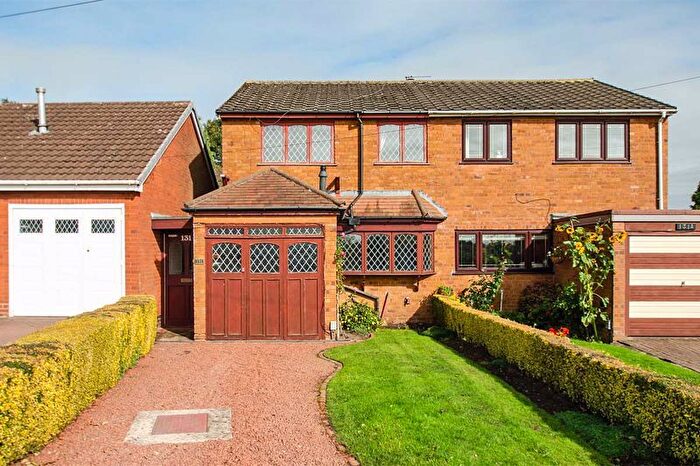
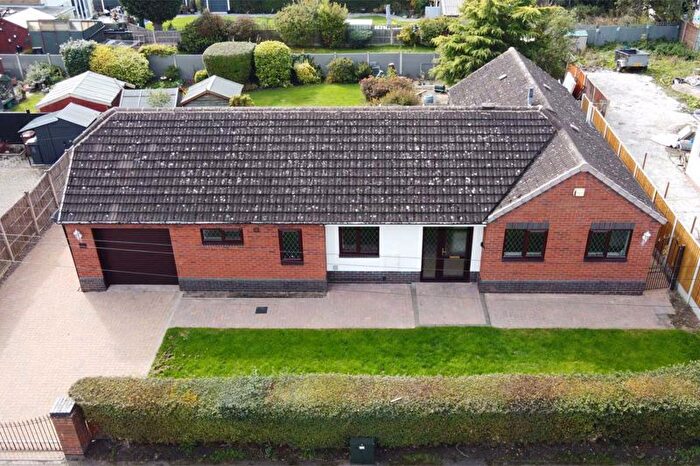
Houses for sale & to rent in Summerfield, Burntwood
House Prices in Summerfield
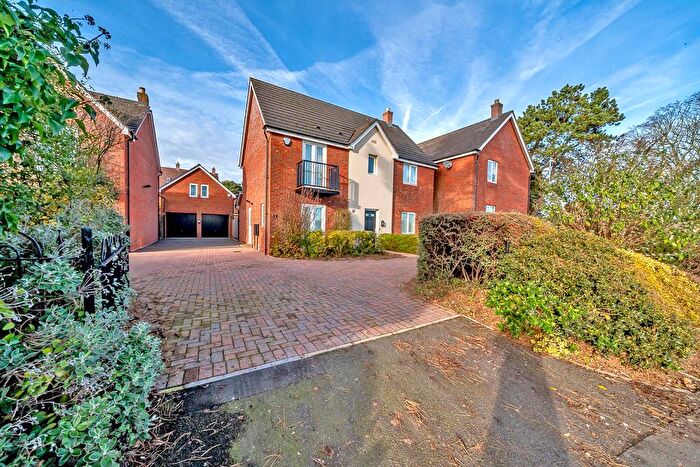
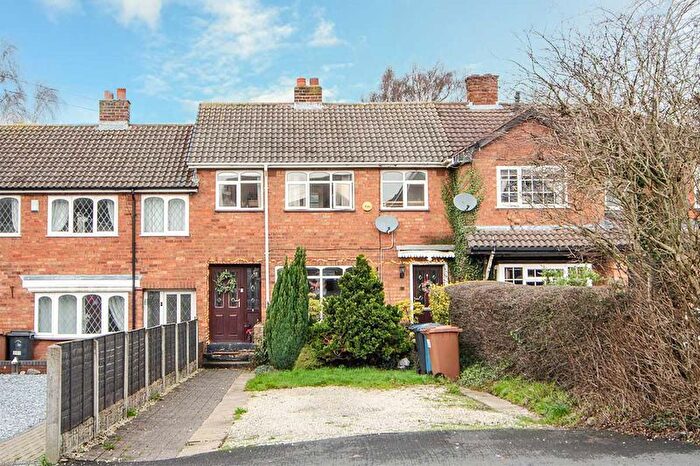
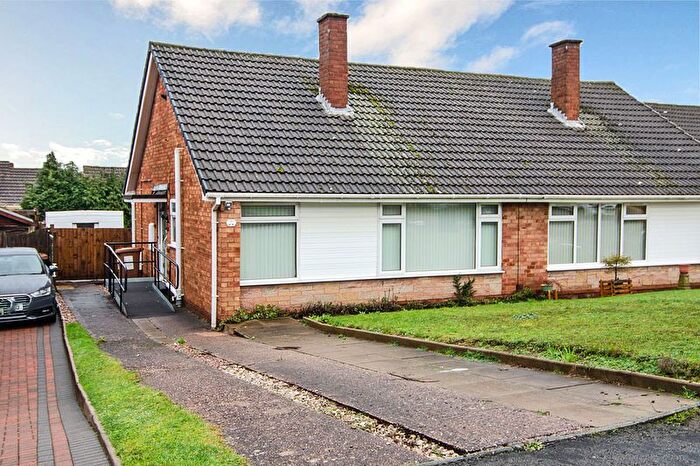
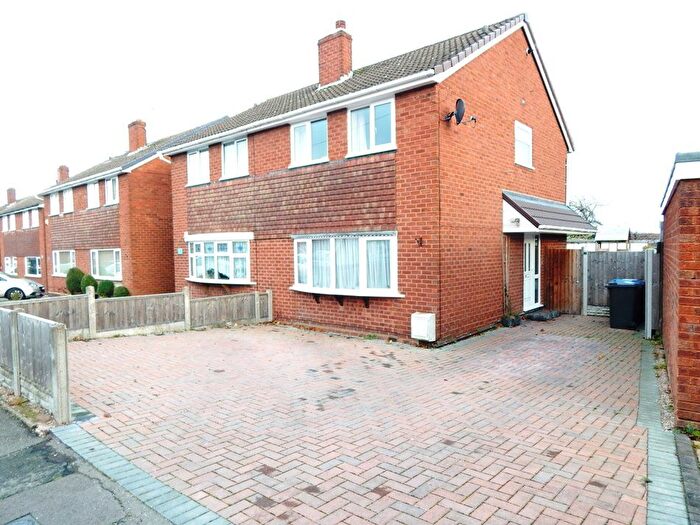
Properties in Summerfield have an average house price of £207,972.00 and had 118 Property Transactions within the last 3 years¹.
Summerfield is an area in Burntwood, Staffordshire with 1,500 households², where the most expensive property was sold for £415,000.00.
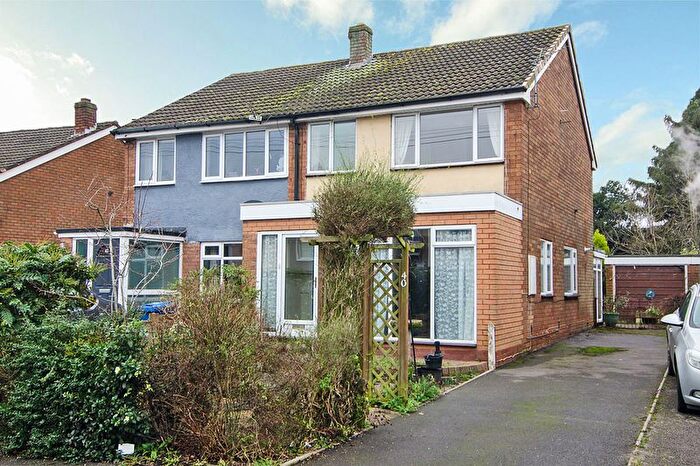
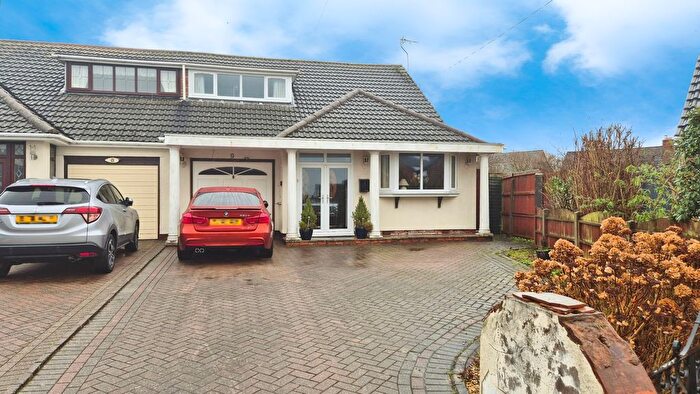
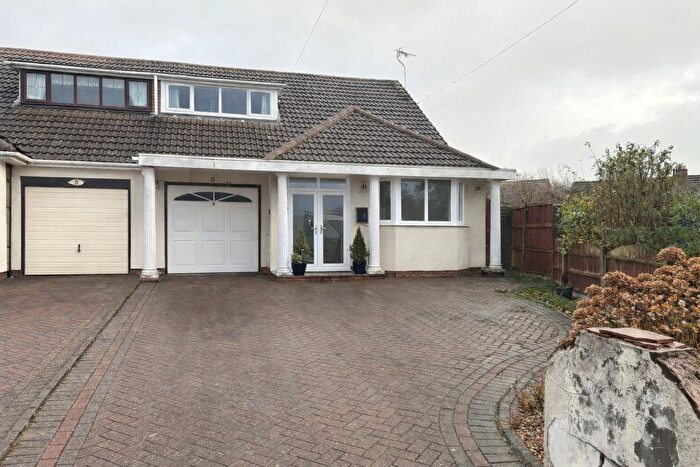
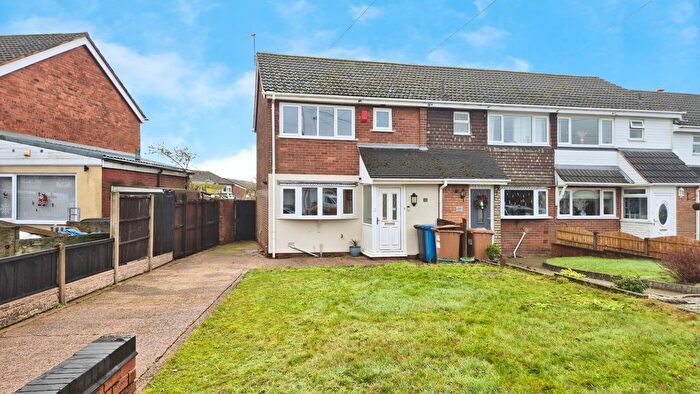
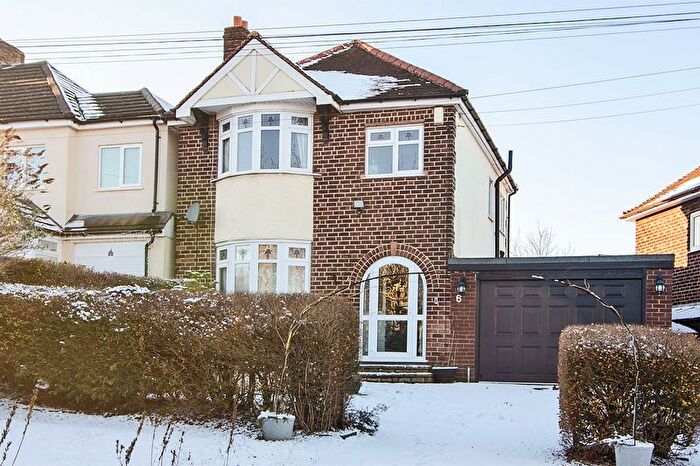
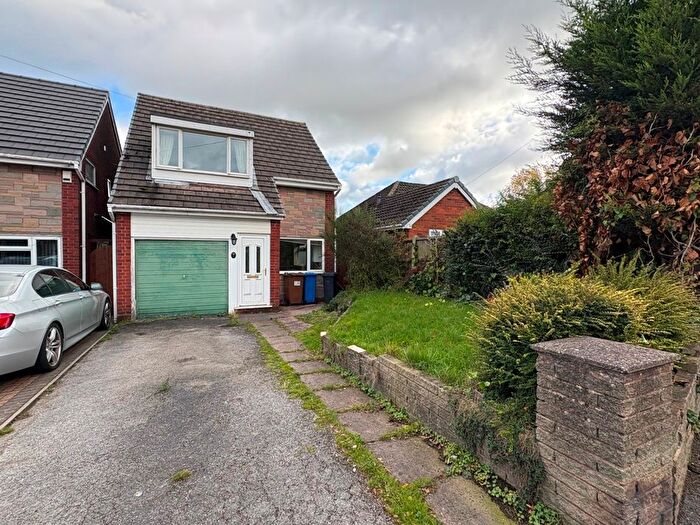
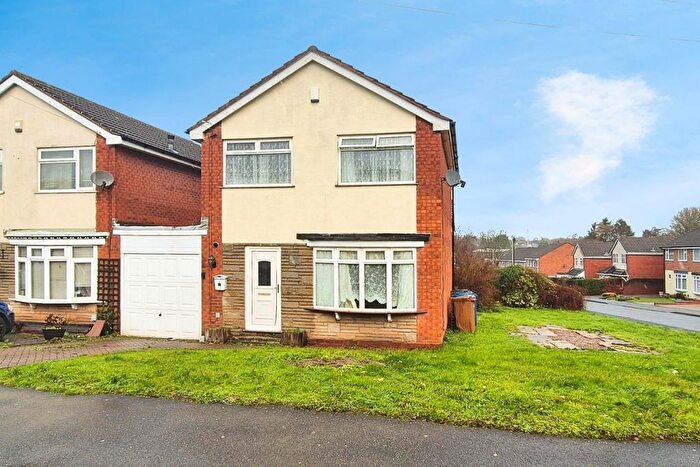
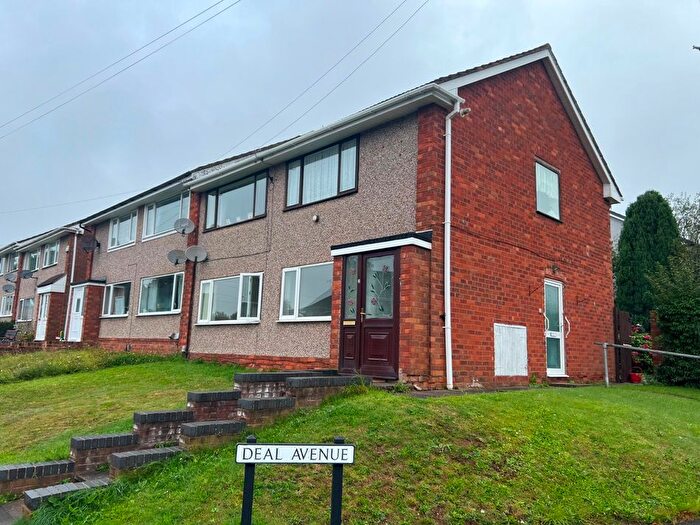
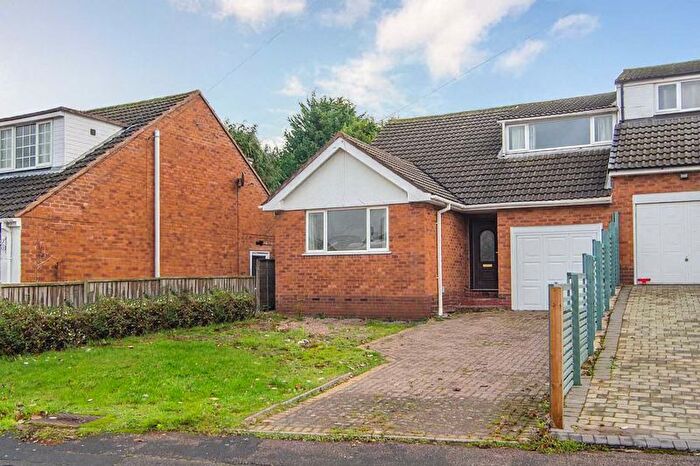
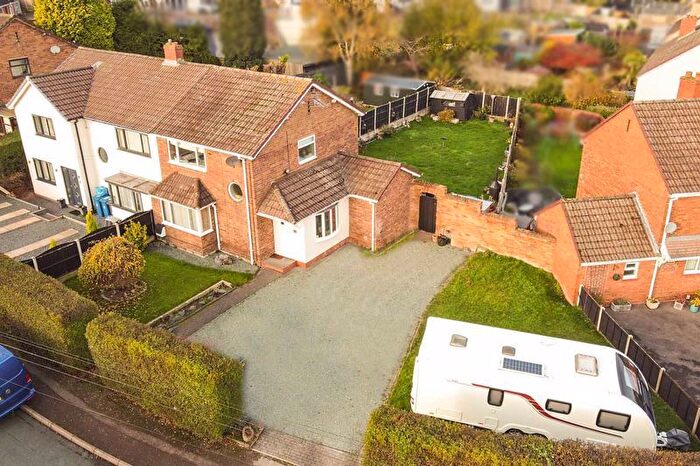
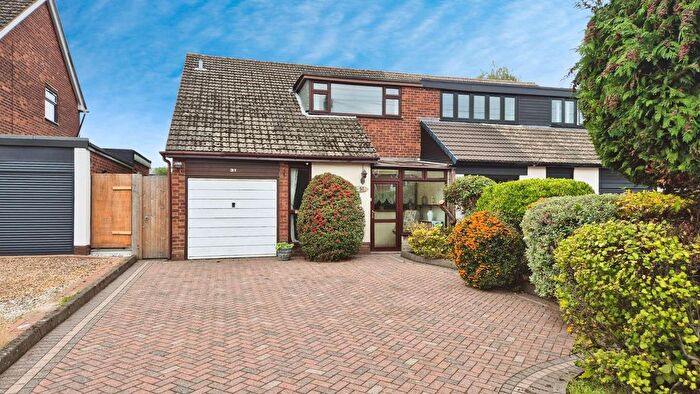
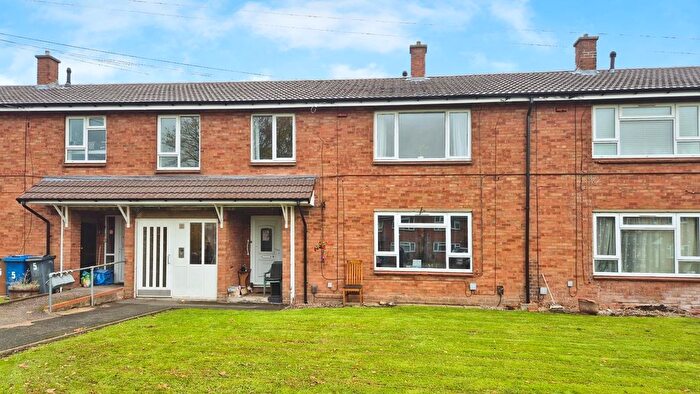
Properties for sale in Summerfield
Previously listed properties in Summerfield
Roads and Postcodes in Summerfield
Navigate through our locations to find the location of your next house in Summerfield, Burntwood for sale or to rent.
| Streets | Postcodes |
|---|---|
| Avon Road | WS7 4UD |
| Brantwood Avenue | WS7 4TY |
| Bridge Cross Road | WS7 2BZ |
| Cannock Road | WS7 0BB |
| Cedar Close | WS7 4RX |
| Cedar Road | WS7 4RT WS7 4RU |
| Chase Close | WS7 0FB |
| Chase Road | WS7 0DX WS7 0DY WS7 0DZ WS7 0EA WS7 0EB |
| Eastcote Crescent | WS7 4UB |
| Ferndale Close | WS7 4US |
| Foxhills Close | WS7 4TT |
| Franklin Drive | WS7 0DA |
| Glenmore Avenue | WS7 4UW |
| Grange Avenue | WS7 0BD |
| Grange Road | WS7 4TP WS7 4TU |
| Hawthorne Crescent | WS7 4RZ |
| Henley Close | WS7 0EL |
| Keepers Close | WS7 4UT |
| Leafenden Avenue | WS7 4UU |
| Loftus Court | WS7 4UE |
| Manor Rise | WS7 4TR WS7 4TS |
| Meadway Street | WS7 4TW |
| Moor Close | WS7 0DL |
| Mossbank Avenue | WS7 4UN |
| Mount Road | WS7 0AJ |
| New Road | WS7 0BT |
| Newgate Street | WS7 4TX WS7 4TZ WS7 4UF |
| Oakdene Road | WS7 4RS WS7 4RY WS7 4SA |
| Queen Street | WS7 4TJ WS7 4TN |
| Russett Close | WS7 4UX |
| Springhill Road | WS7 4UH WS7 4UJ WS7 4UL |
| Summerfield Road | WS7 4UA |
| Thistledown Avenue | WS7 4UR |
| Travellers Close | WS7 0LP |
| Woodland Way | WS7 4UP |
Transport near Summerfield
- FAQ
- Price Paid By Year
- Property Type Price
Frequently asked questions about Summerfield
What is the average price for a property for sale in Summerfield?
The average price for a property for sale in Summerfield is £207,972. This amount is 21% lower than the average price in Burntwood. There are 645 property listings for sale in Summerfield.
What streets have the most expensive properties for sale in Summerfield?
The streets with the most expensive properties for sale in Summerfield are Cannock Road at an average of £367,500, Springhill Road at an average of £278,000 and Bridge Cross Road at an average of £250,600.
What streets have the most affordable properties for sale in Summerfield?
The streets with the most affordable properties for sale in Summerfield are Cedar Close at an average of £119,000, Mount Road at an average of £134,000 and Keepers Close at an average of £137,600.
Which train stations are available in or near Summerfield?
Some of the train stations available in or near Summerfield are Lichfield City, Hednesford and Shenstone.
Property Price Paid in Summerfield by Year
The average sold property price by year was:
| Year | Average Sold Price | Price Change |
Sold Properties
|
|---|---|---|---|
| 2025 | £211,333 | 2% |
33 Properties |
| 2024 | £206,783 | 0,1% |
52 Properties |
| 2023 | £206,484 | 9% |
33 Properties |
| 2022 | £187,945 | 5% |
56 Properties |
| 2021 | £178,673 | 4% |
60 Properties |
| 2020 | £172,151 | 11% |
35 Properties |
| 2019 | £152,480 | 9% |
65 Properties |
| 2018 | £138,997 | -6% |
53 Properties |
| 2017 | £146,847 | 11% |
66 Properties |
| 2016 | £130,504 | -3% |
72 Properties |
| 2015 | £135,014 | 10% |
60 Properties |
| 2014 | £121,794 | 4% |
56 Properties |
| 2013 | £116,700 | 2% |
37 Properties |
| 2012 | £113,901 | 2% |
35 Properties |
| 2011 | £111,462 | -0,5% |
40 Properties |
| 2010 | £111,996 | -8% |
16 Properties |
| 2009 | £120,887 | -8% |
27 Properties |
| 2008 | £130,901 | 7% |
37 Properties |
| 2007 | £121,315 | -1% |
66 Properties |
| 2006 | £122,721 | 6% |
85 Properties |
| 2005 | £115,829 | 15% |
57 Properties |
| 2004 | £98,411 | 11% |
72 Properties |
| 2003 | £87,165 | 20% |
64 Properties |
| 2002 | £69,912 | 17% |
83 Properties |
| 2001 | £57,940 | 14% |
81 Properties |
| 2000 | £50,059 | 1% |
77 Properties |
| 1999 | £49,316 | 11% |
69 Properties |
| 1998 | £43,908 | -4% |
72 Properties |
| 1997 | £45,721 | 8% |
73 Properties |
| 1996 | £41,970 | -9% |
59 Properties |
| 1995 | £45,718 | - |
55 Properties |
Property Price per Property Type in Summerfield
Here you can find historic sold price data in order to help with your property search.
The average Property Paid Price for specific property types in the last three years are:
| Property Type | Average Sold Price | Sold Properties |
|---|---|---|
| Semi Detached House | £221,846.00 | 39 Semi Detached Houses |
| Detached House | £320,357.00 | 14 Detached Houses |
| Terraced House | £179,420.00 | 60 Terraced Houses |
| Flat | £127,700.00 | 5 Flats |

