Houses for sale & to rent in Burntwood, Staffordshire
House Prices in Burntwood
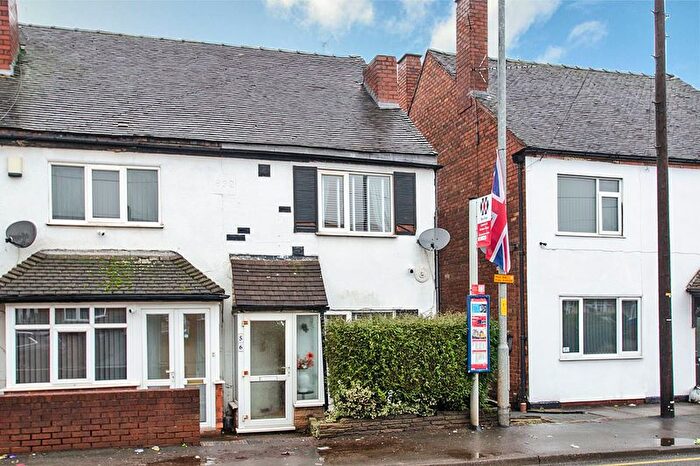
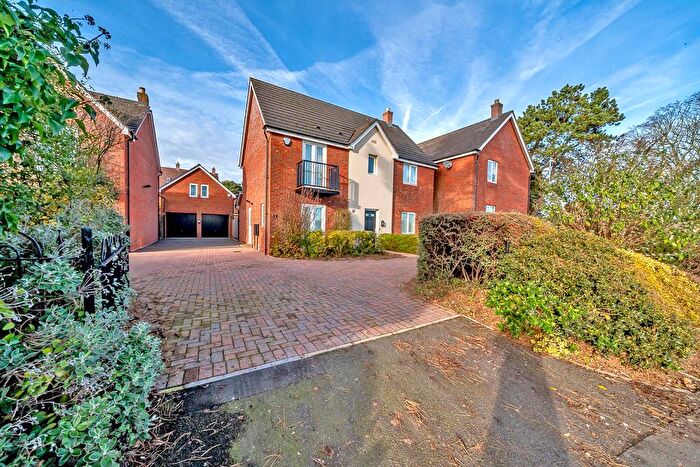
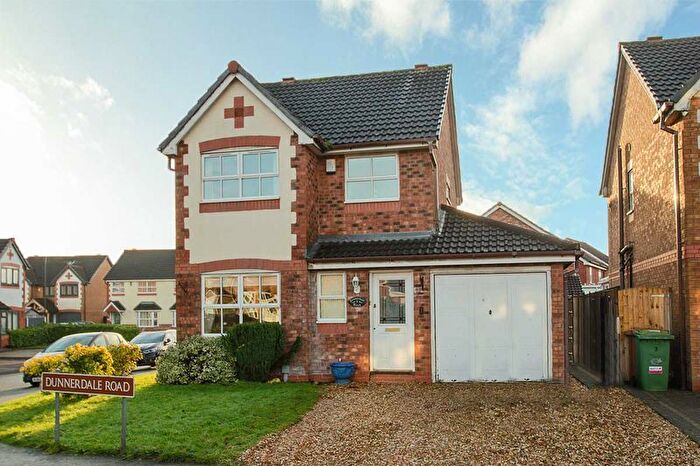
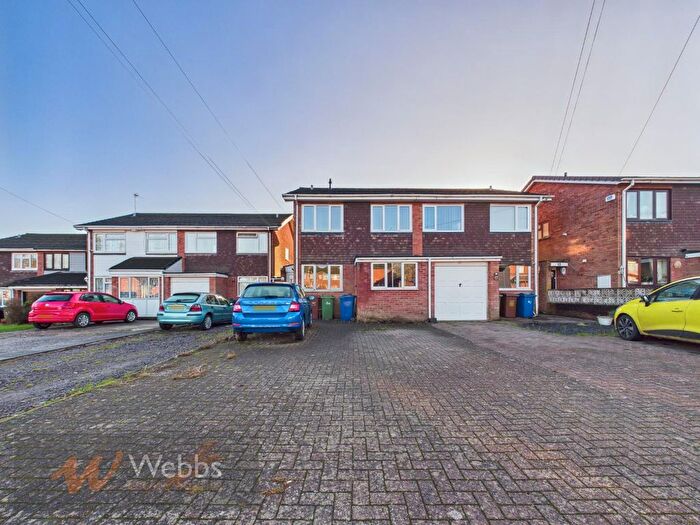
Properties in Burntwood have an average house price of £264,579.00 and had 1,049 Property Transactions within the last 3 years.¹
Burntwood is an area in Staffordshire with 12,200 households², where the most expensive property was sold for £1,000,000.00.
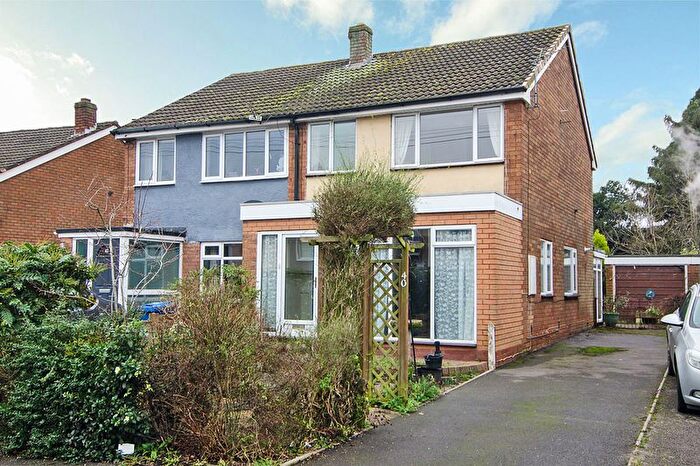
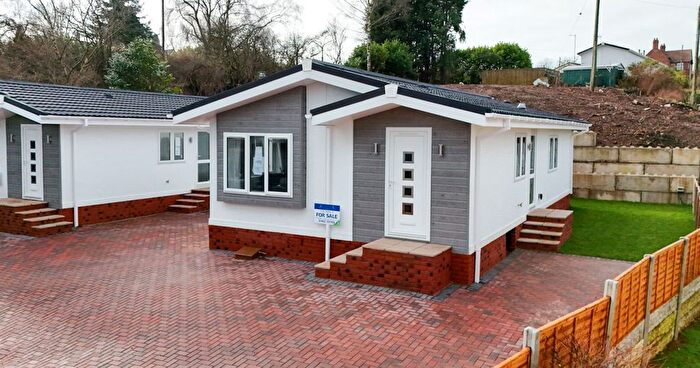
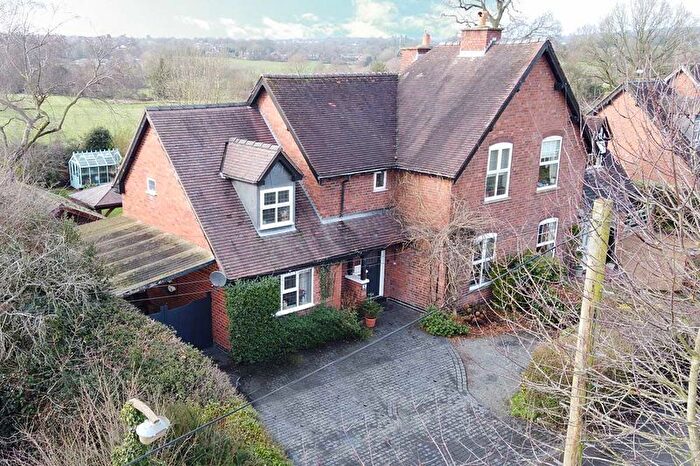
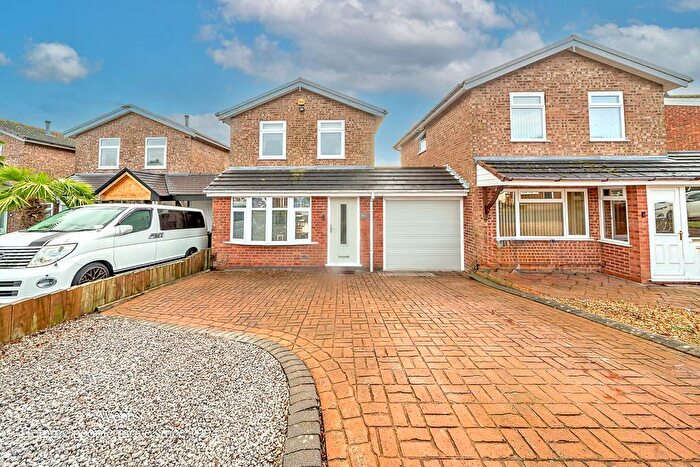
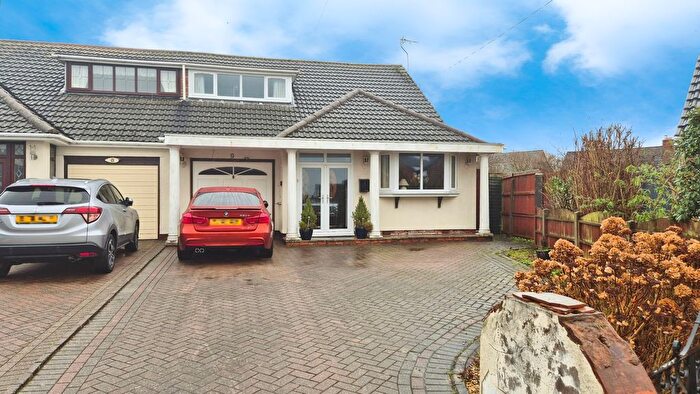
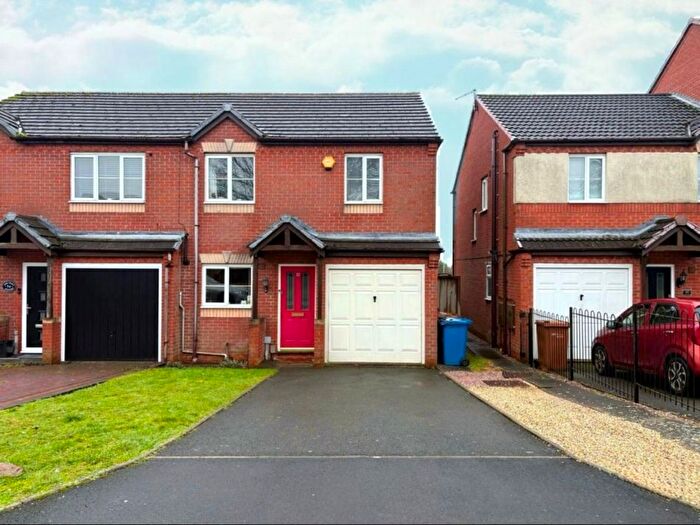
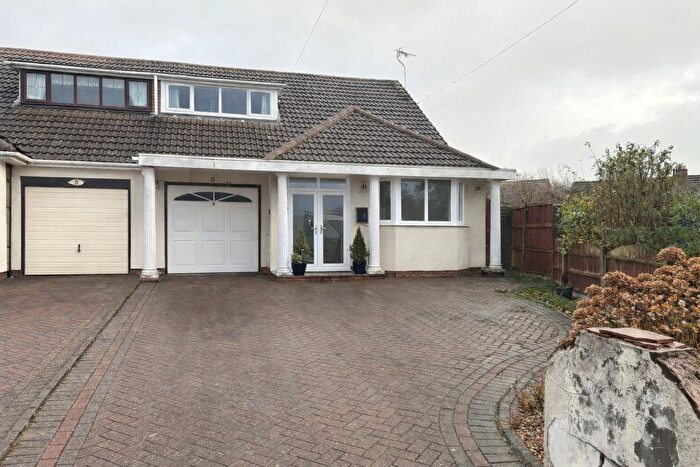
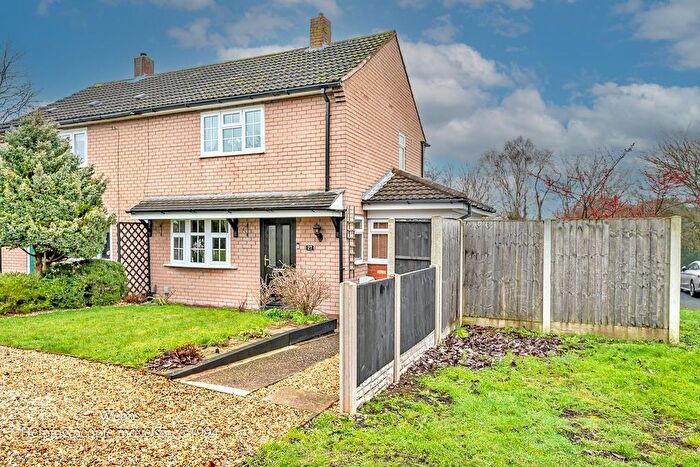
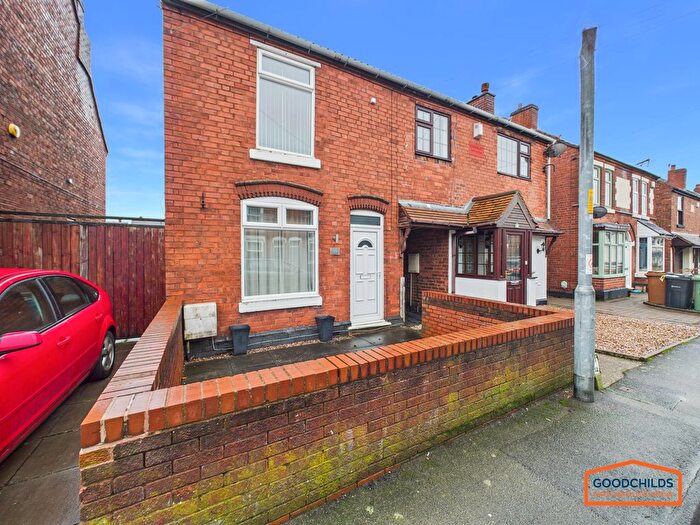
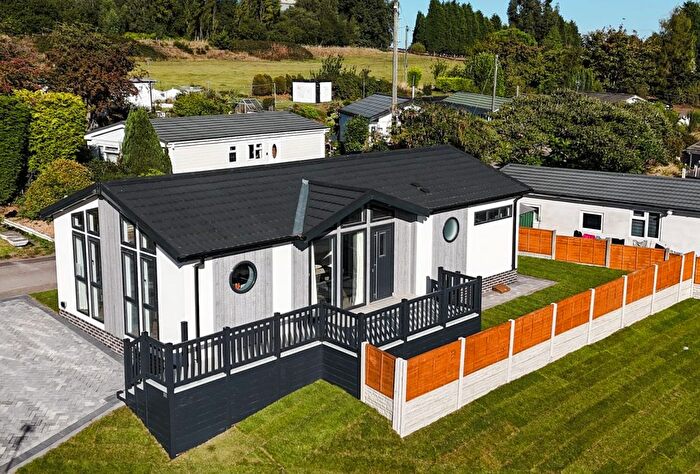
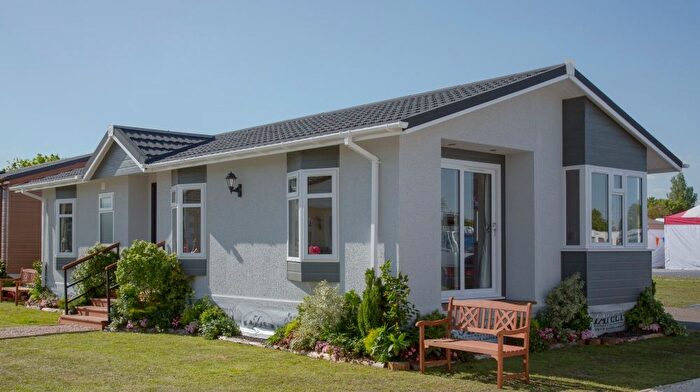
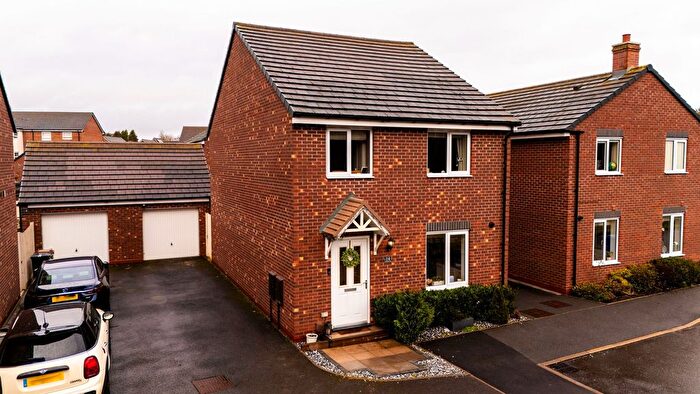
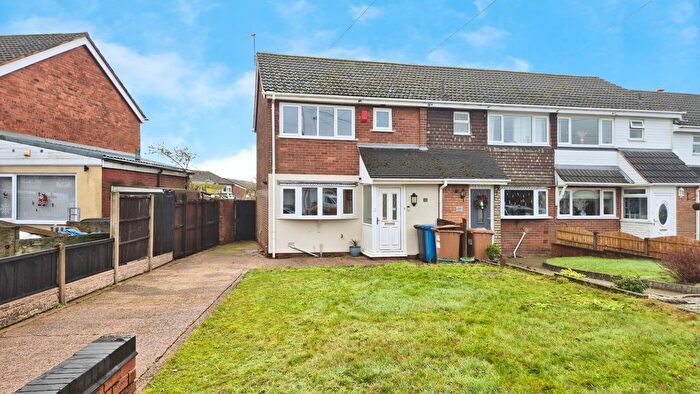
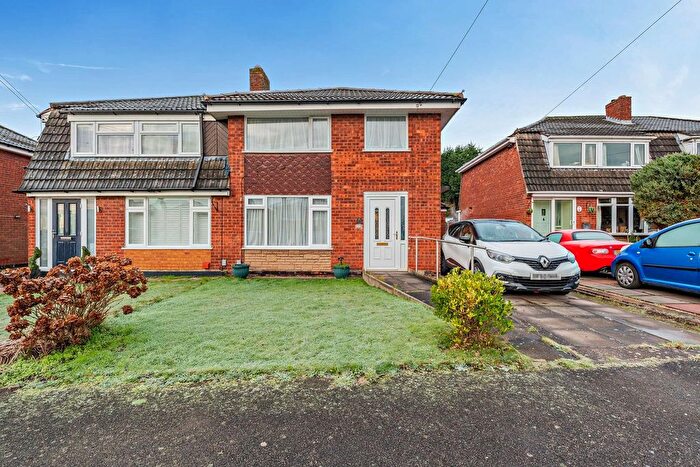
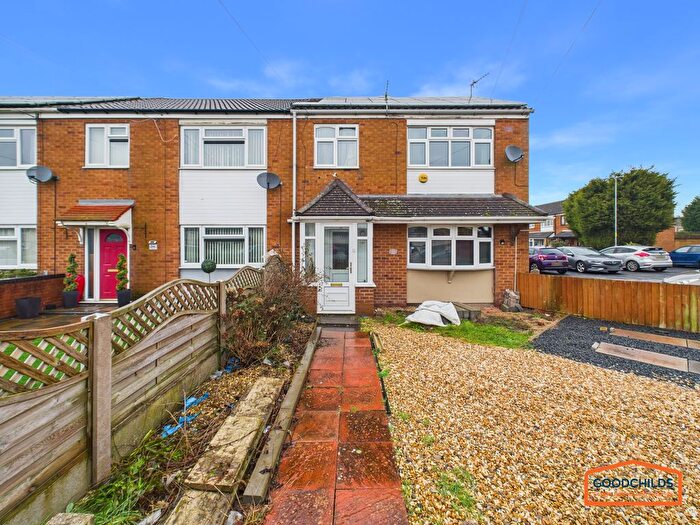
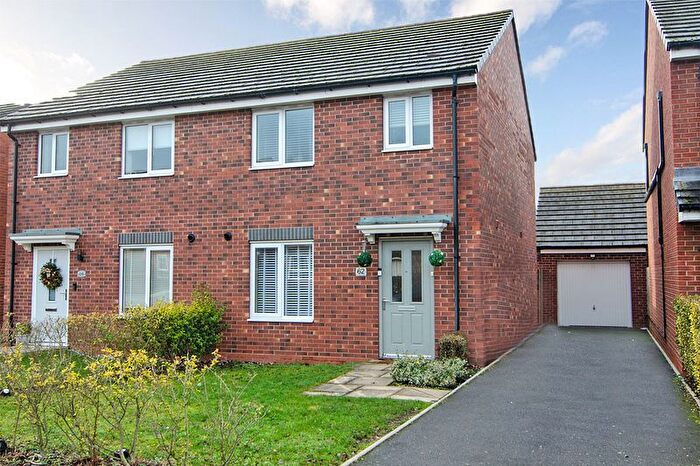
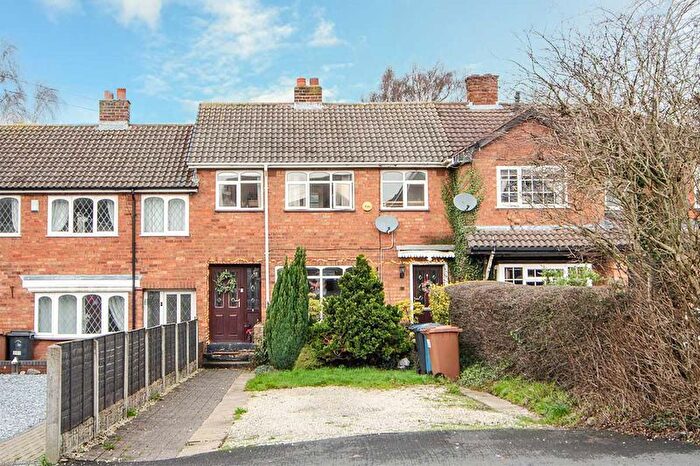
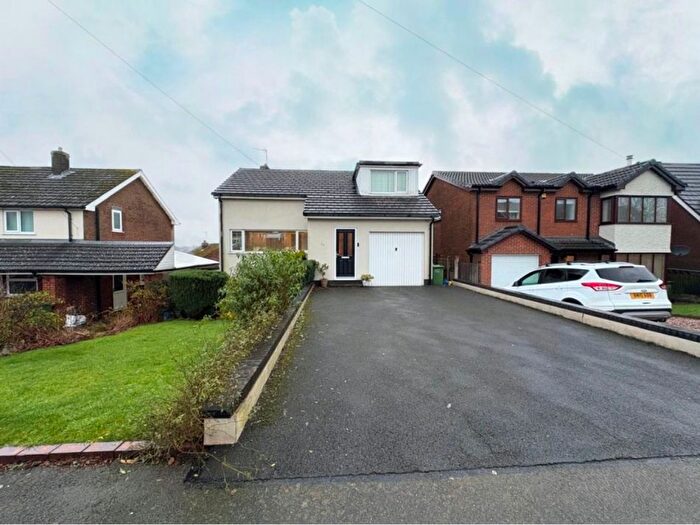
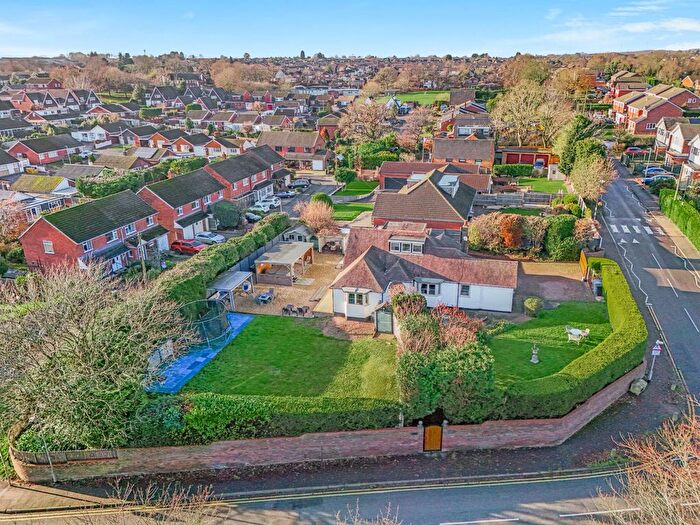
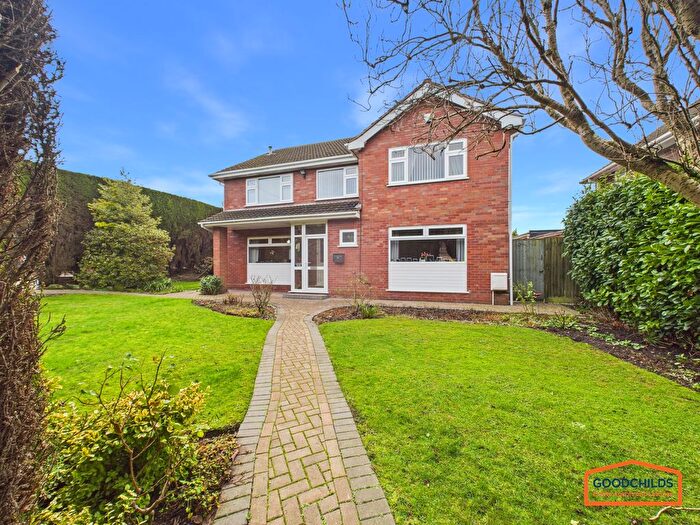
Properties for sale in Burntwood
Neighbourhoods in Burntwood
Navigate through our locations to find the location of your next house in Burntwood, Staffordshire for sale or to rent.
Transport in Burntwood
Please see below transportation links in this area:
- FAQ
- Price Paid By Year
- Property Type Price
Frequently asked questions about Burntwood
What is the average price for a property for sale in Burntwood?
The average price for a property for sale in Burntwood is £264,579. This amount is 0.99% higher than the average price in Staffordshire. There are 1,980 property listings for sale in Burntwood.
What locations have the most expensive properties for sale in Burntwood?
The locations with the most expensive properties for sale in Burntwood are Highfield at an average of £365,441, Hammerwich at an average of £338,403 and Boney Hay & Central at an average of £280,000.
What locations have the most affordable properties for sale in Burntwood?
The locations with the most affordable properties for sale in Burntwood are Summerfield at an average of £207,972, Chasetown at an average of £219,931 and Boney Hay at an average of £244,206.
Which train stations are available in or near Burntwood?
Some of the train stations available in or near Burntwood are Hednesford, Lichfield City and Cannock.
Property Price Paid in Burntwood by Year
The average sold property price by year was:
| Year | Average Sold Price | Price Change |
Sold Properties
|
|---|---|---|---|
| 2025 | £268,813 | 2% |
306 Properties |
| 2024 | £263,013 | 0,1% |
389 Properties |
| 2023 | £262,638 | 0,1% |
354 Properties |
| 2022 | £262,457 | 6% |
493 Properties |
| 2021 | £247,435 | 5% |
595 Properties |
| 2020 | £234,134 | 11% |
391 Properties |
| 2019 | £209,057 | 4% |
434 Properties |
| 2018 | £201,252 | -2% |
571 Properties |
| 2017 | £204,522 | 8% |
564 Properties |
| 2016 | £188,338 | 2% |
557 Properties |
| 2015 | £184,656 | 6% |
466 Properties |
| 2014 | £173,621 | 10% |
456 Properties |
| 2013 | £155,995 | -3% |
361 Properties |
| 2012 | £160,080 | 4% |
256 Properties |
| 2011 | £154,373 | -6% |
277 Properties |
| 2010 | £164,077 | 3% |
256 Properties |
| 2009 | £158,335 | -4% |
240 Properties |
| 2008 | £165,271 | -2% |
261 Properties |
| 2007 | £169,068 | 8% |
520 Properties |
| 2006 | £155,118 | -2% |
577 Properties |
| 2005 | £158,436 | 4% |
468 Properties |
| 2004 | £151,805 | 11% |
564 Properties |
| 2003 | £135,470 | 22% |
587 Properties |
| 2002 | £105,027 | 13% |
647 Properties |
| 2001 | £91,632 | 15% |
545 Properties |
| 2000 | £77,577 | 13% |
590 Properties |
| 1999 | £67,653 | 7% |
518 Properties |
| 1998 | £62,671 | 1% |
414 Properties |
| 1997 | £62,044 | 4% |
478 Properties |
| 1996 | £59,837 | 4% |
455 Properties |
| 1995 | £57,237 | - |
478 Properties |
Property Price per Property Type in Burntwood
Here you can find historic sold price data in order to help with your property search.
The average Property Paid Price for specific property types in the last three years are:
| Property Type | Average Sold Price | Sold Properties |
|---|---|---|
| Semi Detached House | £246,676.00 | 445 Semi Detached Houses |
| Detached House | £364,696.00 | 300 Detached Houses |
| Terraced House | £209,696.00 | 235 Terraced Houses |
| Flat | £131,665.00 | 69 Flats |

