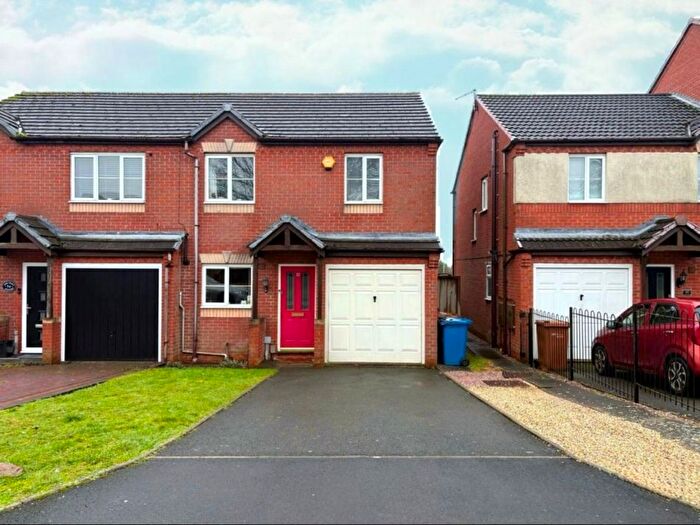
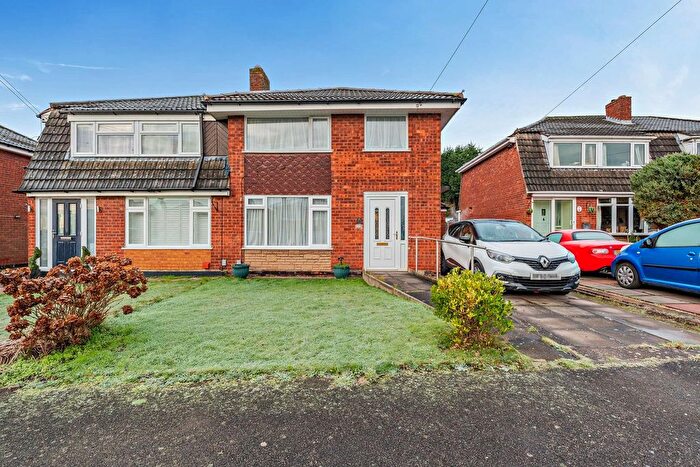
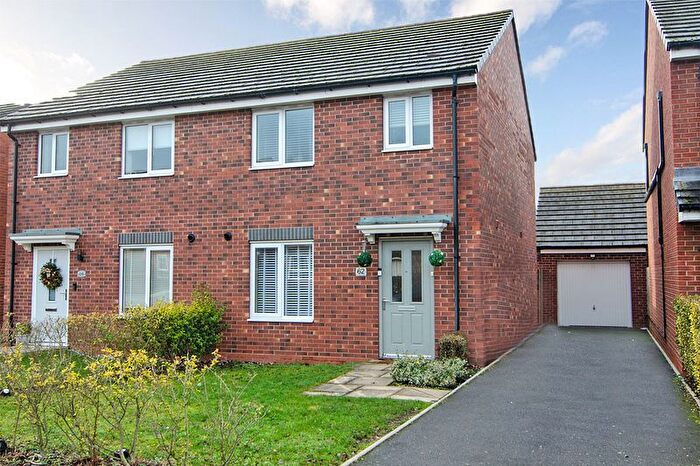
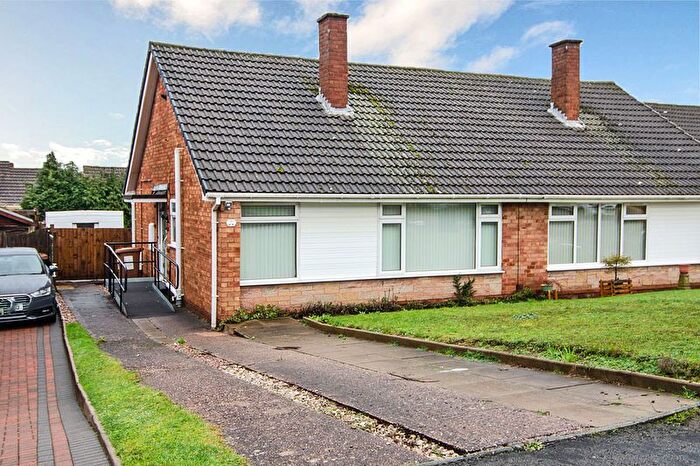
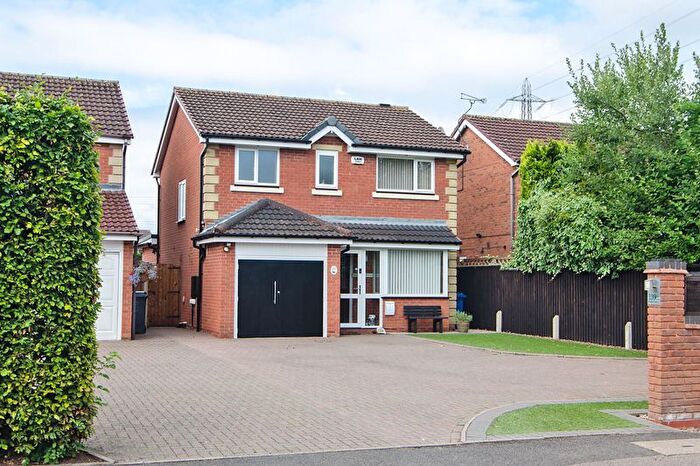
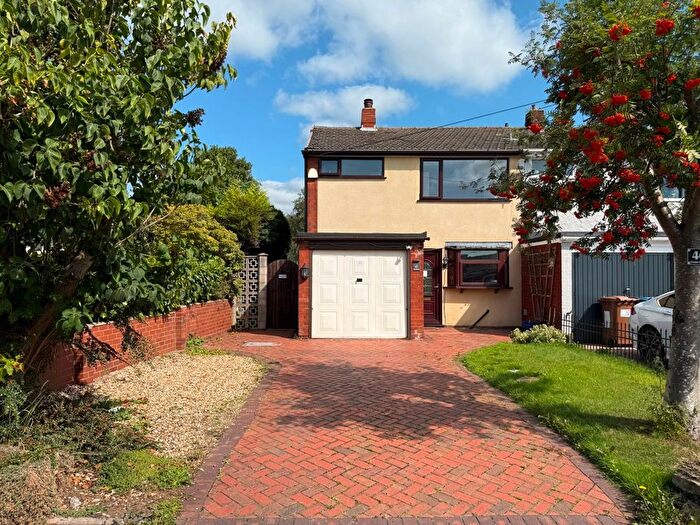
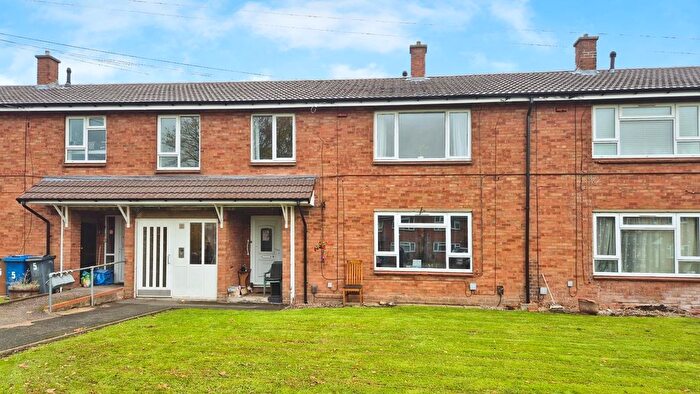
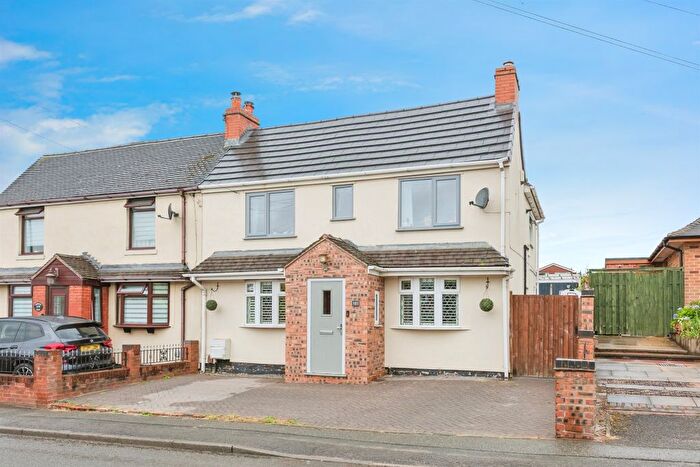
Houses for sale & to rent in Chase Terrace, Burntwood
House Prices in Chase Terrace
Properties in Chase Terrace have an average house price of £252,389.00 and had 177 Property Transactions within the last 3 years¹.
Chase Terrace is an area in Burntwood, Staffordshire with 2,109 households², where the most expensive property was sold for £495,000.00.
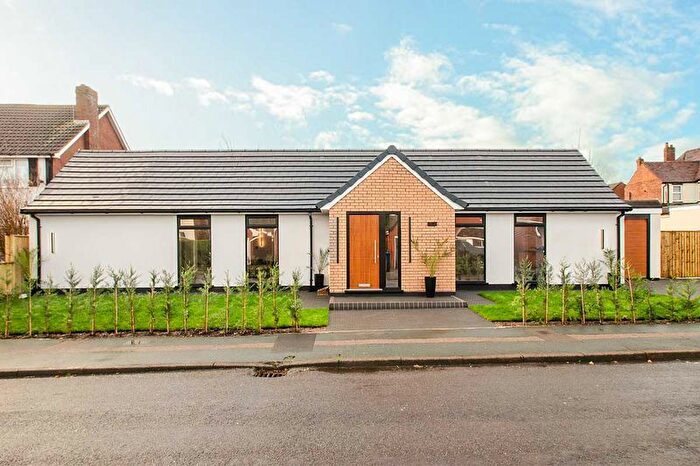
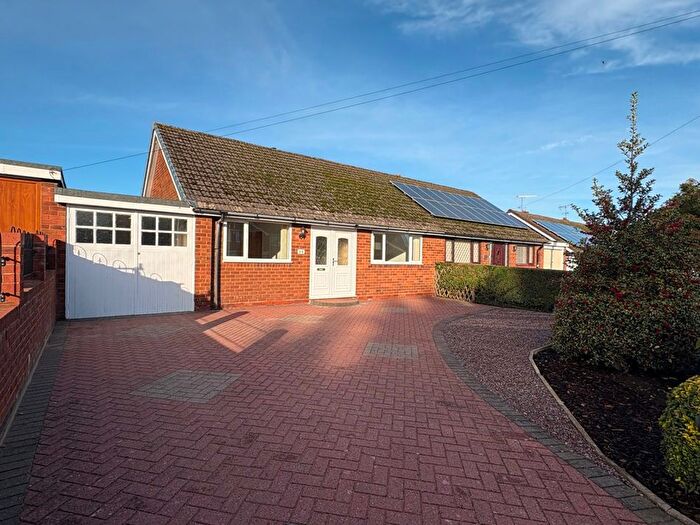
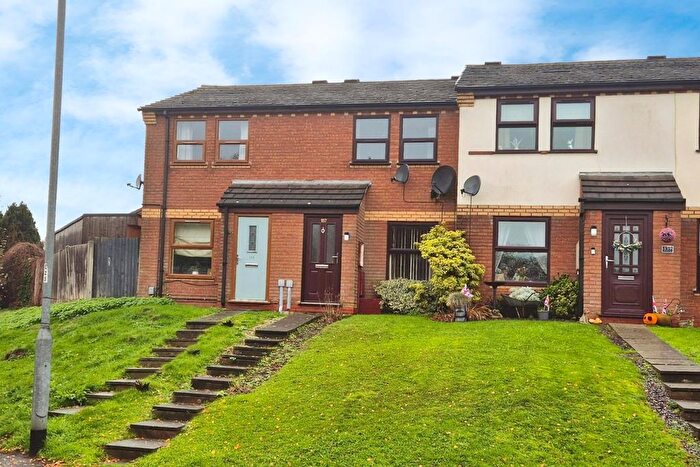
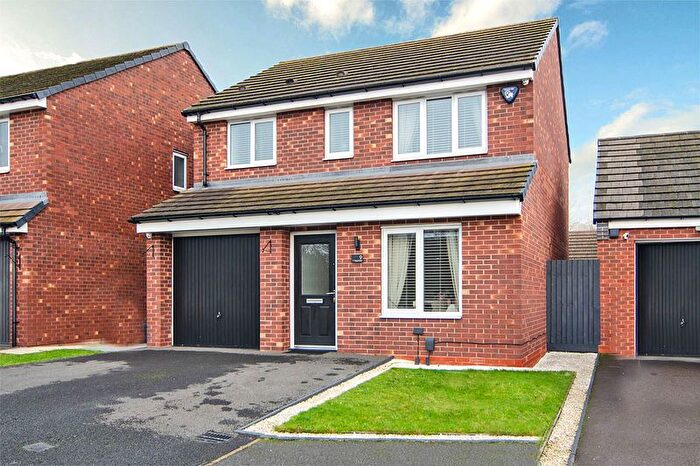
Properties for sale in Chase Terrace
Previously listed properties in Chase Terrace
Roads and Postcodes in Chase Terrace
Navigate through our locations to find the location of your next house in Chase Terrace, Burntwood for sale or to rent.
| Streets | Postcodes |
|---|---|
| Angel Croft | WS7 1GN |
| Ashley Road | WS7 1LJ |
| Balmoral Way | WS7 1PP |
| Baron Close | WS7 1LH |
| Biddulph Park | WS7 1LG WS7 1LQ |
| Bleak House Drive | WS7 1ZX |
| Burntwood Town Shopping Centre | WS7 1JR |
| Calvary Close | WS7 1NN |
| Cannock Road | WS7 1JP WS7 1JT WS7 1JU WS7 1JZ WS7 1LA |
| Chapel Street | WS7 1NL WS7 1ND |
| Chaselands | WS7 3UZ |
| Chawner Close | WS7 1YX |
| Cobbett Road | WS7 3GL WS7 3GR |
| Coulson Close | WS7 1ZY |
| Cross Street | WS7 1AP |
| Duke Road | WS7 1PY |
| Earl Drive | WS7 1PT |
| Eastgate Street | WS7 1JJ |
| Eights Croft | WS7 1FG |
| Fair Lady Drive | WS7 1ZZ |
| Fives Grove | WS7 1FN |
| Griffin Close | WS7 1JG |
| Gullick Way | WS7 1FH |
| High Street | WS7 1LP WS7 1LR WS7 1LX |
| Hill Lane | WS7 1LS |
| Hilton Road | WS7 1FQ |
| Holly Grove Lane | WS7 1LU WS7 1QA |
| Ironstone Road | WS7 1LF WS7 1LL WS7 1LN WS7 1LY WS7 1LZ WS7 1NB WS7 1YN WS7 1YL |
| Kingsdown Road | WS7 1PN WS7 1PZ |
| Knight Road | WS7 1PX |
| Lance Drive | WS7 1FA |
| Lea Hall Drive | WS7 1ZS |
| Leander Close | WS7 1PW |
| Littleton Way | WS7 1ZT |
| Lodge Rise | WS7 1NY |
| Lorne Street | WS7 1NA |
| Mavor Avenue | WS7 1ZU |
| Melford Rise | WS7 1YW |
| Mowbray Croft | WS7 1QB |
| New Plant Lane | WS7 1JQ |
| New Street | WS7 1BS WS7 1BT |
| Paget Drive | WS7 1HP |
| Paget Mews | WS7 1AD |
| Park Croft | WS7 1FF |
| Park Road | WS7 1AE |
| Plant Lane Business Park | WS7 3GN |
| Princess Close | WS7 1BP |
| Princess Street | WS7 1JH WS7 1JN WS7 1JW |
| Radmore Close | WS7 1JX |
| Railway Lane | WS7 1LT |
| Rugeley Road | WS7 1AB WS7 1AG |
| Sandringham Close | WS7 1PR |
| School Close | WS7 1NH |
| School Lane | WS7 1LB WS7 1LD WS7 1LE |
| School Walk | WS7 1NQ |
| Silverdale Drive | WS7 3UY |
| Spencer Drive | WS7 1AF |
| St Johns Close | WS7 1QD |
| The Grove | WS7 1ZW |
| The Valley | WS7 1ZR |
| Thorpe Avenue | WS7 1NF |
| Thorpe Close | WS7 1NG |
| Thorpe Street | WS7 1NE WS7 1NJ |
| Two Oaks Avenue | WS7 1FP |
| Viscount Road | WS7 1PU |
| Water Street | WS7 1AN WS7 1AW |
| Wembley Lane | WS7 1FL |
| Windsor Close | WS7 1PS |
Transport near Chase Terrace
- FAQ
- Price Paid By Year
- Property Type Price
Frequently asked questions about Chase Terrace
What is the average price for a property for sale in Chase Terrace?
The average price for a property for sale in Chase Terrace is £252,389. This amount is 5% lower than the average price in Burntwood. There are 483 property listings for sale in Chase Terrace.
What streets have the most expensive properties for sale in Chase Terrace?
The streets with the most expensive properties for sale in Chase Terrace are Fair Lady Drive at an average of £404,400, Hilton Road at an average of £345,000 and Angel Croft at an average of £340,375.
What streets have the most affordable properties for sale in Chase Terrace?
The streets with the most affordable properties for sale in Chase Terrace are Eastgate Street at an average of £125,000, Rugeley Road at an average of £157,571 and New Plant Lane at an average of £160,416.
Which train stations are available in or near Chase Terrace?
Some of the train stations available in or near Chase Terrace are Hednesford, Cannock and Landywood.
Property Price Paid in Chase Terrace by Year
The average sold property price by year was:
| Year | Average Sold Price | Price Change |
Sold Properties
|
|---|---|---|---|
| 2025 | £271,815 | 11% |
54 Properties |
| 2024 | £241,861 | -2% |
72 Properties |
| 2023 | £246,685 | -0,1% |
51 Properties |
| 2022 | £246,880 | 11% |
96 Properties |
| 2021 | £220,853 | 5% |
107 Properties |
| 2020 | £210,135 | 6% |
72 Properties |
| 2019 | £197,891 | 6% |
81 Properties |
| 2018 | £185,130 | 5% |
92 Properties |
| 2017 | £176,341 | 3% |
73 Properties |
| 2016 | £171,765 | 9% |
93 Properties |
| 2015 | £156,766 | -3% |
83 Properties |
| 2014 | £161,081 | 12% |
91 Properties |
| 2013 | £142,167 | -5% |
72 Properties |
| 2012 | £148,792 | 7% |
54 Properties |
| 2011 | £138,092 | -15% |
50 Properties |
| 2010 | £158,168 | 7% |
44 Properties |
| 2009 | £146,884 | -2% |
44 Properties |
| 2008 | £149,287 | 0,1% |
43 Properties |
| 2007 | £149,170 | -2% |
93 Properties |
| 2006 | £151,791 | 9% |
126 Properties |
| 2005 | £138,689 | 10% |
108 Properties |
| 2004 | £125,256 | 6% |
143 Properties |
| 2003 | £117,774 | 24% |
125 Properties |
| 2002 | £89,481 | 6% |
120 Properties |
| 2001 | £84,226 | 10% |
114 Properties |
| 2000 | £75,476 | 5% |
160 Properties |
| 1999 | £71,818 | 18% |
153 Properties |
| 1998 | £58,766 | 7% |
87 Properties |
| 1997 | £54,418 | 2% |
98 Properties |
| 1996 | £53,105 | -15% |
93 Properties |
| 1995 | £61,027 | - |
146 Properties |
Property Price per Property Type in Chase Terrace
Here you can find historic sold price data in order to help with your property search.
The average Property Paid Price for specific property types in the last three years are:
| Property Type | Average Sold Price | Sold Properties |
|---|---|---|
| Semi Detached House | £226,444.00 | 77 Semi Detached Houses |
| Detached House | £312,533.00 | 67 Detached Houses |
| Terraced House | £192,720.00 | 32 Terraced Houses |
| Flat | £130,000.00 | 1 Flat |

