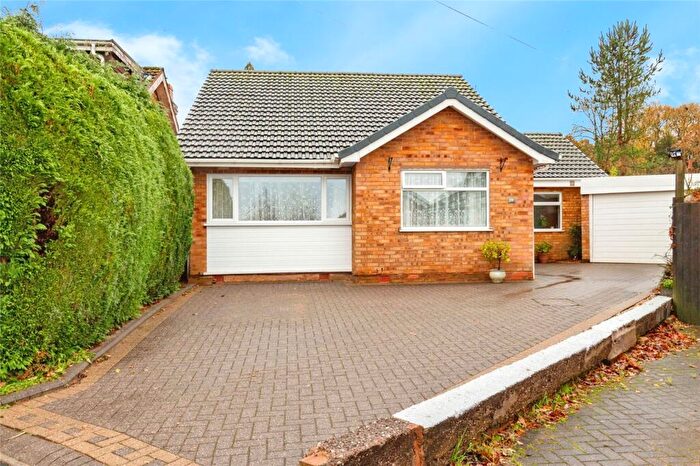
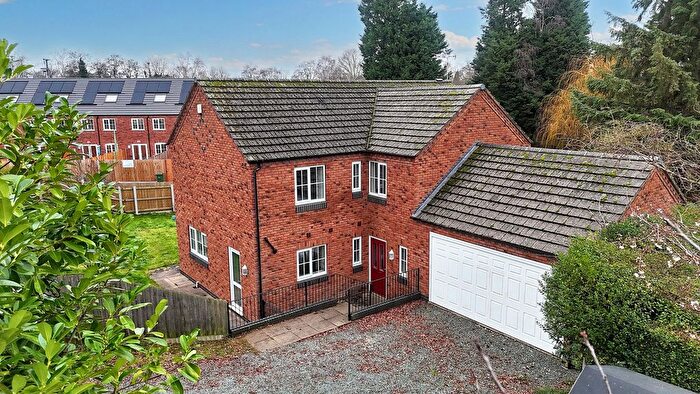
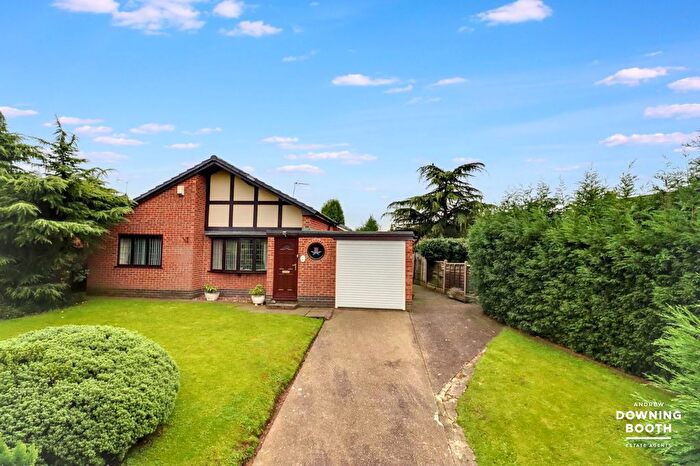
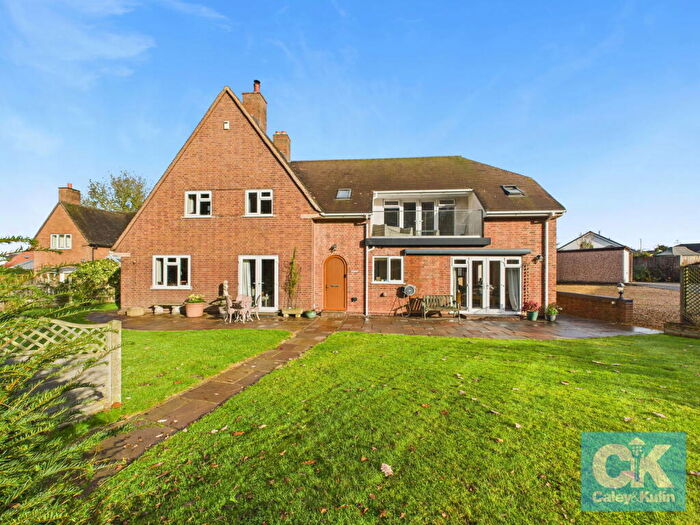
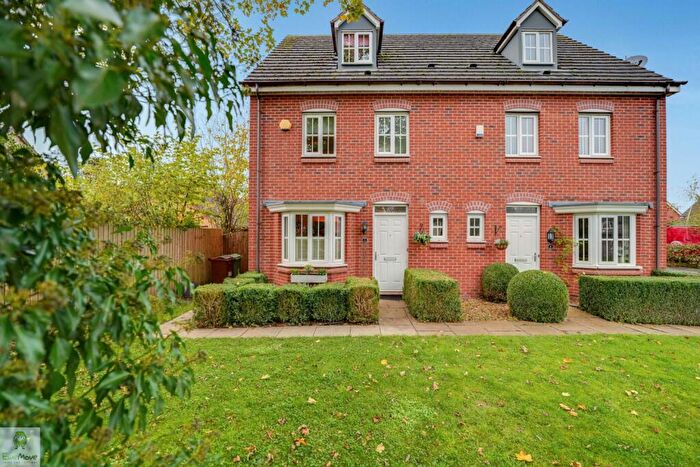
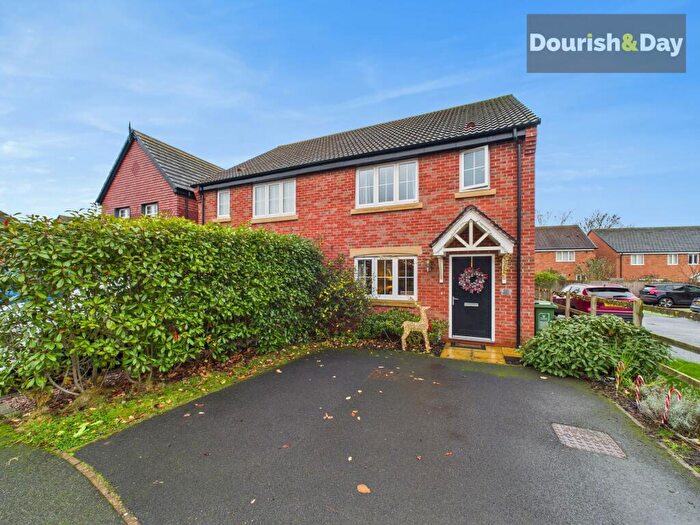
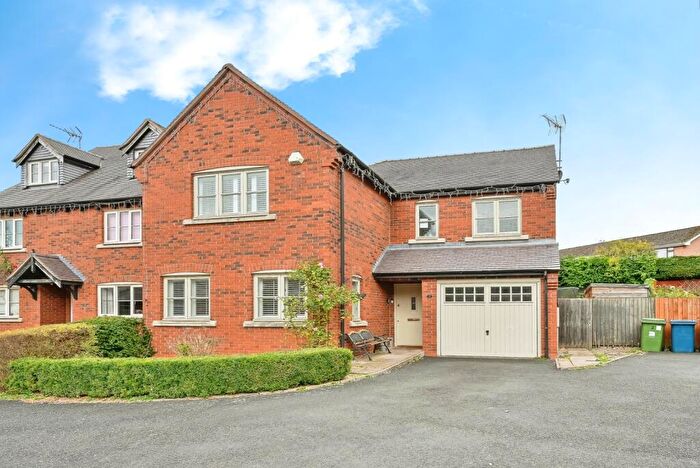
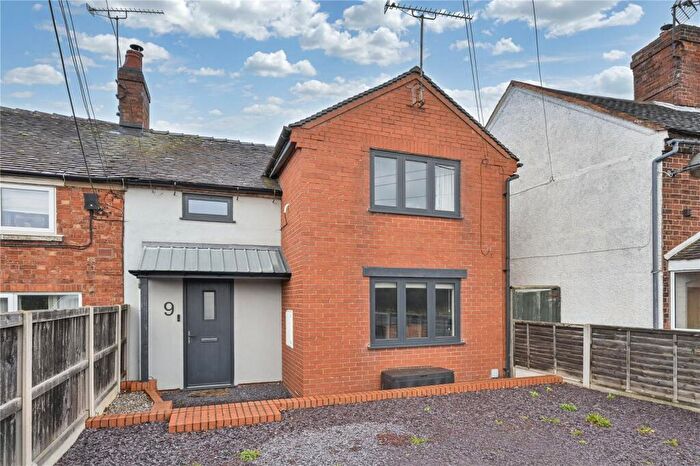
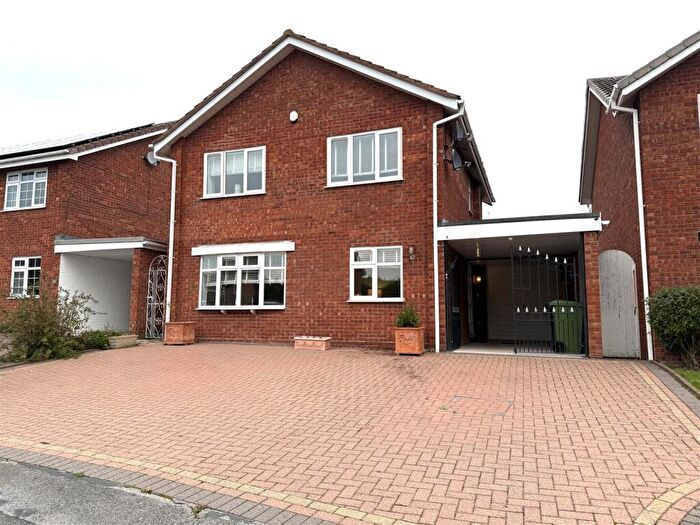
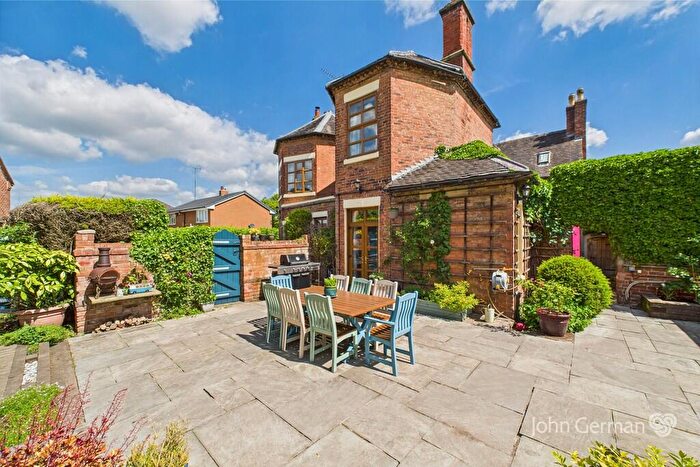
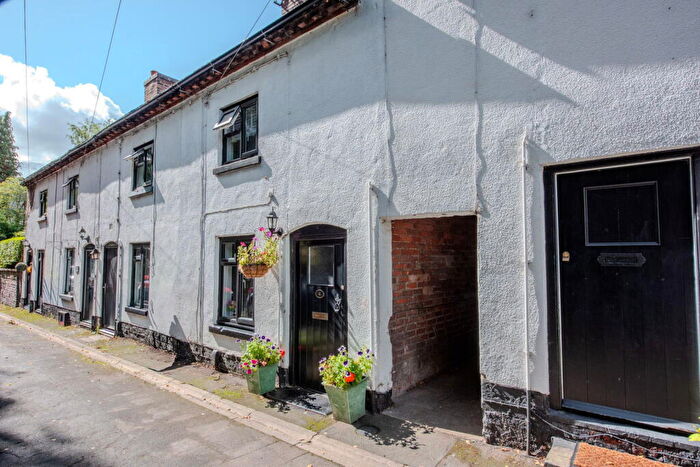
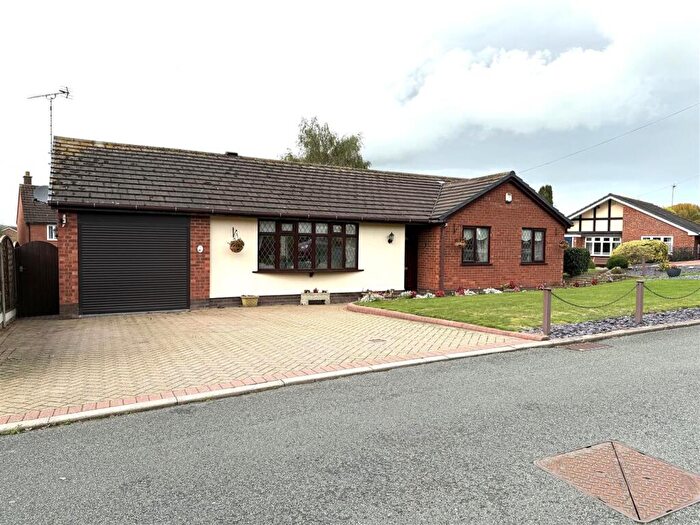
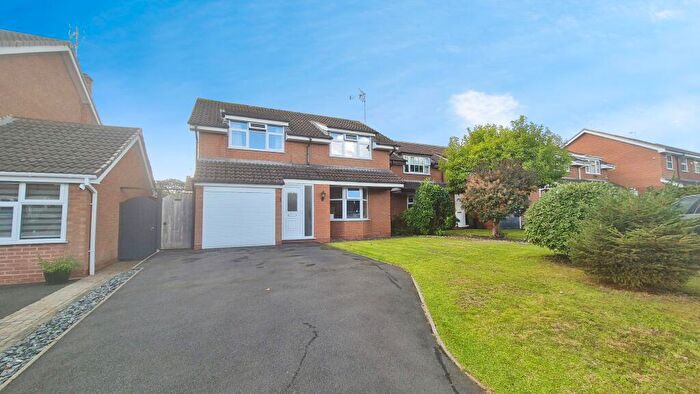
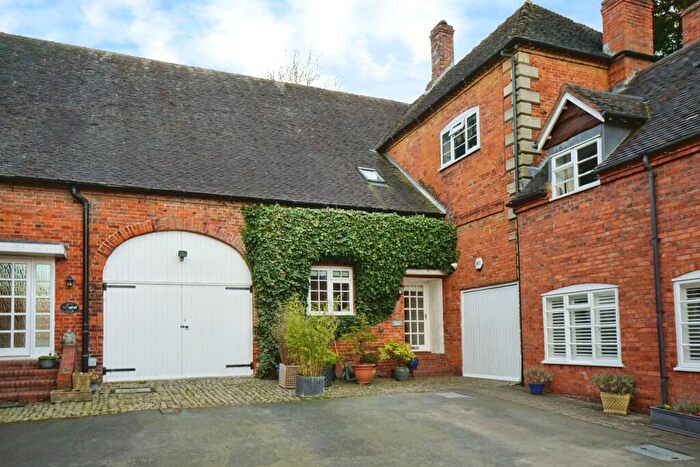
Houses for sale & to rent in Haywood And Hixon, Stafford
House Prices in Haywood And Hixon
Properties in Haywood And Hixon have an average house price of £302,912.00 and had 304 Property Transactions within the last 3 years¹.
Haywood And Hixon is an area in Stafford, Staffordshire with 2,647 households², where the most expensive property was sold for £1,750,000.00.
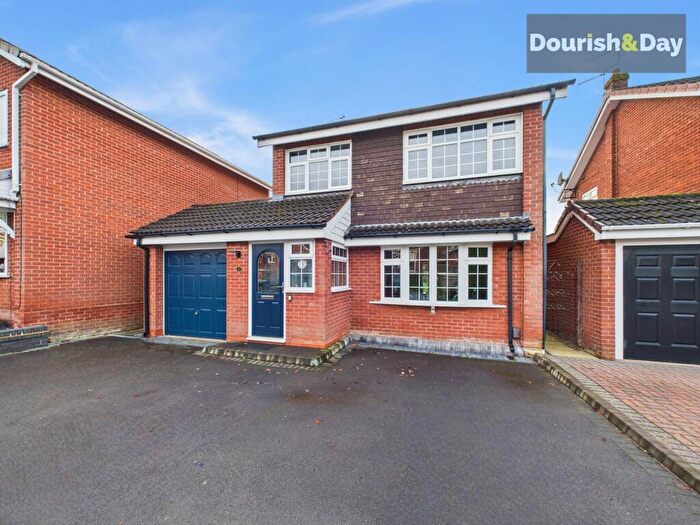
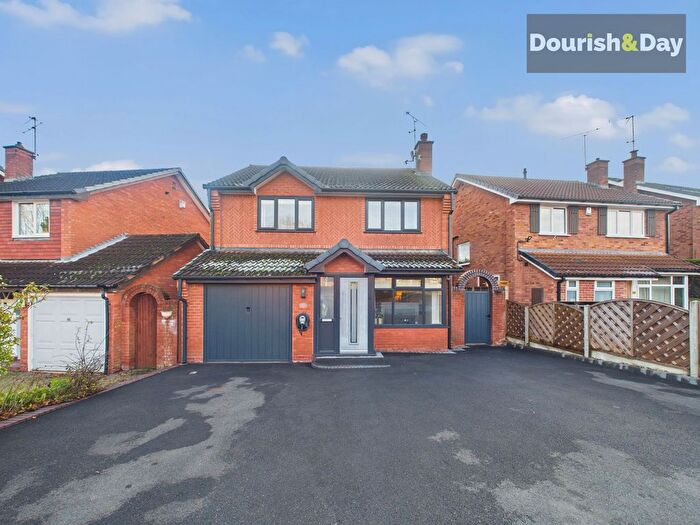
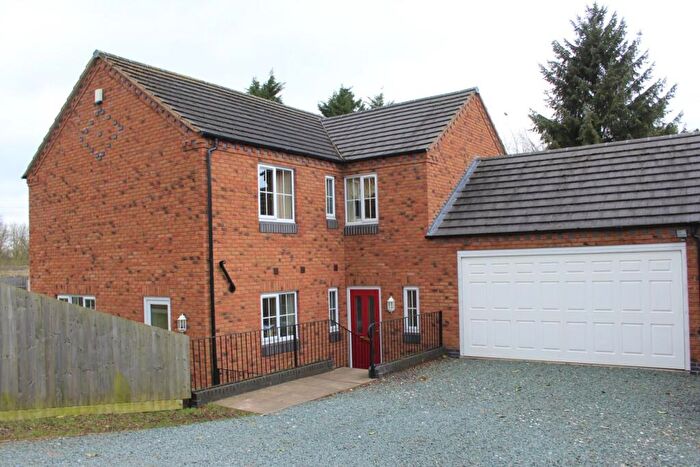
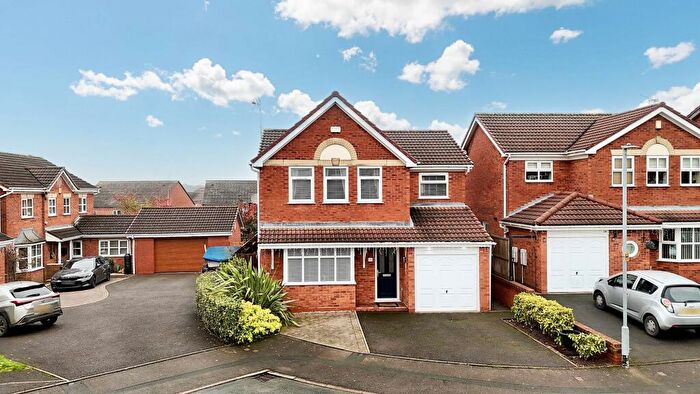
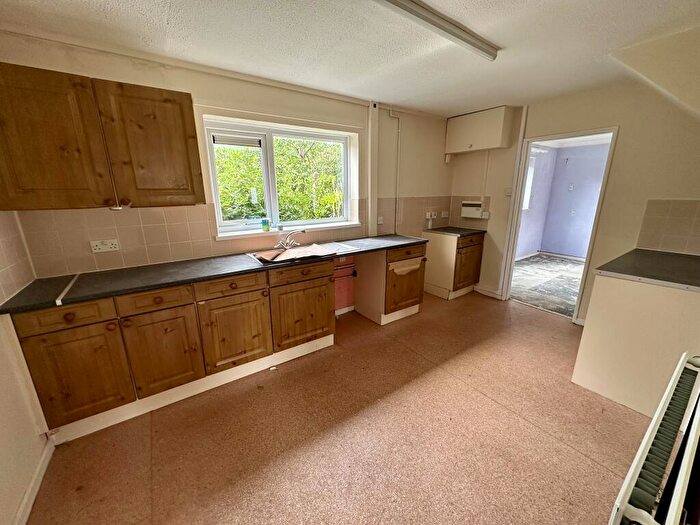
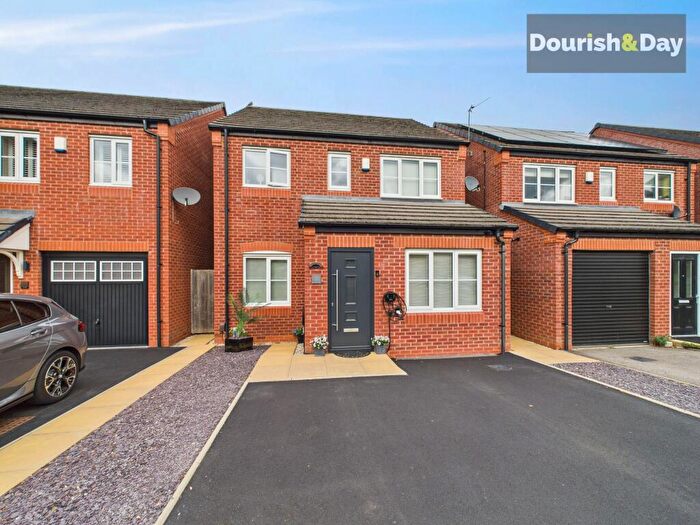
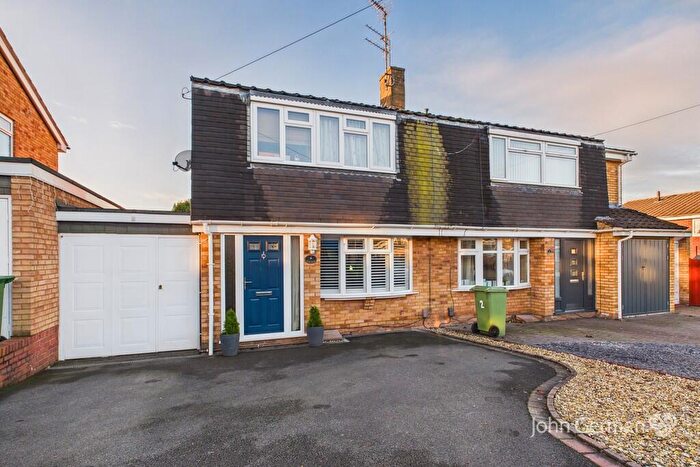
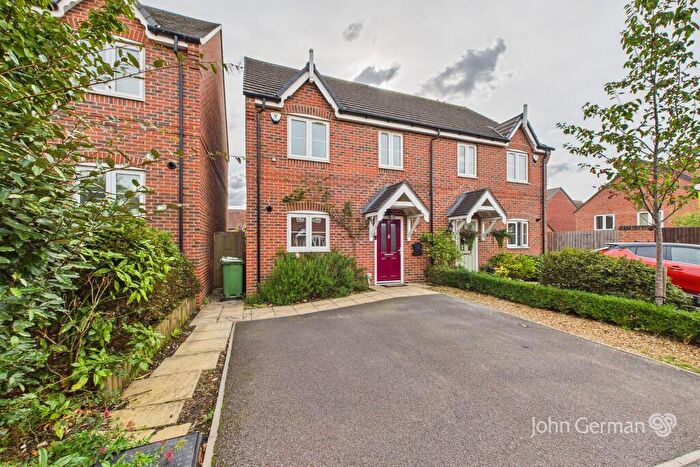
Properties for sale in Haywood And Hixon
Roads and Postcodes in Haywood And Hixon
Navigate through our locations to find the location of your next house in Haywood And Hixon, Stafford for sale or to rent.
| Streets | Postcodes |
|---|---|
| Abbey Drive | ST18 0QQ |
| Abbey Gardens | ST18 0RY |
| Abbeyfields | ST18 0SD |
| Anson Row | ST18 0UN |
| Ashlands | ST18 0NQ |
| Ashtree Close | ST18 0NL |
| Aston Close | ST18 0YN |
| Back Lane | ST18 0ND ST18 0UL |
| Barons Way | ST18 0QP |
| Bath Lane | ST18 0FG |
| Billington Avenue | ST18 0UZ |
| Birch Close | ST18 0TB |
| Bishton Lane | ST17 0XW ST18 0XD ST18 0XE |
| Brewery Lane | ST18 0SN |
| Brickfield Close | ST18 0NY |
| Canal Side Cottages | ST18 0TT |
| Charlotte Close | ST18 0QJ |
| Chilwell Avenue | ST18 0QZ |
| Church Lane | ST18 0PS ST18 0PU |
| Church Road | ST18 0FS ST18 0PB |
| Church View | ST18 0GT |
| Cliff Road | ST18 0SZ |
| Coley Grove | ST18 0UW |
| Coley Lane | ST18 0UH ST18 0UP ST18 0UU ST18 0XA ST18 0XB |
| Convent Close | ST18 0QU |
| Cotters Hill Close | ST18 0UT |
| Covert Close | ST18 0RN |
| Crompton Close | ST18 0YS |
| Crossheads | ST18 0UG |
| Dobree Close | ST17 0XF |
| Earlsway | ST18 0RP |
| Egg Lane | ST18 0PR |
| Elm Close | ST18 0SP |
| Elm Crescent | ST18 0FD |
| Essex Drive | ST18 0RL |
| Farley Corner | ST18 0UD |
| Featherbed Lane | ST18 0QS |
| Forest Close | ST18 0NE |
| Foxgloves Avenue | ST18 0QT |
| Grange Court | ST18 0GQ |
| Greenacre | ST18 0QE |
| Greenfields | ST18 0NF |
| Hall Farm Close | ST18 0FU |
| Hammonds Croft | ST18 0PQ |
| Harland Close | ST18 0JY |
| Hawkesmore Drive | ST18 0UA |
| Haywood Grange | ST18 0UB |
| Haywood Heights | ST18 0UR |
| Hazeldene | ST18 0SG |
| High Chase Rise | ST18 0TY ST18 0TZ |
| High Street | ST18 0QF |
| Highfield Drive | ST18 0UX |
| Highfield Road | ST18 0LY |
| Hill Croft | ST18 0QN |
| Hillside Drive | ST18 0NN |
| Hunters Close | ST18 0GF |
| Ivy Court | ST18 0FF |
| Kingfisher Drive | ST18 0FH |
| Kingscroft | ST18 0FW |
| Lauder Grove | ST18 0PD |
| Lea Road | ST18 0NR |
| Leasowe Close | ST18 0RR |
| Legge Lane | ST18 0NU |
| Lichfield Drive | ST18 0SX |
| Little Tixall Lane | ST18 0SE |
| Main Road | ST17 0XD ST17 0XE ST17 0XH ST18 0RT ST18 0RZ ST18 0SR ST18 0SU ST18 0SW ST18 0TF ST18 0TR ST18 0TS ST18 0TU ST18 0TX |
| Manor Close | ST18 0SA |
| Manor Farm Road | ST18 0NW |
| Marlborough Close | ST18 0SF |
| Martins Way | ST18 0PW |
| Meadow Glade | ST18 0NT |
| Mill Lane | ST18 0RJ ST18 0RQ |
| New Road | ST18 0PE ST18 0PJ ST18 0PL |
| Northcote Close | ST18 0US |
| Nursery Way | ST18 0FY |
| Oak Close | ST18 0SY |
| Oldfields Crescent | ST18 0RS ST18 0RW |
| Orchard Lane | ST17 0XR |
| Paget Close | ST18 0YP |
| Pasture Fields | ST18 0RB ST18 0RD |
| Pasturefields Lane | ST18 0TH |
| Penn Croft | ST18 0UY |
| Pinewood Drive | ST18 0NX |
| Priory Drive | ST18 0QL |
| Puddle Hill | ST18 0NG |
| Ridgeway | ST18 0NZ |
| Rimbach Drive | ST18 0QY |
| Rockhouse Drive | ST18 0TD ST18 0TE |
| School Lane | ST18 0SL |
| Shelley Close | ST18 0JZ |
| Shephard Close | ST18 0FN |
| Smithy Lane | ST18 0PP |
| Sparrow Close | ST18 0JX |
| St Benedicts Drive | ST18 0QH |
| St Chads Close | ST18 0QW |
| St Marys Grange | ST18 0UE |
| St Marys Road | ST18 0NJ ST18 0QG |
| St Stephens Court | ST18 0GS |
| Station Road | ST17 0XZ |
| Stoney Brook Close | ST18 0FQ |
| Stowe Lane | ST18 0NB |
| Swansmoor Drive | ST18 0FP |
| Sycamore Drive | ST18 0FB |
| The Croft | ST18 0PX |
| The Moorings | ST17 0XT ST17 0XU |
| The Orchards | ST18 0UJ |
| The Ring | ST18 0TP |
| The Uplands | ST18 0SH ST18 0SJ ST18 0SQ |
| Tolldish Lane | ST18 0RA |
| Trent Close | ST18 0SS |
| Trent Lane | ST18 0ST |
| Trubshaw Close | ST18 0YR |
| Tylecote Crescent | ST18 0TA |
| Vicarage Way | ST18 0FT |
| Vine Close | ST18 0FE |
| Walnut Crest | ST18 0NS |
| Warehouse Cottages | ST17 0XJ |
| Wolseley Bridge | ST17 0XL ST17 0XP ST17 0XS |
| Wolseley Close | ST17 0XG |
| Wolseley Villas | ST17 0XQ |
| Woodside Close | ST18 0NH |
| ST18 0PT ST17 0XA ST18 0UQ |
Transport near Haywood And Hixon
-
Rugeley Trent Valley Station
-
Rugeley Town Station
-
Stafford Station
-
Hednesford Station
-
Penkridge Station
-
Cannock Station
-
Uttoxeter Station
-
Stone Station
- FAQ
- Price Paid By Year
- Property Type Price
Frequently asked questions about Haywood And Hixon
What is the average price for a property for sale in Haywood And Hixon?
The average price for a property for sale in Haywood And Hixon is £302,912. This amount is 11% higher than the average price in Stafford. There are 581 property listings for sale in Haywood And Hixon.
What streets have the most expensive properties for sale in Haywood And Hixon?
The streets with the most expensive properties for sale in Haywood And Hixon are Canal Side Cottages at an average of £761,710, Wolseley Bridge at an average of £710,000 and Kingfisher Drive at an average of £508,750.
What streets have the most affordable properties for sale in Haywood And Hixon?
The streets with the most affordable properties for sale in Haywood And Hixon are Anson Row at an average of £160,000, The Uplands at an average of £162,111 and Pasture Fields at an average of £168,333.
Which train stations are available in or near Haywood And Hixon?
Some of the train stations available in or near Haywood And Hixon are Rugeley Trent Valley, Rugeley Town and Stafford.
Property Price Paid in Haywood And Hixon by Year
The average sold property price by year was:
| Year | Average Sold Price | Price Change |
Sold Properties
|
|---|---|---|---|
| 2025 | £330,824 | 10% |
57 Properties |
| 2024 | £296,542 | 9% |
85 Properties |
| 2023 | £269,438 | -18% |
74 Properties |
| 2022 | £319,133 | 18% |
88 Properties |
| 2021 | £262,093 | 1% |
113 Properties |
| 2020 | £259,576 | 3% |
78 Properties |
| 2019 | £252,137 | 9% |
88 Properties |
| 2018 | £228,450 | -5% |
92 Properties |
| 2017 | £240,551 | 11% |
115 Properties |
| 2016 | £214,044 | -2% |
94 Properties |
| 2015 | £218,636 | 12% |
82 Properties |
| 2014 | £191,796 | -4% |
88 Properties |
| 2013 | £199,936 | 7% |
85 Properties |
| 2012 | £186,645 | -7% |
72 Properties |
| 2011 | £199,799 | -1% |
70 Properties |
| 2010 | £202,531 | 7% |
57 Properties |
| 2009 | £188,849 | 1% |
53 Properties |
| 2008 | £187,896 | -14% |
47 Properties |
| 2007 | £213,609 | 4% |
121 Properties |
| 2006 | £204,265 | 1% |
146 Properties |
| 2005 | £202,255 | 2% |
132 Properties |
| 2004 | £197,453 | 24% |
140 Properties |
| 2003 | £149,816 | 15% |
169 Properties |
| 2002 | £127,770 | 15% |
143 Properties |
| 2001 | £108,056 | 8% |
155 Properties |
| 2000 | £99,943 | 12% |
166 Properties |
| 1999 | £87,873 | 4% |
137 Properties |
| 1998 | £84,175 | 11% |
128 Properties |
| 1997 | £74,658 | 13% |
134 Properties |
| 1996 | £65,061 | 3% |
138 Properties |
| 1995 | £62,958 | - |
123 Properties |
Property Price per Property Type in Haywood And Hixon
Here you can find historic sold price data in order to help with your property search.
The average Property Paid Price for specific property types in the last three years are:
| Property Type | Average Sold Price | Sold Properties |
|---|---|---|
| Semi Detached House | £236,667.00 | 104 Semi Detached Houses |
| Detached House | £369,755.00 | 160 Detached Houses |
| Terraced House | £225,725.00 | 33 Terraced Houses |
| Flat | £123,142.00 | 7 Flats |

