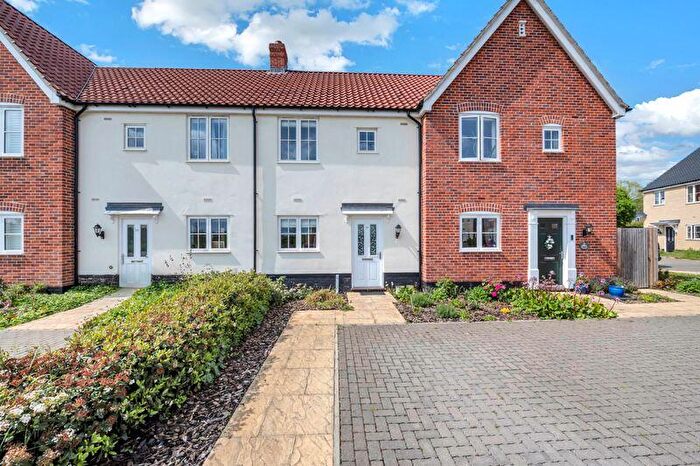
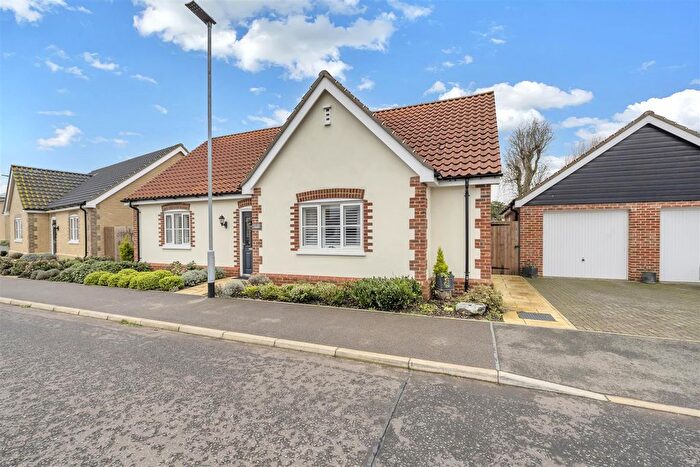
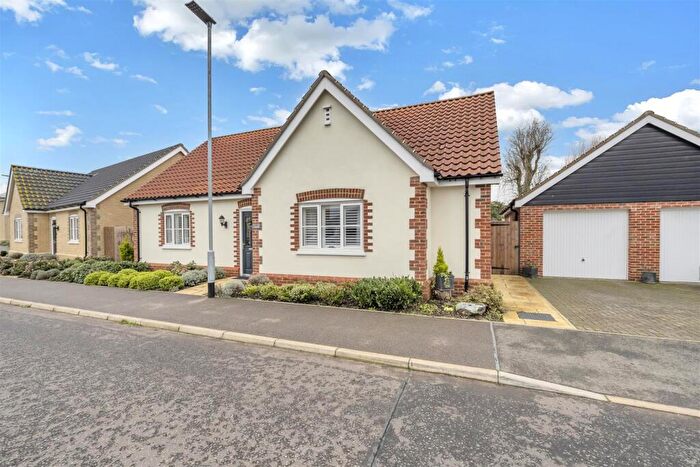
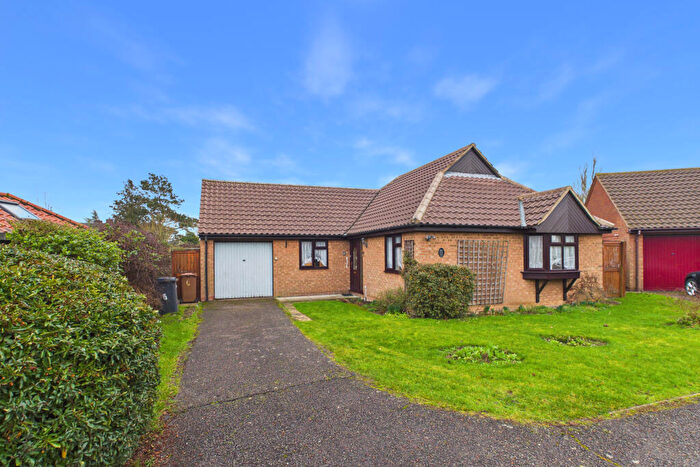
Houses for sale & to rent in Barrow, Bury St Edmunds
House Prices in Barrow
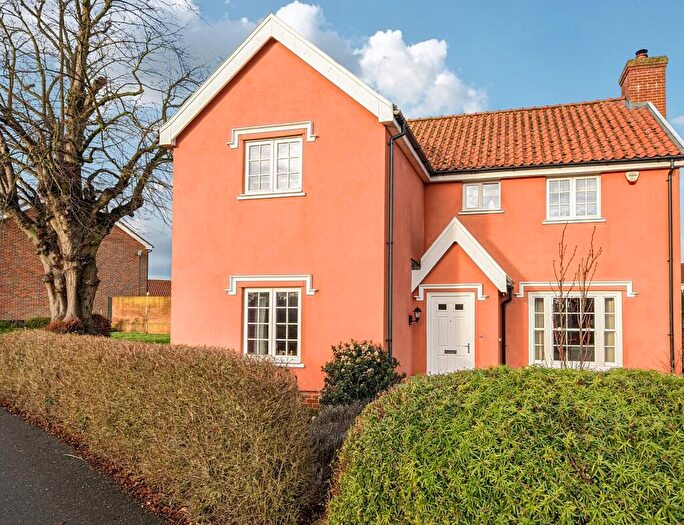
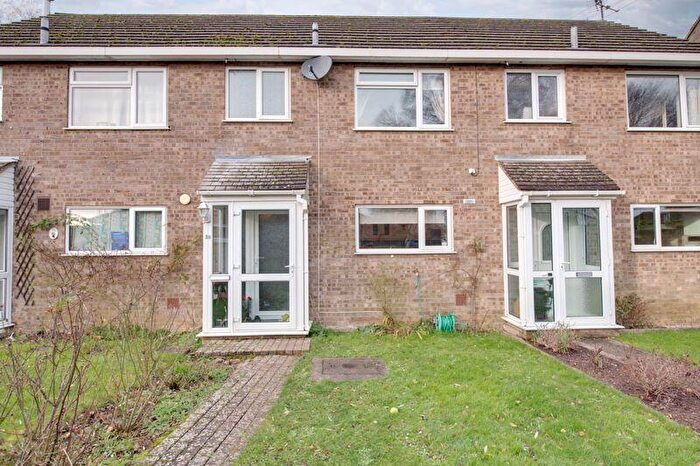
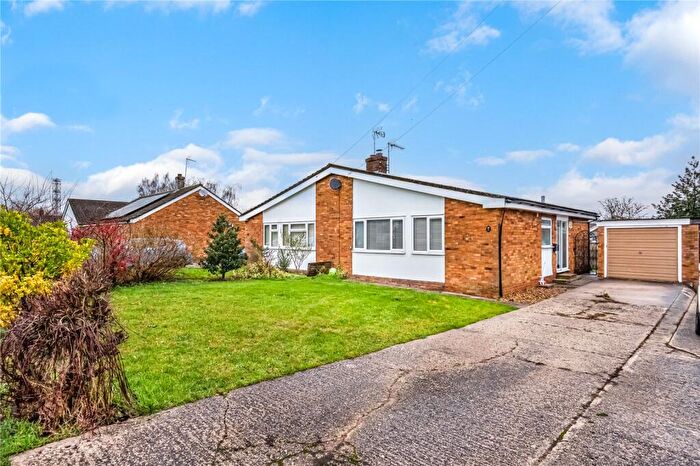
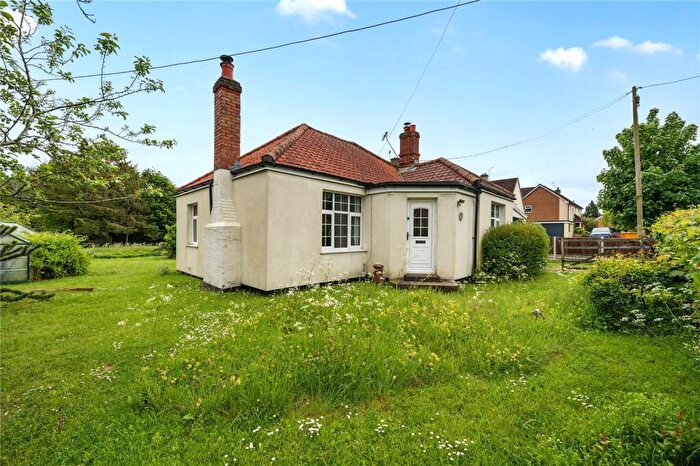
Properties in Barrow have an average house price of £416,191.00 and had 105 Property Transactions within the last 3 years¹.
Barrow is an area in Bury St Edmunds, Suffolk with 964 households², where the most expensive property was sold for £2,400,000.00.
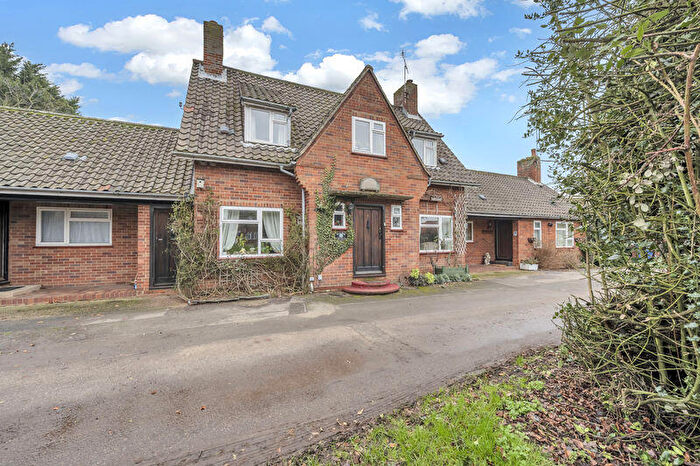
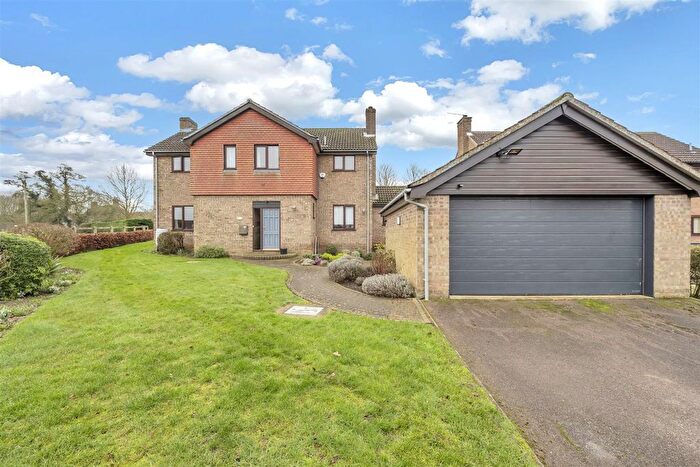
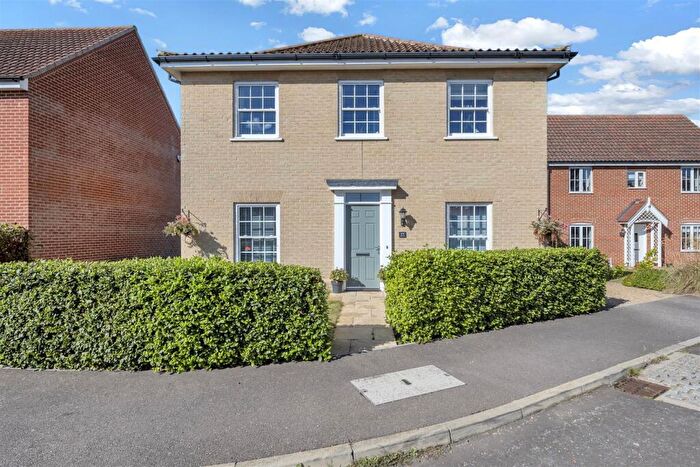
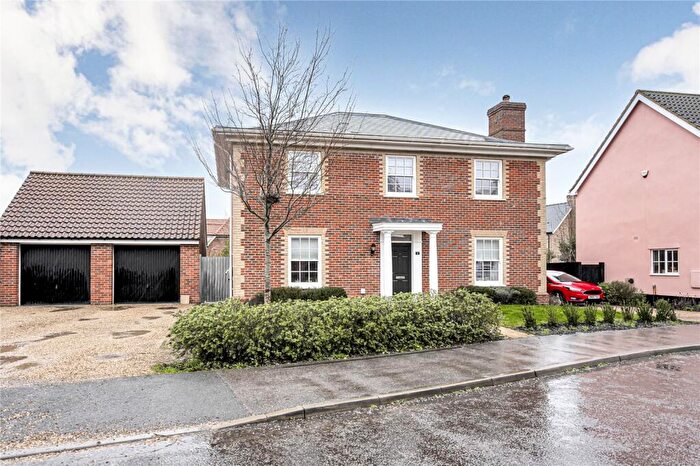
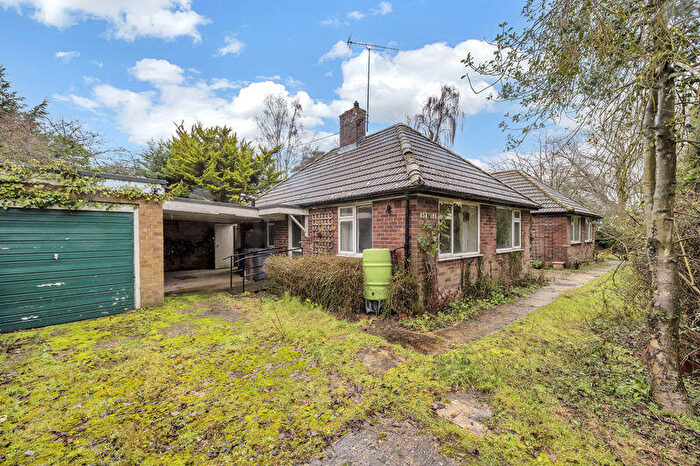
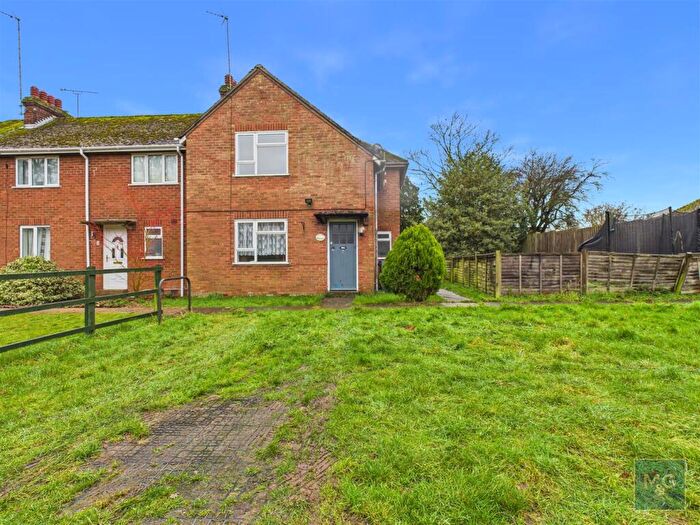
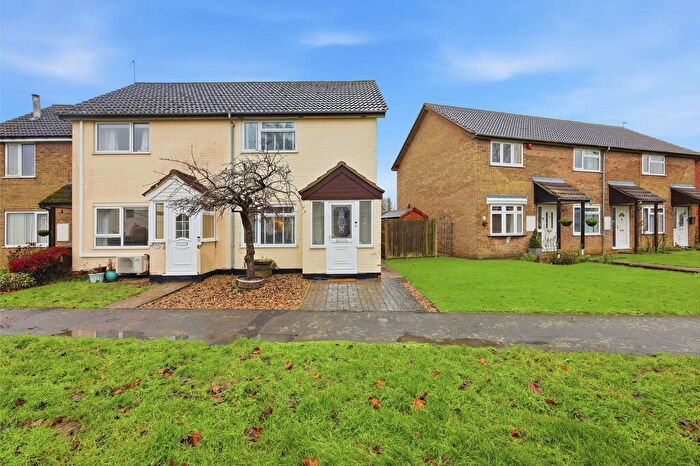
Properties for sale in Barrow
Roads and Postcodes in Barrow
Navigate through our locations to find the location of your next house in Barrow, Bury St Edmunds for sale or to rent.
| Streets | Postcodes |
|---|---|
| Abbots Close | IP29 5EN |
| Autumn Close | IP29 5DH |
| Barrow Hill | IP29 5DX |
| Barrow Road | IP29 5EH IP29 5EQ IP29 5JS IP28 6NN IP29 5EJ IP29 5JT |
| Beale Road | IP29 5ES |
| Beckett Close | IP33 3RA |
| Bluebell Way | IP29 5EY |
| Brittons Crescent | IP29 5AG |
| Brittons Road | IP29 5AF |
| Bullens Close | IP33 3TN |
| Burrells Orchard | IP33 3TH |
| Burthorpe Green | IP29 5DA |
| Bury Road | IP29 5AB IP29 5AE IP29 5DE |
| Castle Cottage | IP29 5ED |
| Cedar Crescent | IP29 5AZ |
| Cedar Road | IP29 5AW |
| Chevington Road | IP29 5JL |
| Church Cottages | IP29 5LD |
| Church Hayes | IP29 5AY |
| Church Road | IP29 5AU IP29 5AX |
| Cobbs Hall Road | IP29 5JN |
| Colethorpe Lane | IP29 5BE IP29 5BG |
| Dale Tree Road | IP29 5AD |
| Denham End | IP29 5EE |
| Denham Lane | IP29 5DZ |
| Denham Road | IP29 5EW |
| Fornham Lane | IP33 3TQ |
| Garden Lane | IP33 3TL |
| Green Farm Lane | IP29 5DN |
| Hall Farm Lane | IP33 3YD |
| Heighams | IP29 5AS |
| Hill Road | IP33 3TR |
| Honey Hill | IP29 5LA |
| Howletts Yard | IP29 5AT |
| Hudson Way | IP29 5DS |
| Johnson Road | IP29 5DY |
| Kitson Meadows | IP33 3RB |
| Ley Road | IP29 5DF IP29 5DJ |
| Lion Green | IP29 5DU |
| Little Mill Lane | IP29 5BU |
| Lylleyes Field Drive | IP29 5EB |
| Meadow Way | IP29 5DG |
| Mill Lane | IP29 5BS |
| New Barn | IP29 5DB |
| Newmarket Road | IP28 6QY IP28 6RE |
| Old Church Lane | IP33 3TJ |
| Orchard Farm Barns | IP29 5AJ |
| Orchard Way | IP29 5BX |
| Papeley Meadow | IP29 5DL |
| Parsons Court | IP33 3SL |
| Petticoat Lane | IP29 5DQ |
| Poplar Close | IP29 5DP |
| Rectory Place | IP29 5EP |
| Saxham Business Park | IP28 6QZ IP28 6RX IP28 6RZ |
| Sharpes Hill | IP29 5BY |
| Shop Close | IP29 5EG |
| Simpson Way | IP29 5EA |
| Stoney Lane | IP29 5DD |
| The Green | IP29 5AA IP29 5DT |
| The Street | IP29 5AN IP29 5AP |
| Twites Corner | IP29 5JR IP29 5JE |
| Walnut Tree Cottages | IP29 5JP |
| Watsons Way | IP29 5BQ |
| Westley Gardens | IP33 3FP |
| Westley Lane | IP33 3WB |
| IP29 5EF IP29 5EZ IP29 5JW IP29 5LB IP29 5LE IP29 5LF IP29 5LQ IP29 5BA IP29 5EL IP29 5LH IP28 6NP IP28 6NW IP29 5BB IP29 5BT IP29 5ET IP29 5JU IP33 3WD |
Transport near Barrow
- FAQ
- Price Paid By Year
- Property Type Price
Frequently asked questions about Barrow
What is the average price for a property for sale in Barrow?
The average price for a property for sale in Barrow is £416,191. This amount is 19% higher than the average price in Bury St Edmunds. There are 202 property listings for sale in Barrow.
What streets have the most expensive properties for sale in Barrow?
The streets with the most expensive properties for sale in Barrow are Walnut Tree Cottages at an average of £675,000, Orchard Farm Barns at an average of £662,501 and Rectory Place at an average of £650,000.
What streets have the most affordable properties for sale in Barrow?
The streets with the most affordable properties for sale in Barrow are Little Mill Lane at an average of £193,567, Cedar Road at an average of £230,000 and Brittons Crescent at an average of £264,921.
Which train stations are available in or near Barrow?
Some of the train stations available in or near Barrow are Bury St.Edmunds, Kennett and Newmarket.
Property Price Paid in Barrow by Year
The average sold property price by year was:
| Year | Average Sold Price | Price Change |
Sold Properties
|
|---|---|---|---|
| 2025 | £399,328 | 4% |
35 Properties |
| 2024 | £385,133 | -19% |
32 Properties |
| 2023 | £457,876 | -1% |
38 Properties |
| 2022 | £461,873 | 6% |
31 Properties |
| 2021 | £435,865 | 12% |
63 Properties |
| 2020 | £382,567 | 6% |
41 Properties |
| 2019 | £359,329 | -42% |
29 Properties |
| 2018 | £510,677 | 29% |
24 Properties |
| 2017 | £362,694 | -3% |
49 Properties |
| 2016 | £373,335 | 18% |
66 Properties |
| 2015 | £305,016 | 8% |
61 Properties |
| 2014 | £281,594 | -5% |
56 Properties |
| 2013 | £297,055 | 3% |
37 Properties |
| 2012 | £287,178 | 13% |
34 Properties |
| 2011 | £251,236 | -1% |
23 Properties |
| 2010 | £253,486 | -7% |
21 Properties |
| 2009 | £271,498 | 3% |
35 Properties |
| 2008 | £263,426 | 5% |
16 Properties |
| 2007 | £251,181 | 1% |
42 Properties |
| 2006 | £247,429 | 5% |
44 Properties |
| 2005 | £234,336 | 8% |
43 Properties |
| 2004 | £215,496 | 18% |
42 Properties |
| 2003 | £176,711 | 18% |
53 Properties |
| 2002 | £145,235 | 2% |
43 Properties |
| 2001 | £142,822 | 14% |
71 Properties |
| 2000 | £122,509 | -5% |
39 Properties |
| 1999 | £128,215 | 15% |
31 Properties |
| 1998 | £108,353 | 21% |
25 Properties |
| 1997 | £85,770 | -26% |
29 Properties |
| 1996 | £107,959 | 10% |
33 Properties |
| 1995 | £97,131 | - |
34 Properties |
Property Price per Property Type in Barrow
Here you can find historic sold price data in order to help with your property search.
The average Property Paid Price for specific property types in the last three years are:
| Property Type | Average Sold Price | Sold Properties |
|---|---|---|
| Semi Detached House | £331,758.00 | 28 Semi Detached Houses |
| Detached House | £526,641.00 | 53 Detached Houses |
| Terraced House | £277,193.00 | 22 Terraced Houses |
| Flat | £200,283.00 | 2 Flats |

