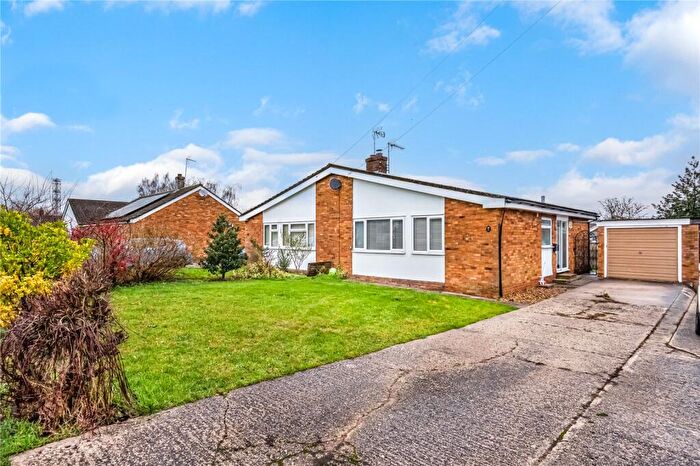
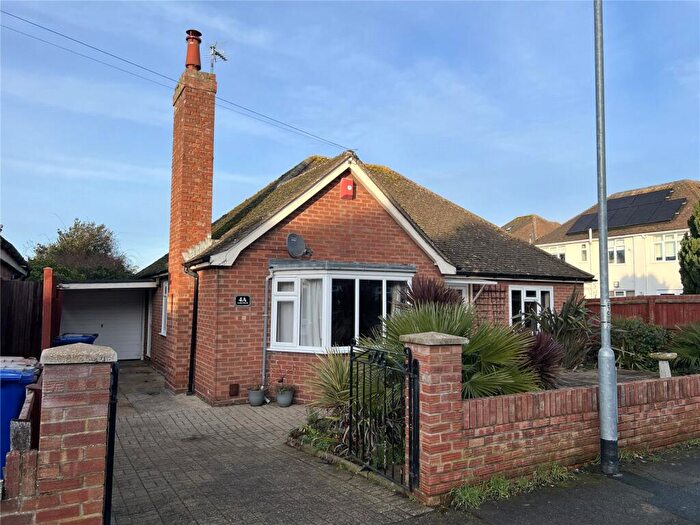
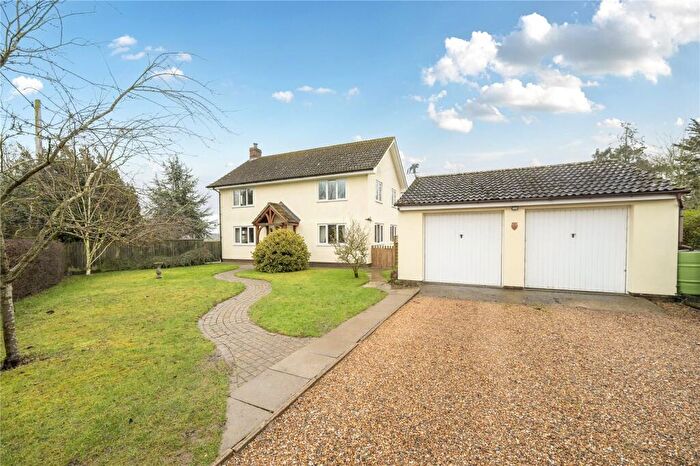
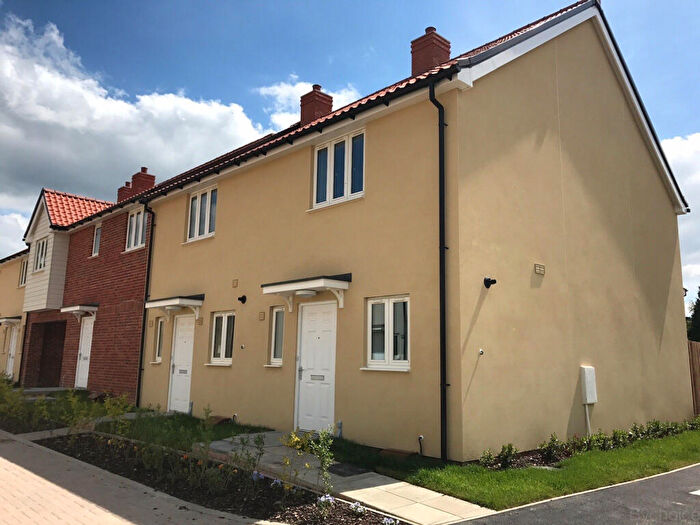
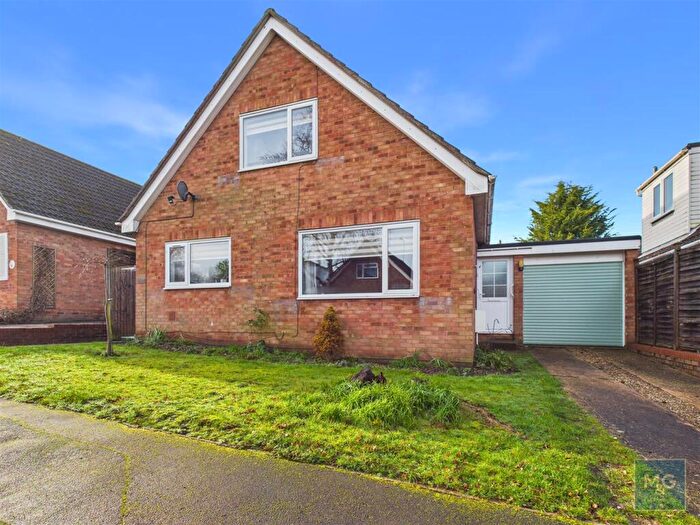
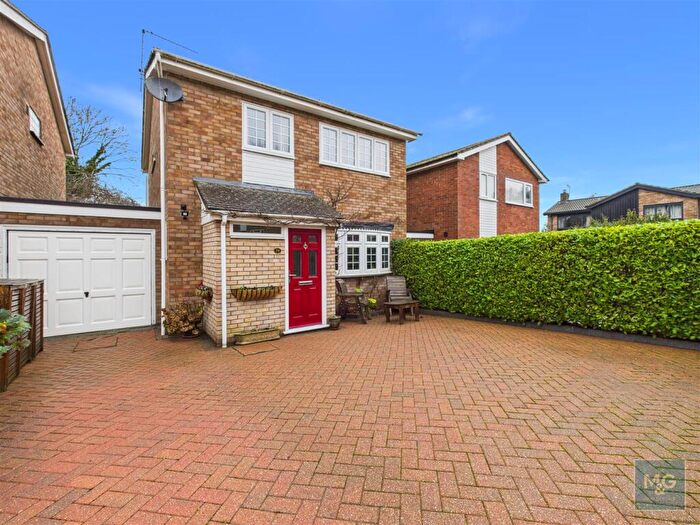
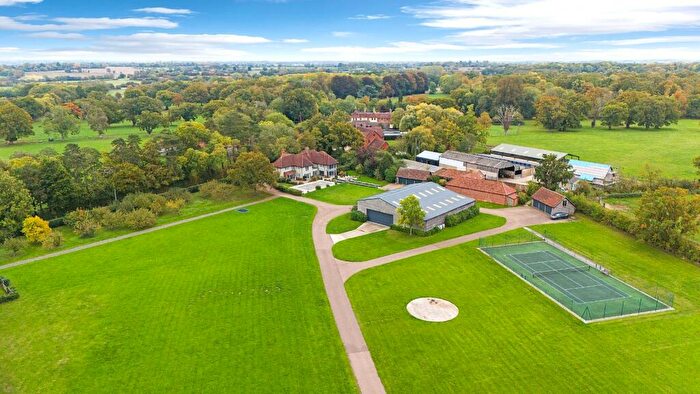
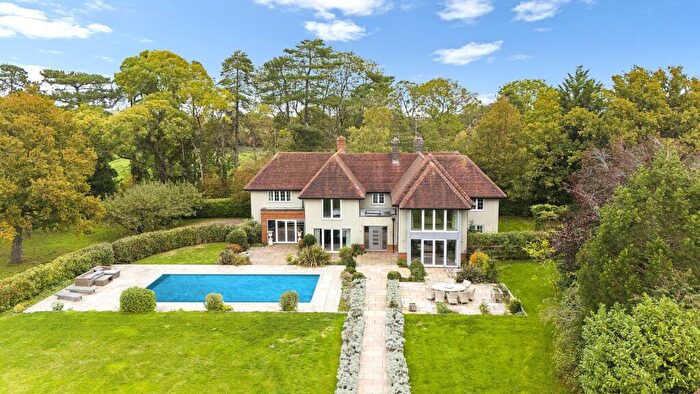
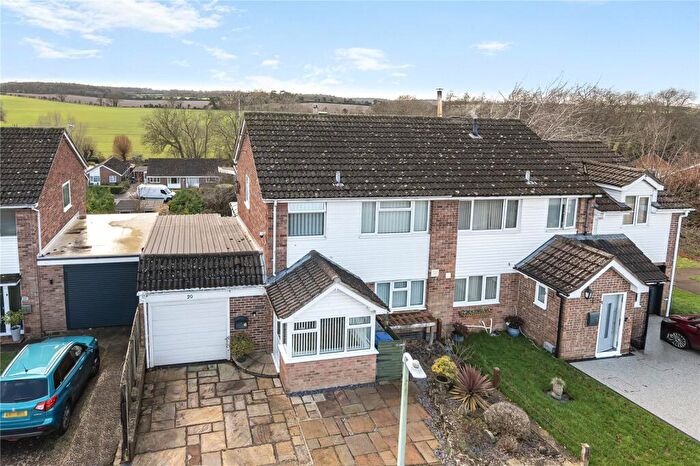
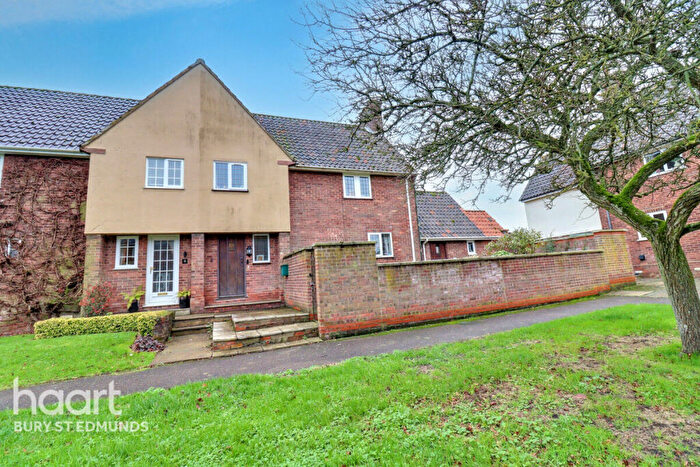
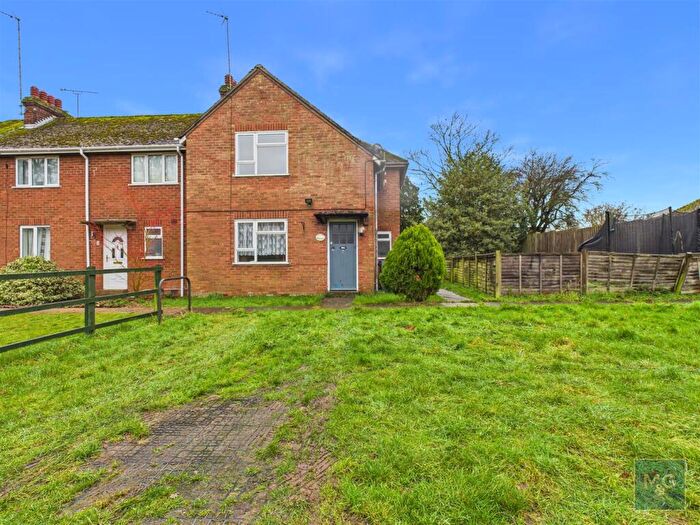
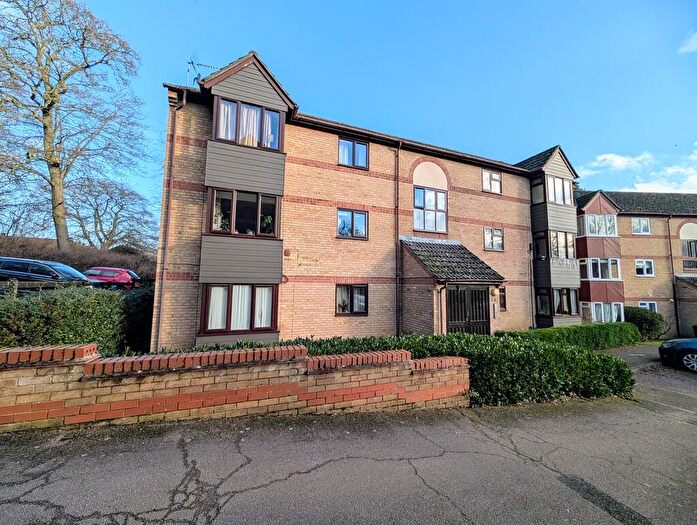
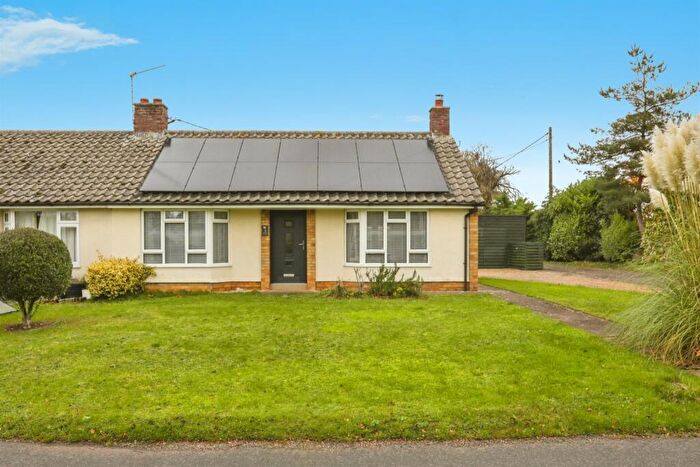
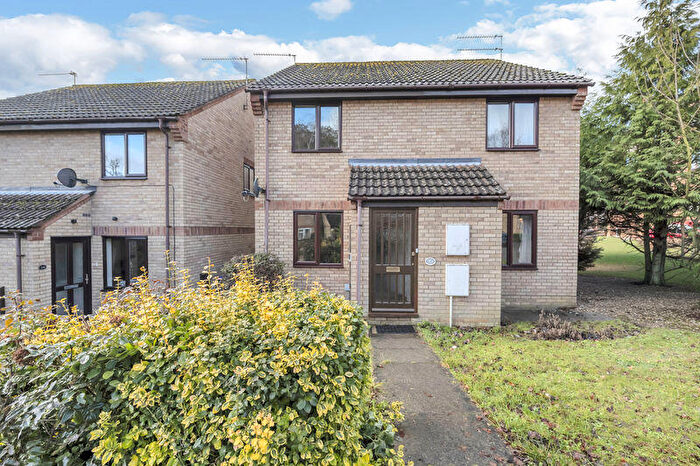
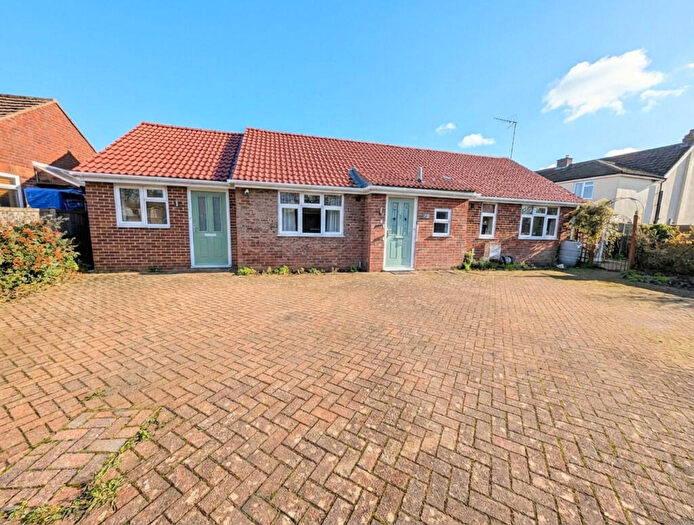
Houses for sale & to rent in Chedburgh, Bury St Edmunds
House Prices in Chedburgh
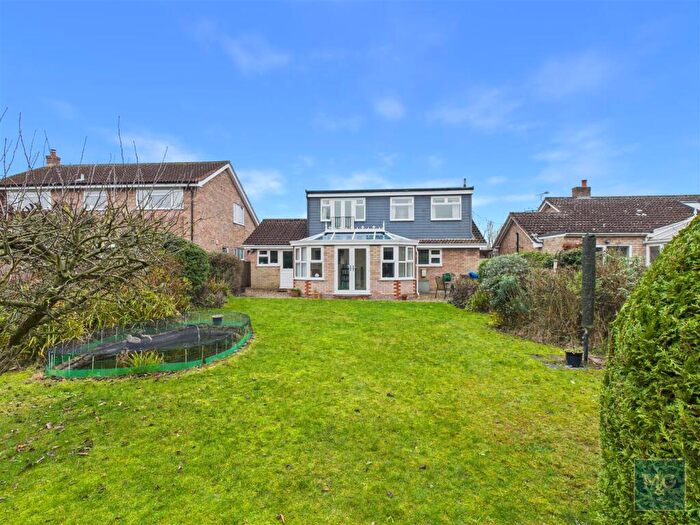
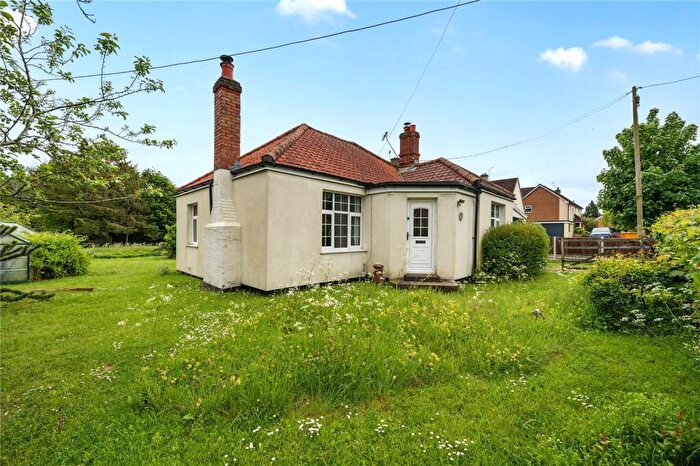
Properties in Chedburgh have an average house price of £469,561.00 and had 59 Property Transactions within the last 3 years¹.
Chedburgh is an area in Bury St Edmunds, Suffolk with 855 households², where the most expensive property was sold for £1,240,000.00.
Properties for sale in Chedburgh
Roads and Postcodes in Chedburgh
Navigate through our locations to find the location of your next house in Chedburgh, Bury St Edmunds for sale or to rent.
| Streets | Postcodes |
|---|---|
| All Saints Rise | IP29 5QP |
| Barn Field | IP29 5QN |
| Bell Lane | IP29 5NW |
| Broad Green Close | IP29 5RN |
| Brockley Road | IP29 4TW IP29 4SP |
| Brookes Corner | IP29 5RH |
| Bull Lane | IP29 5NU |
| Bury Road | IP29 4SZ IP29 4UQ |
| Chedburgh Road | IP29 4UB IP29 5QS IP29 5QU IP29 5QX IP29 5QY |
| Chestnut Crescent | IP29 4UJ |
| Chevington Road | IP29 4UL IP29 4UP |
| Church Close | IP29 4BG |
| Church Hill | IP29 4TR |
| Church Road | IP29 5PE IP29 5QH |
| Depden Lane | IP29 5RW |
| Elizabeth Drive | IP29 4XA IP29 4XB |
| Factory Lane | IP29 5QF |
| Farrows Close | IP29 5QJ |
| Grange Mill | IP29 5PQ |
| Hargrave Road | IP29 5QR |
| Kings Park | IP29 4TY |
| Lancaster Close | IP29 4UW |
| Lawshall Road | IP29 5NR |
| Lodge Cottages | IP29 4BQ |
| Majors Close | IP29 4UN |
| Maltings Close | IP29 5RP |
| Mickley Green | IP29 4TD |
| New Road | IP29 5QL |
| North Hill Cottages | IP29 5HA |
| Old Post Office Road | IP29 5RB IP29 5RD IP29 5RE |
| Old School Road | IP29 4UA |
| Paddock Way | IP29 4UY |
| Queens Lane | IP29 4UT IP29 4UX IP29 5RF |
| Rectory Grove | IP29 4TP |
| Rectory Road | IP29 4TB IP29 4TE |
| Rede Road | IP29 4SS IP29 4SR IP29 4ST |
| Straight Road | IP29 4TF |
| Tan Office Lane | IP29 5QZ |
| Tennis Field | IP29 5QW |
| The Drive | IP29 4AB |
| The Green | IP29 4UE IP29 5NP |
| The Pound | IP29 5NJ |
| The Street | IP29 4UH |
| Tudor Close | IP29 4XD |
| Tuffields Road | IP29 4TL IP29 4TN |
| Weathercock Hill | IP29 5RG |
| Whepstead Road | IP29 5NS |
| IP29 4TG IP29 4TQ IP29 4UD IP29 4UG IP29 4UR IP29 5NX IP29 5QQ IP29 5RA IP29 5RQ IP29 4BE IP29 4SU IP29 5LJ IP29 5NH IP29 5NL IP29 5NT |
Transport near Chedburgh
- FAQ
- Price Paid By Year
- Property Type Price
Frequently asked questions about Chedburgh
What is the average price for a property for sale in Chedburgh?
The average price for a property for sale in Chedburgh is £469,561. This amount is 34% higher than the average price in Bury St Edmunds. There are 651 property listings for sale in Chedburgh.
What streets have the most expensive properties for sale in Chedburgh?
The streets with the most expensive properties for sale in Chedburgh are Kings Park at an average of £679,400, Old School Road at an average of £660,000 and Bull Lane at an average of £640,000.
What streets have the most affordable properties for sale in Chedburgh?
The streets with the most affordable properties for sale in Chedburgh are Paddock Way at an average of £243,373, Depden Lane at an average of £250,000 and North Hill Cottages at an average of £264,900.
Which train stations are available in or near Chedburgh?
Some of the train stations available in or near Chedburgh are Bury St.Edmunds, Thurston and Kennett.
Property Price Paid in Chedburgh by Year
The average sold property price by year was:
| Year | Average Sold Price | Price Change |
Sold Properties
|
|---|---|---|---|
| 2025 | £444,315 | -19% |
19 Properties |
| 2024 | £527,228 | 18% |
21 Properties |
| 2023 | £431,069 | -10% |
19 Properties |
| 2022 | £474,818 | 16% |
22 Properties |
| 2021 | £399,562 | 2% |
32 Properties |
| 2020 | £391,913 | -9% |
29 Properties |
| 2019 | £428,533 | -2% |
15 Properties |
| 2018 | £435,785 | -3% |
35 Properties |
| 2017 | £449,452 | 29% |
21 Properties |
| 2016 | £316,942 | 2% |
26 Properties |
| 2015 | £311,370 | -17% |
27 Properties |
| 2014 | £362,906 | 20% |
30 Properties |
| 2013 | £291,734 | -16% |
32 Properties |
| 2012 | £338,958 | 10% |
24 Properties |
| 2011 | £305,952 | 9% |
40 Properties |
| 2010 | £278,301 | 10% |
28 Properties |
| 2009 | £250,845 | -35% |
13 Properties |
| 2008 | £339,270 | 5% |
24 Properties |
| 2007 | £321,145 | 15% |
40 Properties |
| 2006 | £272,951 | -18% |
45 Properties |
| 2005 | £322,444 | 17% |
38 Properties |
| 2004 | £266,228 | 9% |
41 Properties |
| 2003 | £243,521 | 28% |
33 Properties |
| 2002 | £176,029 | 8% |
43 Properties |
| 2001 | £162,225 | 2% |
47 Properties |
| 2000 | £159,062 | 21% |
67 Properties |
| 1999 | £125,932 | -7% |
46 Properties |
| 1998 | £135,051 | 25% |
31 Properties |
| 1997 | £101,217 | 9% |
44 Properties |
| 1996 | £92,024 | 7% |
34 Properties |
| 1995 | £85,437 | - |
32 Properties |
Property Price per Property Type in Chedburgh
Here you can find historic sold price data in order to help with your property search.
The average Property Paid Price for specific property types in the last three years are:
| Property Type | Average Sold Price | Sold Properties |
|---|---|---|
| Semi Detached House | £351,184.00 | 13 Semi Detached Houses |
| Detached House | £535,142.00 | 41 Detached Houses |
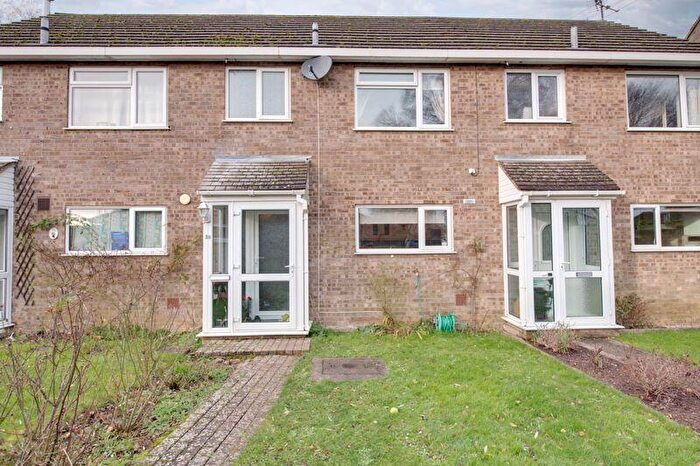
| Terraced House | £239,573.00 | 5 Terraced Houses |

