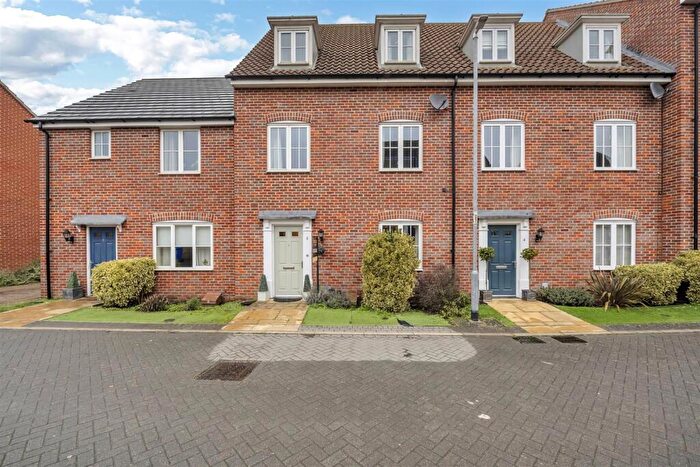
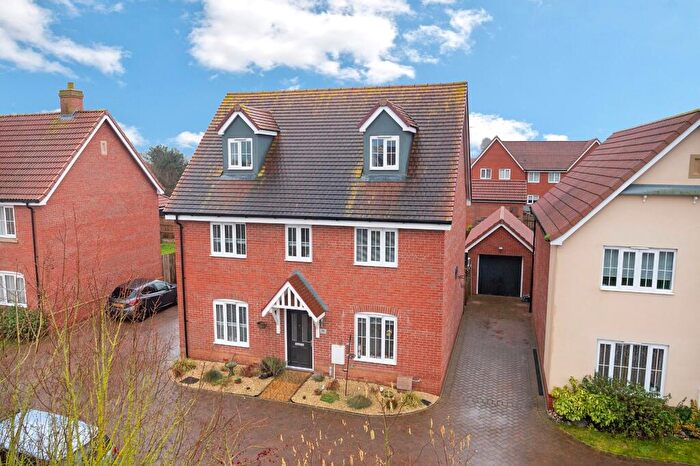
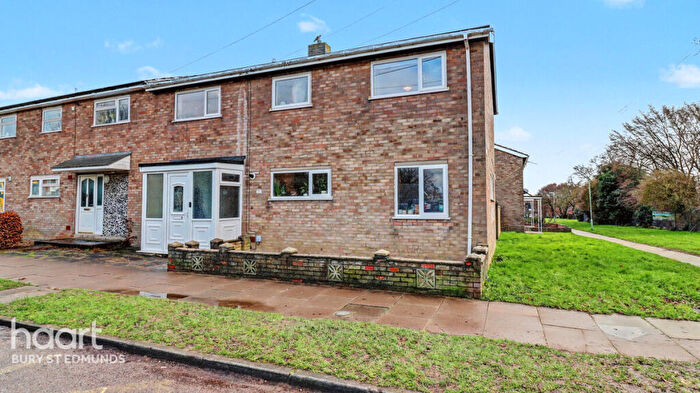
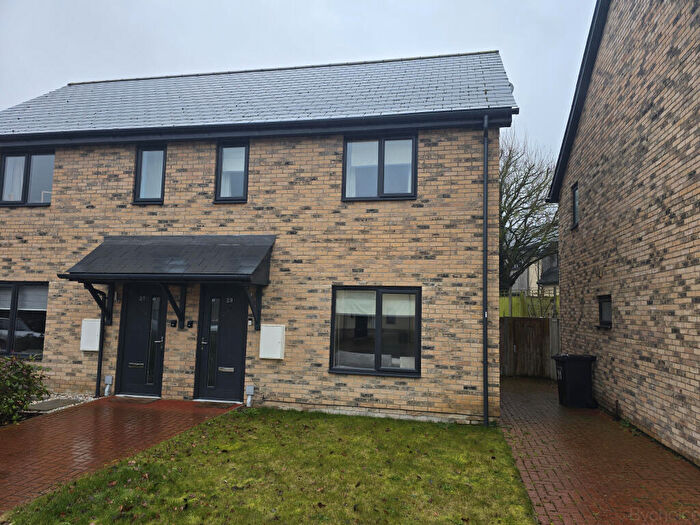
Houses for sale & to rent in Horringer And Whelnetham, Bury St Edmunds
House Prices in Horringer And Whelnetham
Properties in Horringer And Whelnetham have an average house price of £402,010.00 and had 70 Property Transactions within the last 3 years¹.
Horringer And Whelnetham is an area in Bury St Edmunds, Suffolk with 860 households², where the most expensive property was sold for £1,394,550.00.
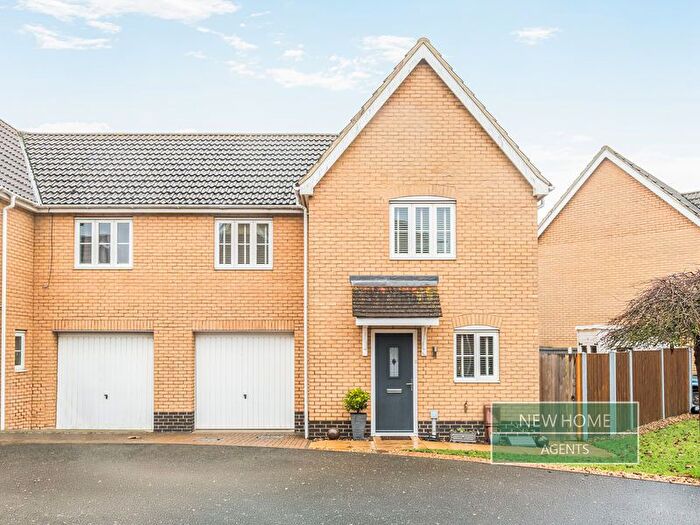
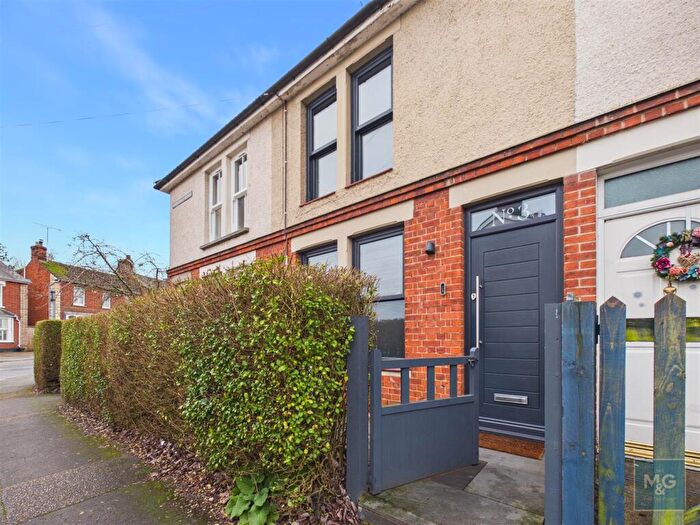
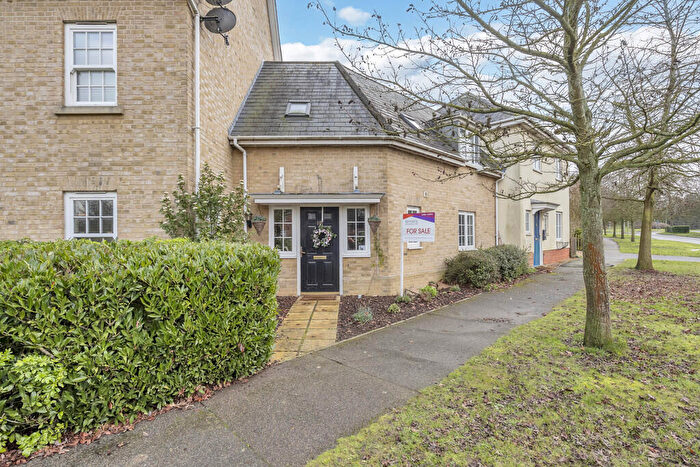
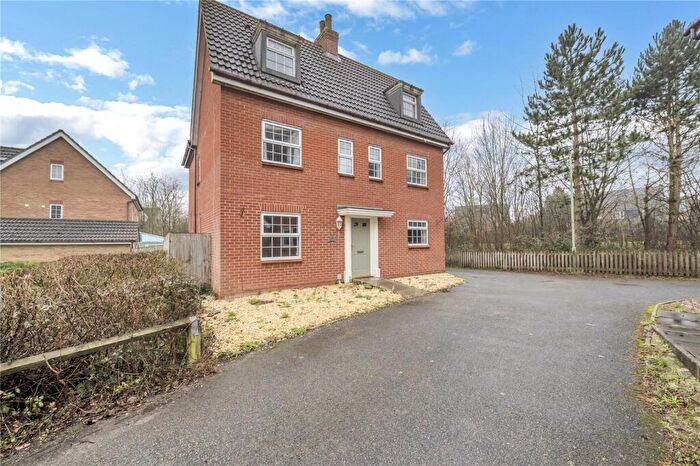
Properties for sale in Horringer And Whelnetham
Roads and Postcodes in Horringer And Whelnetham
Navigate through our locations to find the location of your next house in Horringer And Whelnetham, Bury St Edmunds for sale or to rent.
| Streets | Postcodes |
|---|---|
| Brook Close | IP29 5PY |
| Bury Road | IP30 0BS IP30 0DZ |
| Cocks Green Lane | IP30 0UE IP30 0UF IP30 0UG |
| College Close | IP29 5SL |
| Cooper Lane | IP29 5LY |
| Friars Way | IP30 0TR |
| Glebe Close | IP29 5PR |
| Godfreys Close | IP29 5SR |
| Godfreys Cottages | IP29 5SW |
| Hambrook Close | IP30 0UX |
| Hawstead Lane | IP30 0BT |
| Hawthorn Drive | IP29 5SS |
| Hazel Drive | IP29 5ST |
| Holly Close | IP29 5SZ |
| Hornbeam Drive | IP29 5SP |
| Hornings Park | IP29 5AL |
| Horsecroft | IP29 5NY |
| Kent Cottages | IP30 0DY |
| Little Whelnetham Road | IP30 0BX |
| Low Green | IP29 5ND IP30 0DS |
| Lower Green | IP30 0DR |
| Meadow Drive | IP29 5SB |
| Nowton Court | IP29 5LU |
| Orchard Way | IP29 5SF |
| Parsonage Lane | IP30 0DB |
| Raynsford Rise | IP30 0TS |
| Raynsford Road | IP30 0TN IP30 0TW |
| Sharps Green | IP29 5PP |
| Sharps Lane | IP29 5PS IP29 5PW |
| Slough Lane | IP29 5PL |
| St Thomass Way | IP30 0TP |
| Stanningfield Road | IP30 0UA IP30 0UB IP30 0TL IP30 0TY IP30 0UY |
| Station Hill | IP30 0DT |
| Sudbury Road | IP30 0TJ IP30 0UL |
| The Beeches | IP29 5SG |
| The Chestnuts | IP29 5SD |
| The Elms | IP29 5SE |
| The Green | IP29 5RX |
| The Limes | IP29 5SQ |
| The Oaks | IP29 5SH |
| The Pound | IP29 5NE |
| The Street | IP29 5RY IP29 5SA IP29 5SJ IP29 5SN IP29 5RU |
| Tutelina Rise | IP30 0TT |
| Tutelina Road | IP30 0TX |
| Water Lane | IP30 0DU |
| Westley Lane | IP29 5RZ |
| Whepstead Road | IP29 5PU |
| IP30 0BU IP30 0DA IP30 0DG IP30 0TH IP29 4AD IP29 4RX IP29 4RZ IP29 5NA IP29 5LG IP29 5NB IP29 5PJ IP30 0UH |
Transport near Horringer And Whelnetham
- FAQ
- Price Paid By Year
- Property Type Price
Frequently asked questions about Horringer And Whelnetham
What is the average price for a property for sale in Horringer And Whelnetham?
The average price for a property for sale in Horringer And Whelnetham is £402,010. This amount is 15% higher than the average price in Bury St Edmunds. There are 2,405 property listings for sale in Horringer And Whelnetham.
What streets have the most expensive properties for sale in Horringer And Whelnetham?
The streets with the most expensive properties for sale in Horringer And Whelnetham are Horsecroft at an average of £770,500, Brook Close at an average of £741,600 and The Elms at an average of £654,000.
What streets have the most affordable properties for sale in Horringer And Whelnetham?
The streets with the most affordable properties for sale in Horringer And Whelnetham are Godfreys Cottages at an average of £168,346, Godfreys Close at an average of £222,500 and College Close at an average of £245,000.
Which train stations are available in or near Horringer And Whelnetham?
Some of the train stations available in or near Horringer And Whelnetham are Bury St.Edmunds, Thurston and Elmswell.
Property Price Paid in Horringer And Whelnetham by Year
The average sold property price by year was:
| Year | Average Sold Price | Price Change |
Sold Properties
|
|---|---|---|---|
| 2025 | £405,325 | 4% |
24 Properties |
| 2024 | £388,142 | -8% |
27 Properties |
| 2023 | £417,530 | 6% |
19 Properties |
| 2022 | £394,111 | -5% |
36 Properties |
| 2021 | £415,261 | 10% |
50 Properties |
| 2020 | £372,466 | -3% |
24 Properties |
| 2019 | £382,665 | 5% |
30 Properties |
| 2018 | £364,978 | -1% |
25 Properties |
| 2017 | £369,777 | 11% |
27 Properties |
| 2016 | £330,712 | -13% |
28 Properties |
| 2015 | £374,187 | 10% |
44 Properties |
| 2014 | £336,790 | 22% |
43 Properties |
| 2013 | £263,814 | 10% |
35 Properties |
| 2012 | £236,291 | -7% |
30 Properties |
| 2011 | £253,391 | -13% |
37 Properties |
| 2010 | £287,448 | 10% |
29 Properties |
| 2009 | £258,850 | -5% |
31 Properties |
| 2008 | £271,141 | -10% |
23 Properties |
| 2007 | £297,749 | 16% |
62 Properties |
| 2006 | £250,347 | -1% |
44 Properties |
| 2005 | £253,984 | 13% |
46 Properties |
| 2004 | £220,585 | -9% |
46 Properties |
| 2003 | £239,802 | 25% |
36 Properties |
| 2002 | £180,936 | 16% |
35 Properties |
| 2001 | £151,937 | 0,4% |
32 Properties |
| 2000 | £151,323 | 26% |
45 Properties |
| 1999 | £111,729 | 9% |
54 Properties |
| 1998 | £101,845 | 23% |
37 Properties |
| 1997 | £77,978 | -4% |
31 Properties |
| 1996 | £81,050 | 1% |
30 Properties |
| 1995 | £80,591 | - |
36 Properties |
Property Price per Property Type in Horringer And Whelnetham
Here you can find historic sold price data in order to help with your property search.
The average Property Paid Price for specific property types in the last three years are:
| Property Type | Average Sold Price | Sold Properties |
|---|---|---|
| Semi Detached House | £441,742.00 | 12 Semi Detached Houses |
| Detached House | £427,246.00 | 42 Detached Houses |
| Terraced House | £310,038.00 | 13 Terraced Houses |
| Flat | £288,333.00 | 3 Flats |

