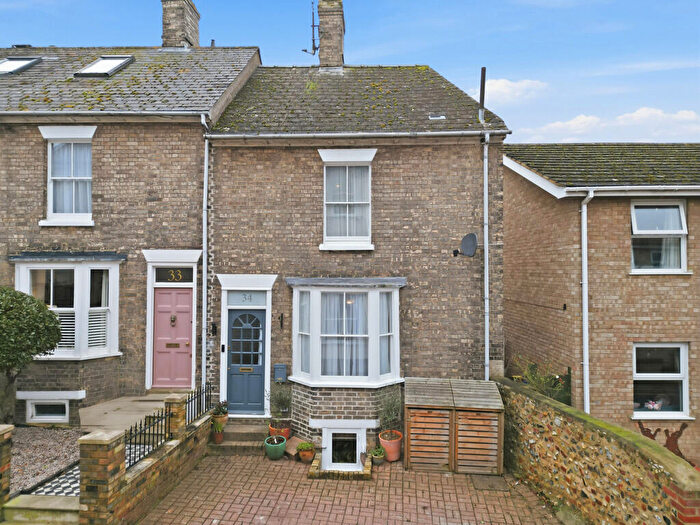
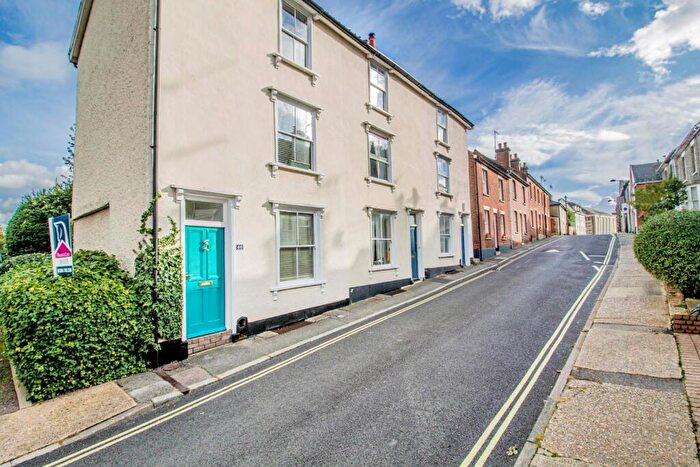
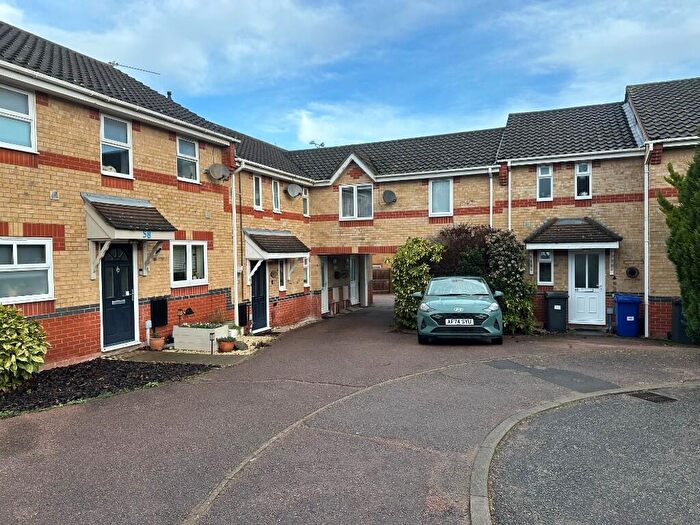
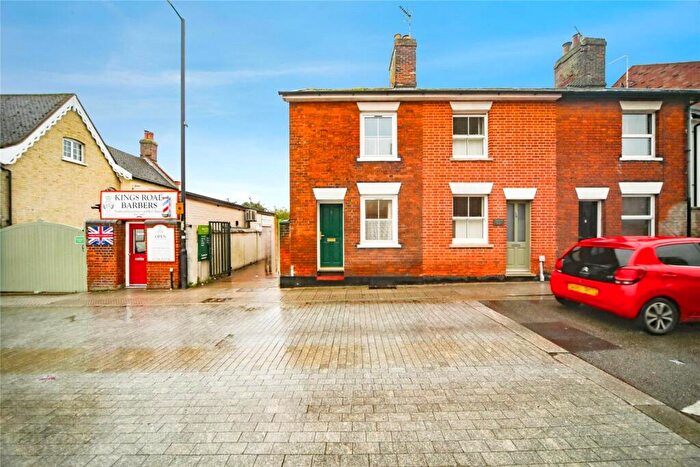
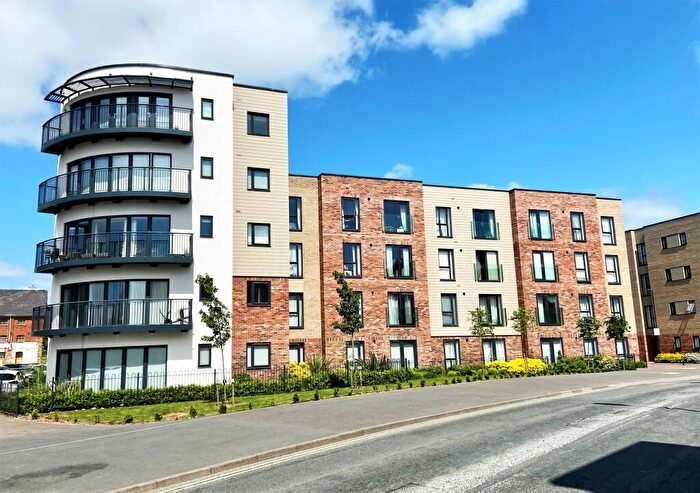
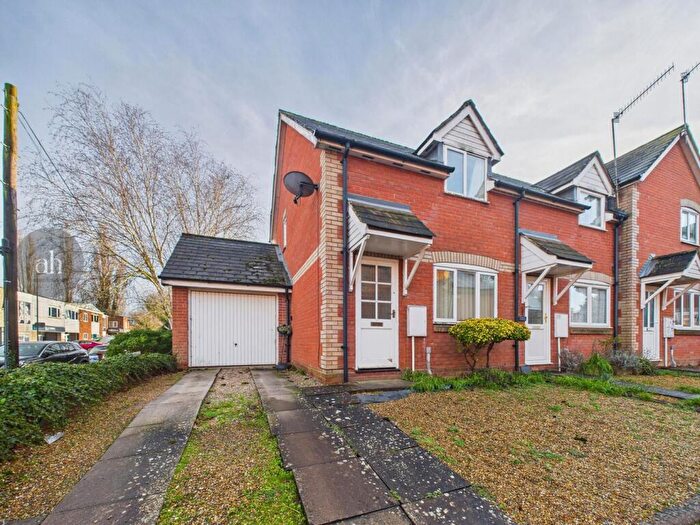
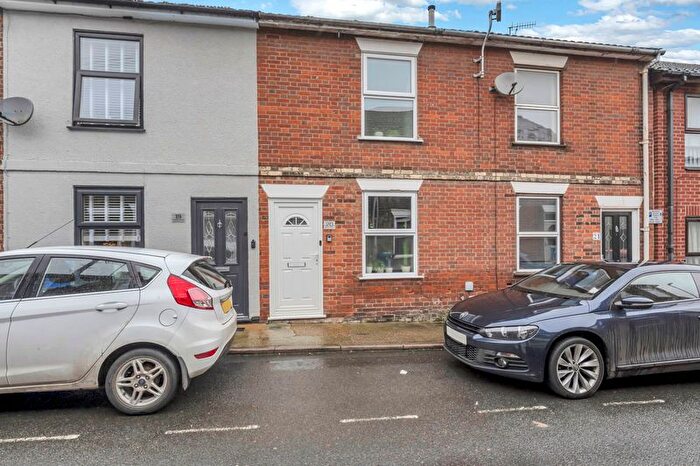
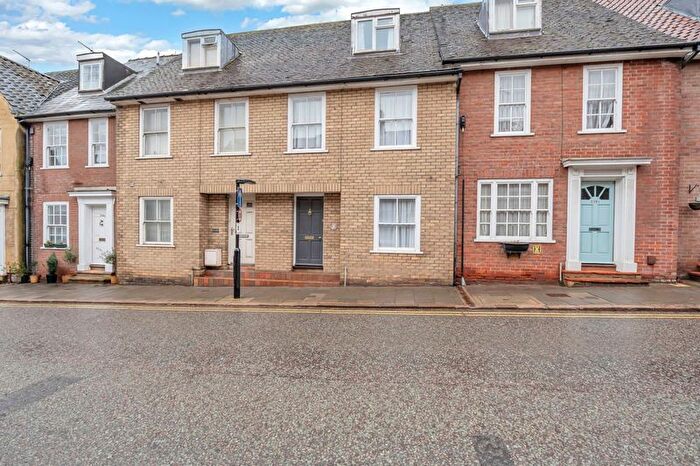
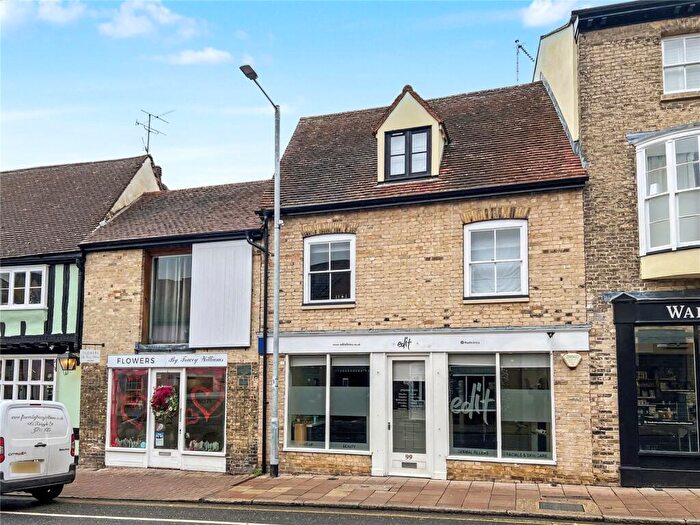
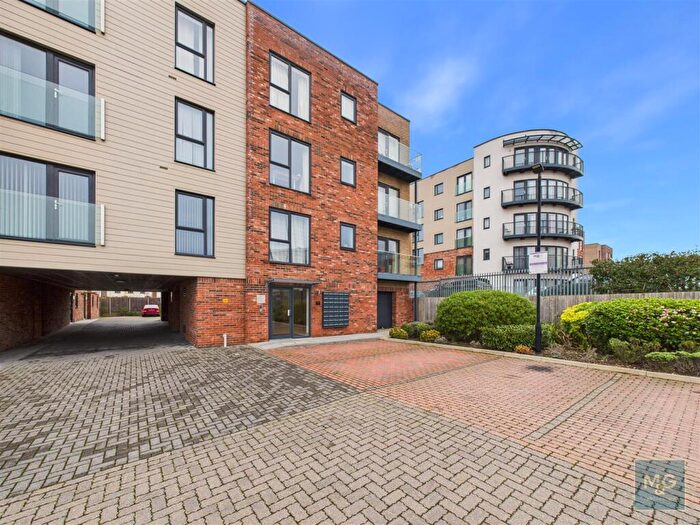
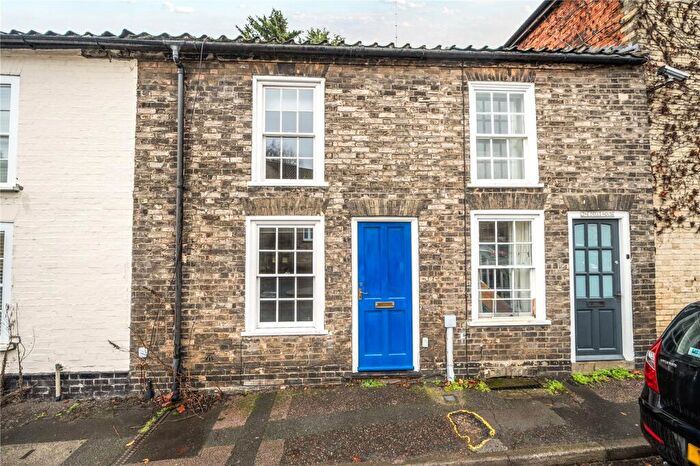
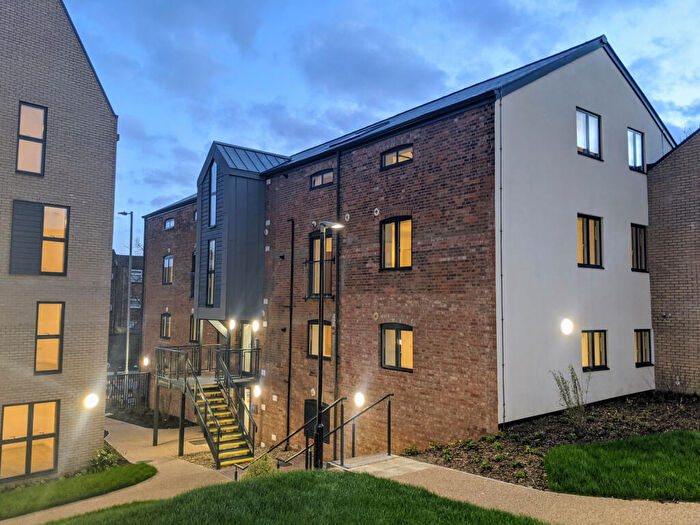
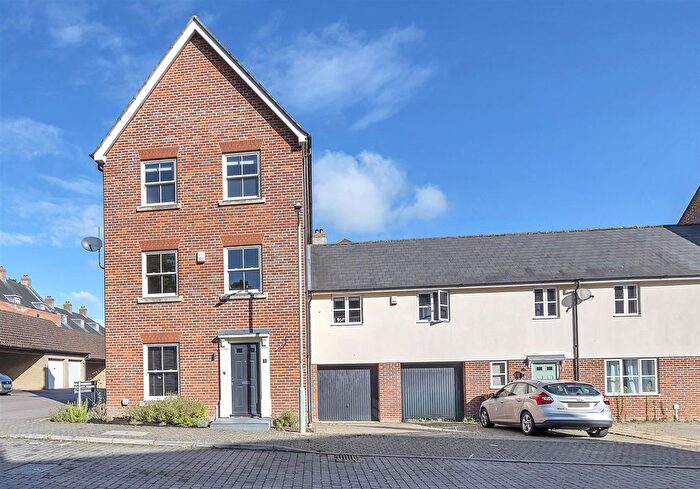
Houses for sale & to rent in Eastgate, Bury St Edmunds
House Prices in Eastgate
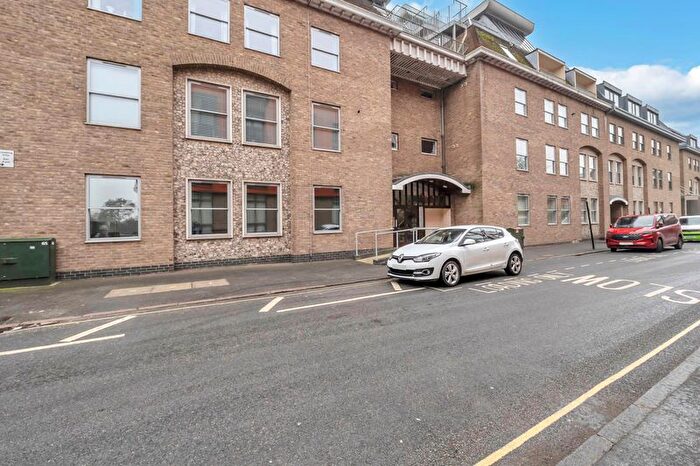
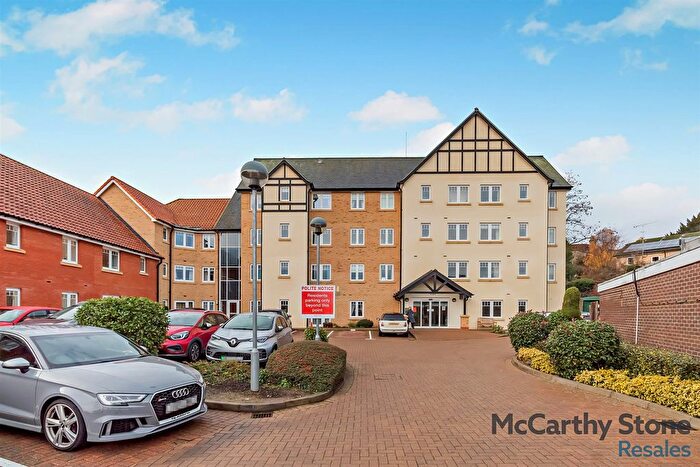
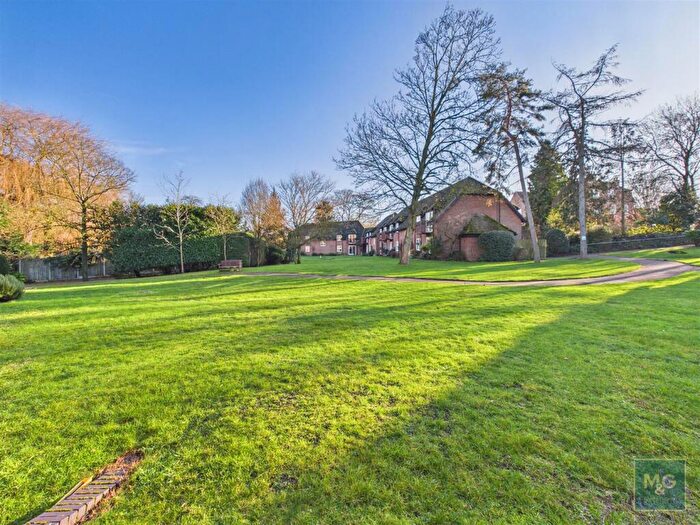
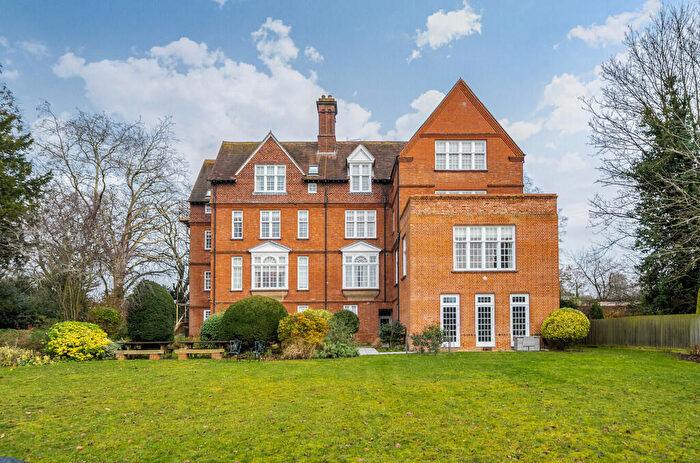
Properties in Eastgate have an average house price of £277,184.00 and had 161 Property Transactions within the last 3 years¹.
Eastgate is an area in Bury St Edmunds, Suffolk with 1,312 households², where the most expensive property was sold for £1,900,000.00.
Properties for sale in Eastgate
Roads and Postcodes in Eastgate
Navigate through our locations to find the location of your next house in Eastgate, Bury St Edmunds for sale or to rent.
| Streets | Postcodes |
|---|---|
| Abbeyfields | IP33 1AQ |
| Barn Lane | IP33 1YH |
| Barton Road | IP32 7BE IP32 7BG |
| Barwell Road | IP33 1AF |
| Boughton Way | IP33 1AG |
| Brentgovel Street | IP33 1EB |
| Cadney Lane | IP33 1JP |
| Cannon Fields | IP33 1JX |
| Cannon Street | IP33 1JR IP33 1JU |
| Chantry Court | IP33 1AY |
| Chapel Mews | IP32 7AF |
| Chapel Pond Hill | IP32 7HT |
| Church Row | IP33 1JT |
| Cotton Lane | IP33 1AZ IP33 1XP IP33 1XY IP33 1XG IP33 1XT IP33 1XW |
| Cotton Lane Flats | IP33 1XR |
| Cowpers Close | IP33 1HW |
| Cryspen Court | IP33 1EP |
| Darbys Court | IP33 1JJ |
| East Close | IP33 1UQ |
| Eastern Way | IP32 7AB IP32 7AD IP32 7AJ |
| Eastgate Street | IP33 1AP IP33 1YW IP33 1YQ IP33 1YR |
| Garland Street | IP33 1EZ IP33 1HB IP33 1FA |
| Hollow Road | IP32 7AY IP32 7AZ IP32 7AU IP32 7AP IP32 7BB IP32 7FA IP32 7QW |
| Long Row | IP33 1HZ |
| Mark Jennings Lane | IP33 1HH |
| Mercers Road | IP32 7HX |
| Minden Close | IP33 1XZ |
| Mustow Street | IP33 1XU |
| Northgate Business Park | IP33 1AE |
| Northgate Street | IP33 1JD IP33 1HR IP33 1HS IP33 1HG IP33 1HP IP33 1HQ IP33 1HU IP33 1HY |
| Orchard Street | IP33 1EH |
| Pickwick Crescent | IP33 1XS |
| Pump Lane | IP33 1HN |
| Qwysson Avenue | IP33 1AH |
| Rawlinson Crescent | IP32 7QL |
| Schoolhall Lane | IP33 1HA IP33 1ER |
| Shakers Lane | IP32 7BN |
| Short Brackland | IP33 1EL |
| Silver Way | IP32 7BZ |
| St Edmunds Mews | IP33 1AT |
| St Johns Street | IP33 1SJ |
| St Michaels Close | IP33 1HT |
| St Nicholas Close | IP32 7AX |
| St Stephens Close | IP33 1UY |
| The Broadway | IP33 1XX |
| The Daubentons | IP33 1AR |
| The Vinefields | IP33 1YD IP33 1YE IP33 1YF IP33 1YG |
| Tupman Walk | IP33 1AJ |
| Unicorn Place | IP33 1YP |
| Well Street | IP33 1EQ |
| IP33 1YA |
Transport near Eastgate
- FAQ
- Price Paid By Year
- Property Type Price
Frequently asked questions about Eastgate
What is the average price for a property for sale in Eastgate?
The average price for a property for sale in Eastgate is £277,184. This amount is 21% lower than the average price in Bury St Edmunds. There are 657 property listings for sale in Eastgate.
What streets have the most expensive properties for sale in Eastgate?
The streets with the most expensive properties for sale in Eastgate are Well Street at an average of £720,000, Northgate Street at an average of £572,481 and Tupman Walk at an average of £535,000.
What streets have the most affordable properties for sale in Eastgate?
The streets with the most affordable properties for sale in Eastgate are Cryspen Court at an average of £106,941, Chantry Court at an average of £153,200 and Eastgate Street at an average of £181,779.
Which train stations are available in or near Eastgate?
Some of the train stations available in or near Eastgate are Bury St.Edmunds, Thurston and Elmswell.
Property Price Paid in Eastgate by Year
The average sold property price by year was:
| Year | Average Sold Price | Price Change |
Sold Properties
|
|---|---|---|---|
| 2025 | £299,572 | 11% |
55 Properties |
| 2024 | £266,989 | 1% |
56 Properties |
| 2023 | £263,975 | -2% |
50 Properties |
| 2022 | £268,044 | -13% |
52 Properties |
| 2021 | £303,707 | 17% |
56 Properties |
| 2020 | £252,666 | 5% |
56 Properties |
| 2019 | £239,181 | -18% |
44 Properties |
| 2018 | £282,446 | 14% |
51 Properties |
| 2017 | £243,347 | -9% |
51 Properties |
| 2016 | £266,095 | 14% |
59 Properties |
| 2015 | £229,343 | -1% |
69 Properties |
| 2014 | £231,199 | 8% |
155 Properties |
| 2013 | £211,560 | 15% |
86 Properties |
| 2012 | £179,958 | -4% |
49 Properties |
| 2011 | £187,968 | -11% |
50 Properties |
| 2010 | £208,971 | 9% |
49 Properties |
| 2009 | £189,658 | -13% |
47 Properties |
| 2008 | £214,238 | 2% |
42 Properties |
| 2007 | £210,461 | 9% |
119 Properties |
| 2006 | £191,849 | -5% |
116 Properties |
| 2005 | £201,917 | 25% |
83 Properties |
| 2004 | £152,435 | 4% |
56 Properties |
| 2003 | £145,890 | 19% |
67 Properties |
| 2002 | £118,737 | 19% |
85 Properties |
| 2001 | £96,103 | 18% |
89 Properties |
| 2000 | £78,549 | 10% |
71 Properties |
| 1999 | £70,589 | 11% |
82 Properties |
| 1998 | £62,542 | 5% |
94 Properties |
| 1997 | £59,127 | 17% |
72 Properties |
| 1996 | £48,892 | 7% |
61 Properties |
| 1995 | £45,278 | - |
64 Properties |
Property Price per Property Type in Eastgate
Here you can find historic sold price data in order to help with your property search.
The average Property Paid Price for specific property types in the last three years are:
| Property Type | Average Sold Price | Sold Properties |
|---|---|---|
| Semi Detached House | £434,033.00 | 15 Semi Detached Houses |
| Detached House | £592,251.00 | 7 Detached Houses |
| Terraced House | £306,778.00 | 74 Terraced Houses |
| Flat | £173,366.00 | 65 Flats |

