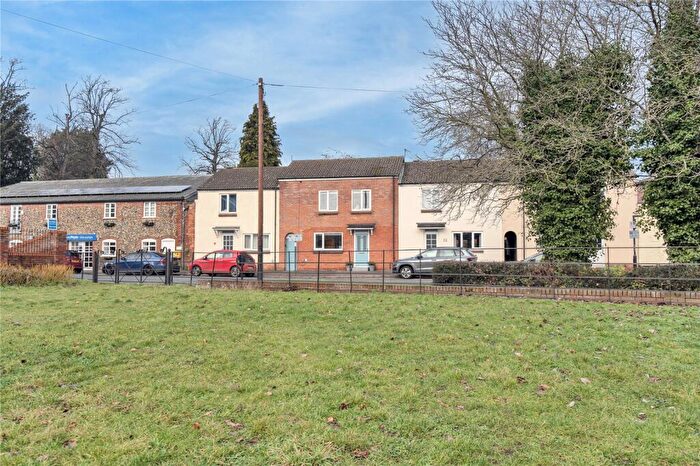
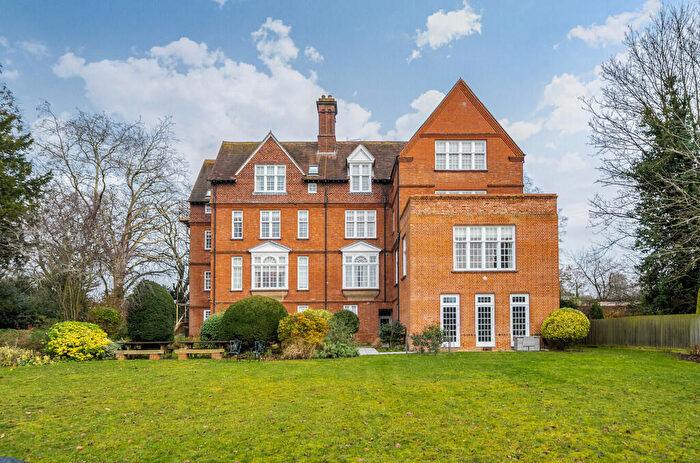
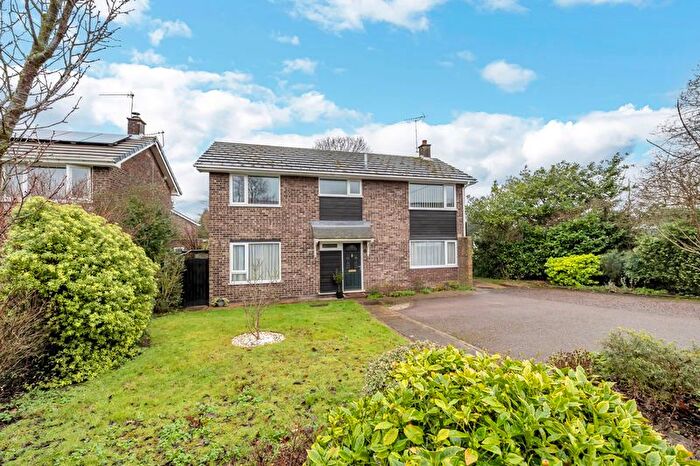
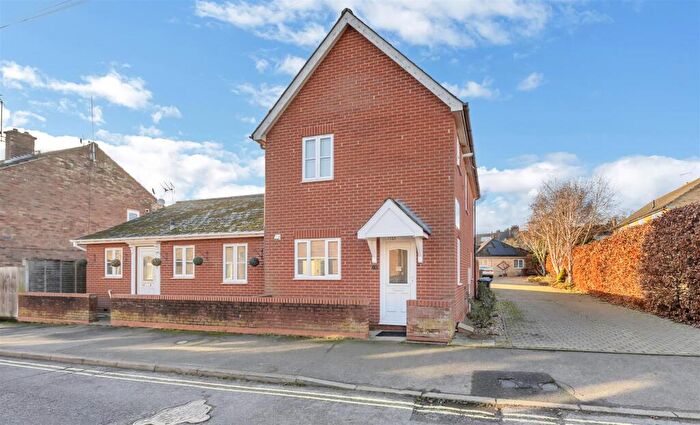
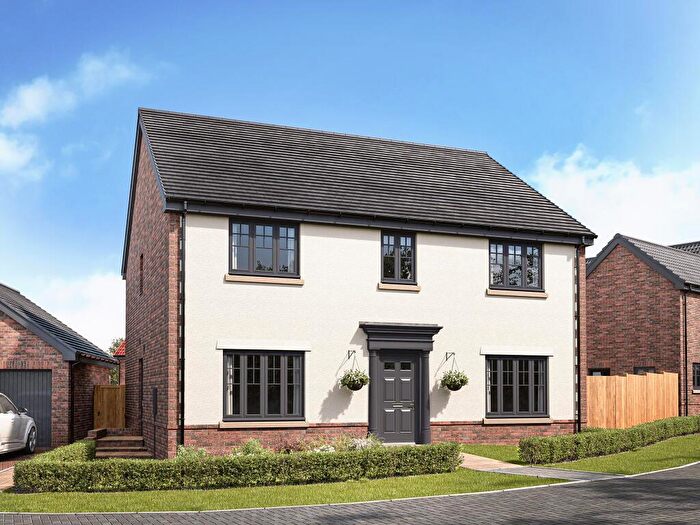
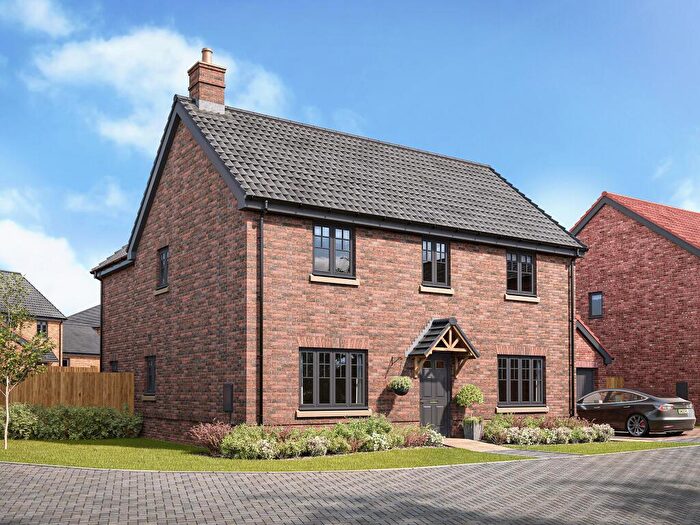
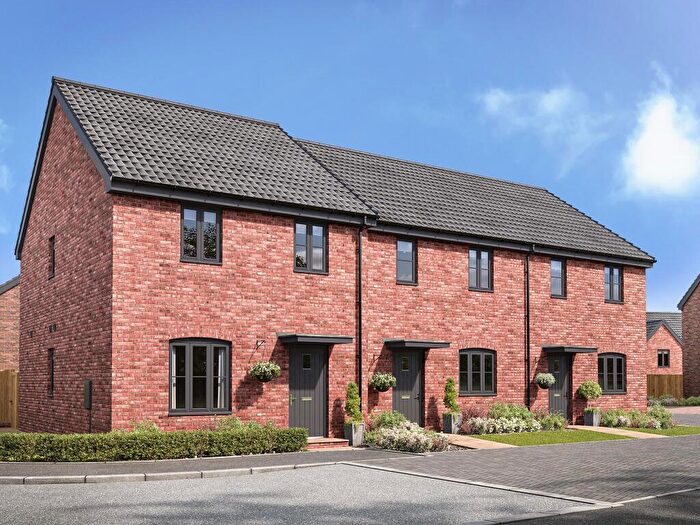
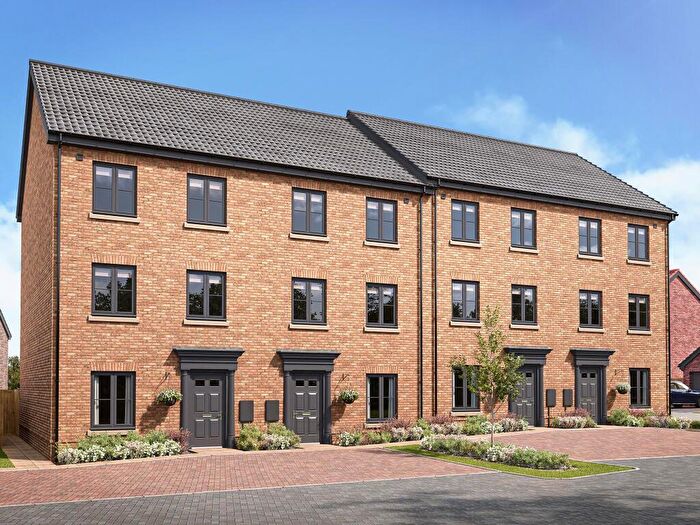
Houses for sale & to rent in Southgate, Bury St Edmunds
House Prices in Southgate
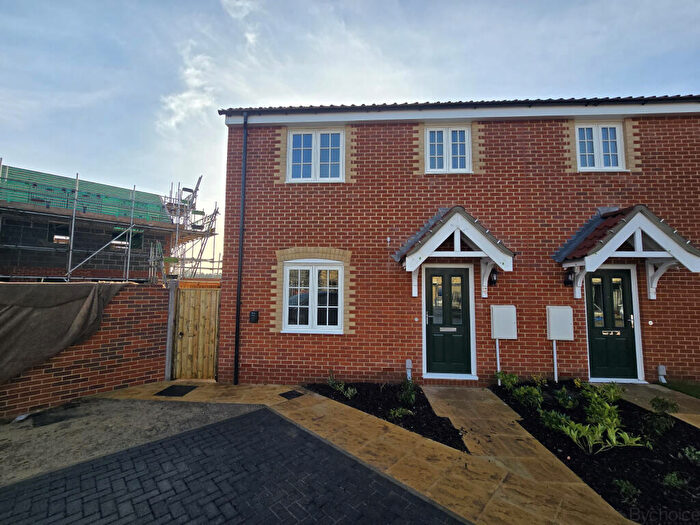
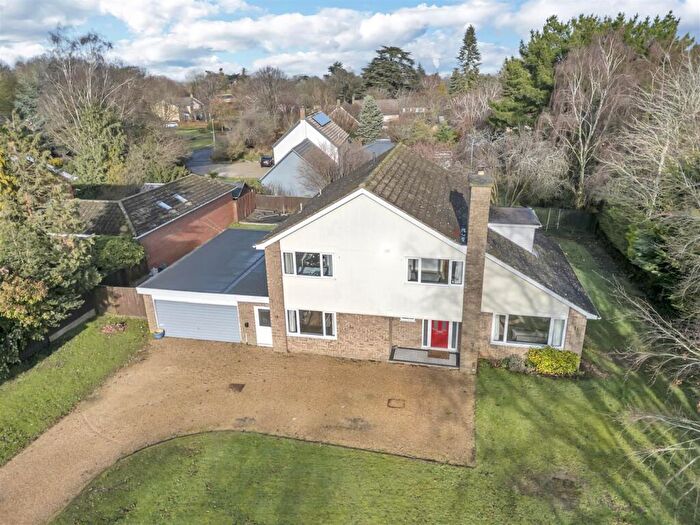
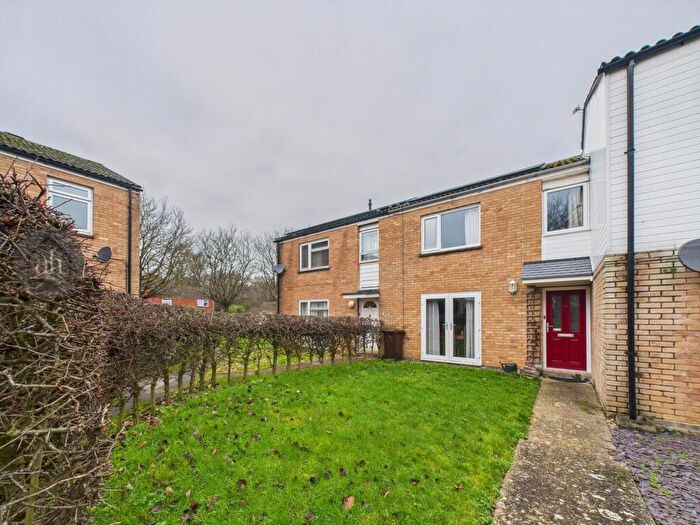
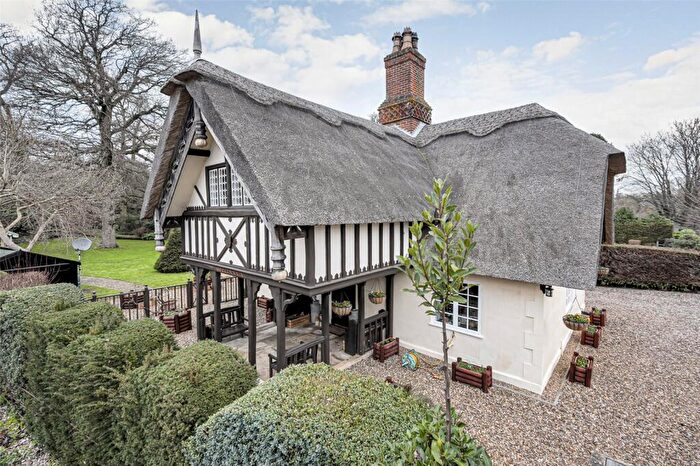
Properties in Southgate have an average house price of £365,685.00 and had 158 Property Transactions within the last 3 years¹.
Southgate is an area in Bury St Edmunds, Suffolk with 1,939 households², where the most expensive property was sold for £1,295,000.00.
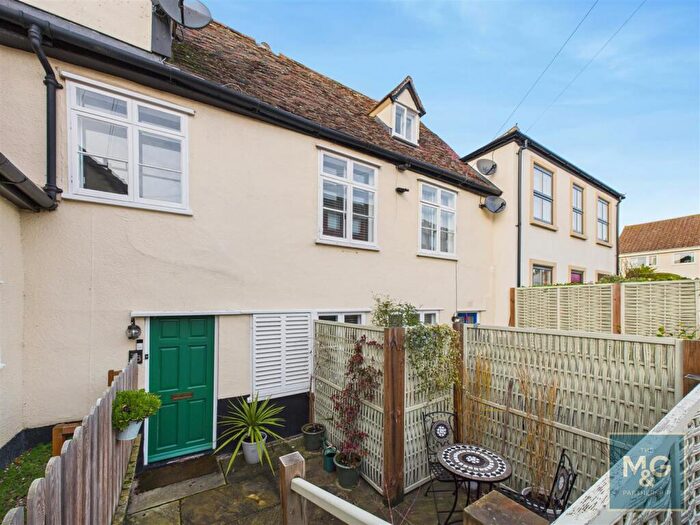
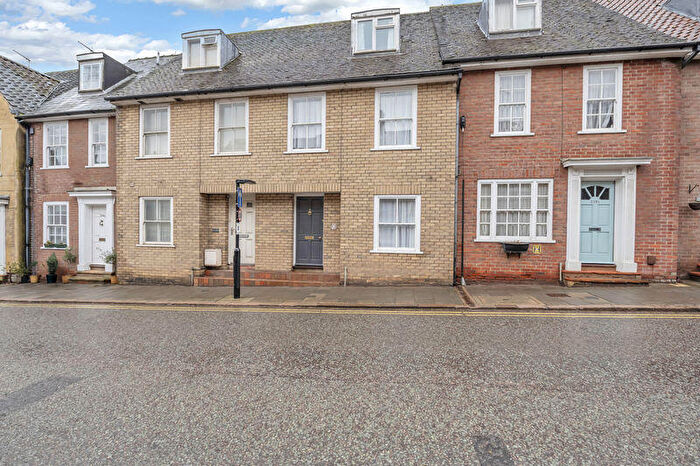
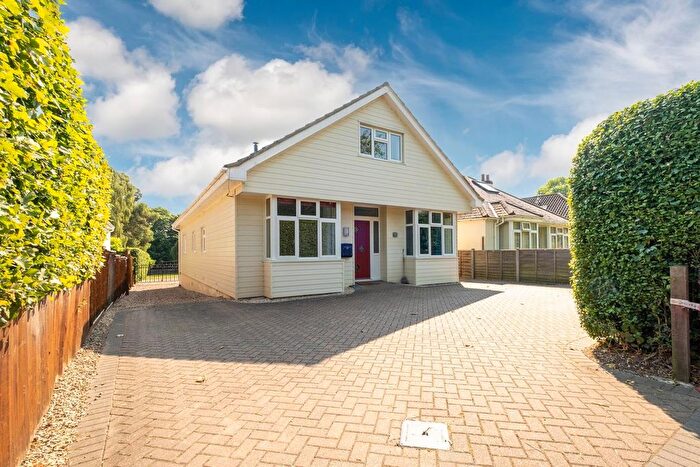
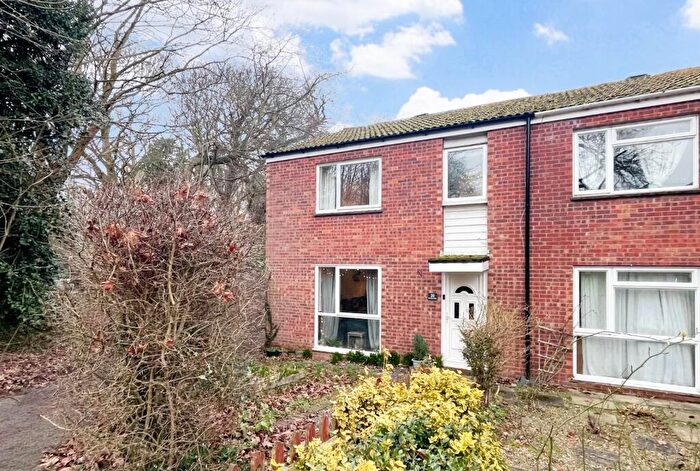
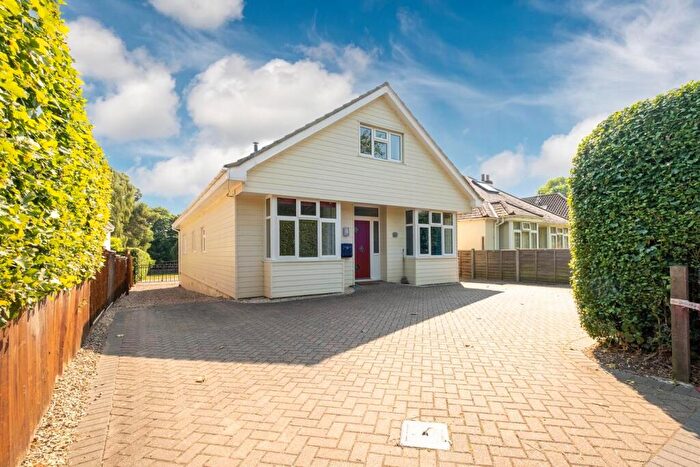
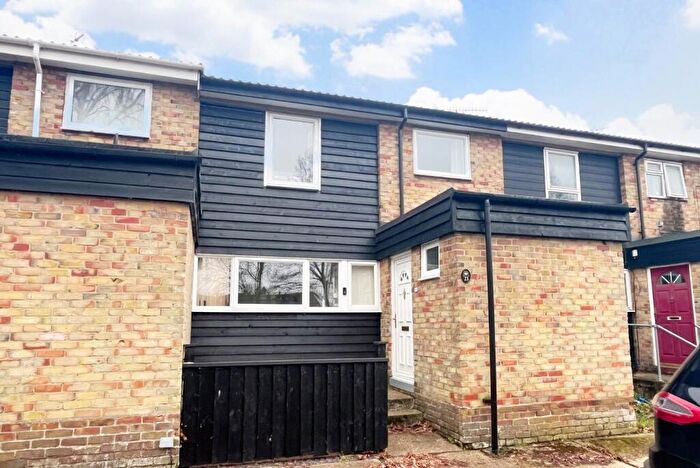
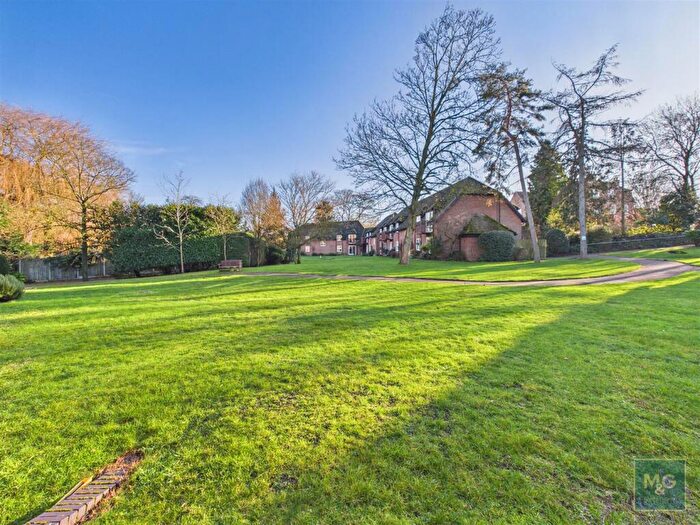
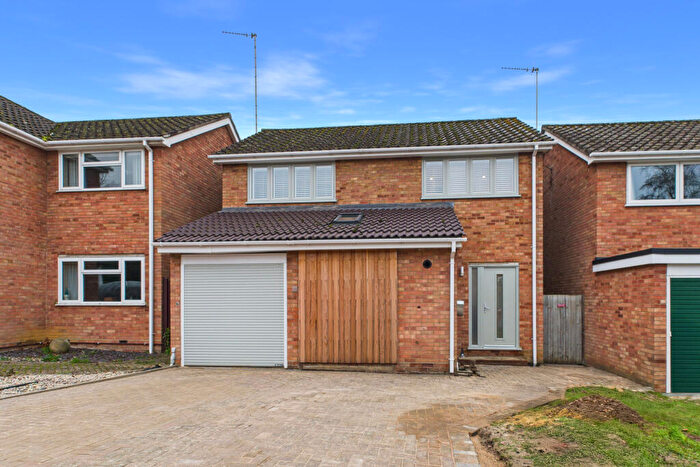
Properties for sale in Southgate
Roads and Postcodes in Southgate
Navigate through our locations to find the location of your next house in Southgate, Bury St Edmunds for sale or to rent.
| Streets | Postcodes |
|---|---|
| Abbots Gate | IP33 2FB IP33 2GB IP33 2GE IP33 2GF IP33 2GG |
| Archers Place | IP33 2FA |
| Banks Walk | IP33 2PA |
| Barons Road | IP33 2LW IP33 2LF IP33 2LY |
| Bevis Walk | IP33 2NS |
| Boon Close | IP33 2LG |
| Bright Close | IP33 2PP |
| Broadland Road | IP33 2TG |
| Bury Park Drive | IP33 2DA |
| Byfield Way | IP33 2SN |
| Caie Walk | IP33 2NY IP33 2NZ IP33 2PJ IP33 2PN IP33 2NU IP33 2PH |
| Canterbury Green | IP33 2LJ |
| Chichester Close | IP33 2LZ |
| Copse Close | IP33 2TD |
| Croft Rise | IP33 2PY |
| Ely Close | IP33 2NA |
| Faiers Close | IP33 2QA |
| Fallowfield Walk | IP33 2QS |
| Farm Close | IP33 2PZ |
| Fulcher Close | IP33 2NP |
| Governors Mews | IP33 2GA |
| Grange Walk | IP33 2QB |
| Hardwick Lane | IP33 2RA IP33 2RB IP33 2QF IP33 2QZ |
| Hardwick Park Gardens | IP33 2QU |
| Hardwick Shopping Centre | IP33 2RH |
| Haven Close | IP33 2GH |
| Hickling Drive | IP33 2PU IP33 2PX IP33 2TA IP33 2TB |
| Home Farm Lane | IP33 2QJ IP33 2QL |
| Horsecroft Road | IP29 5NZ |
| Jarman Close | IP33 2PR |
| Lincoln Green | IP33 2LL |
| Links Close | IP33 2TH |
| Macmillan Way | IP33 2QY |
| Mayfield Road | IP33 2NT IP33 2PD IP33 2PF IP33 2TJ IP33 2NR IP33 2QT IP33 2PB |
| Nowton Road | IP33 2BU IP33 2DD IP33 2NN IP33 2BT IP33 2BX IP33 2NH IP33 2PS |
| Oaklands Park | IP33 2RW |
| Olle Close | IP33 2NX |
| Pemberton Walk | IP33 2PE |
| Plovers Way | IP33 2NJ |
| Rembrandt Way | IP33 2LP IP33 2LU IP33 2LR |
| Riseway Close | IP33 2TQ |
| River Lane | IP33 2RT |
| Rougham Hill | IP33 2RU IP33 2RX |
| Rougham Road | IP33 2RN |
| Runnymede Green | IP33 2LH |
| Rushbrooke Lane | IP33 2RR IP33 2RS |
| Salisbury Green | IP33 2LN |
| Samuel Street Walk | IP33 2PQ |
| Sharp Road | IP33 2NB |
| Sicklesmere Road | IP33 2BW IP33 2BS IP33 2BN IP33 2BP |
| Smith Walk | IP33 2NW IP33 2PL |
| St Nicholas Way | IP33 2GJ IP33 2RF IP33 2RG IP33 2RJ |
| Steward Road | IP33 2PW IP33 2TN |
| Stradbroke Court | IP33 2PT |
| The Curlews | IP33 2NL |
| The Firs | IP33 2FF IP33 2SY |
| The Sewells | IP33 2QD |
| Townlane Road | IP33 2TE |
| Victory Close | IP33 2DB |
| Vinery Road | IP33 2JP |
| Watson Close | IP33 2PG |
| Whitebeam Grove | IP33 2FH |
| Woodside Close | IP33 2TF |
| IP33 2RD |
Transport near Southgate
- FAQ
- Price Paid By Year
- Property Type Price
Frequently asked questions about Southgate
What is the average price for a property for sale in Southgate?
The average price for a property for sale in Southgate is £365,685. This amount is 4% higher than the average price in Bury St Edmunds. There are 372 property listings for sale in Southgate.
What streets have the most expensive properties for sale in Southgate?
The streets with the most expensive properties for sale in Southgate are Sharp Road at an average of £775,000, Hardwick Lane at an average of £702,222 and Byfield Way at an average of £601,000.
What streets have the most affordable properties for sale in Southgate?
The streets with the most affordable properties for sale in Southgate are Vinery Road at an average of £150,000, Rougham Road at an average of £151,928 and Steward Road at an average of £183,824.
Which train stations are available in or near Southgate?
Some of the train stations available in or near Southgate are Bury St.Edmunds, Thurston and Elmswell.
Property Price Paid in Southgate by Year
The average sold property price by year was:
| Year | Average Sold Price | Price Change |
Sold Properties
|
|---|---|---|---|
| 2025 | £324,110 | -16% |
41 Properties |
| 2024 | £376,482 | -2% |
56 Properties |
| 2023 | £383,718 | -1% |
61 Properties |
| 2022 | £389,079 | 18% |
54 Properties |
| 2021 | £318,835 | 10% |
75 Properties |
| 2020 | £286,463 | -20% |
50 Properties |
| 2019 | £342,659 | 9% |
50 Properties |
| 2018 | £312,189 | 12% |
70 Properties |
| 2017 | £273,369 | 3% |
51 Properties |
| 2016 | £265,128 | -13% |
66 Properties |
| 2015 | £299,070 | 17% |
78 Properties |
| 2014 | £248,220 | 6% |
62 Properties |
| 2013 | £234,273 | 4% |
65 Properties |
| 2012 | £225,172 | -7% |
56 Properties |
| 2011 | £241,105 | 9% |
59 Properties |
| 2010 | £219,045 | 14% |
69 Properties |
| 2009 | £187,478 | -26% |
97 Properties |
| 2008 | £236,303 | 2% |
46 Properties |
| 2007 | £230,775 | -2% |
83 Properties |
| 2006 | £234,901 | 20% |
72 Properties |
| 2005 | £187,268 | -1% |
75 Properties |
| 2004 | £188,716 | 20% |
75 Properties |
| 2003 | £150,067 | - |
66 Properties |
| 2002 | £150,005 | 26% |
98 Properties |
| 2001 | £111,632 | 13% |
70 Properties |
| 2000 | £97,179 | 14% |
55 Properties |
| 1999 | £83,833 | 7% |
91 Properties |
| 1998 | £77,674 | 11% |
80 Properties |
| 1997 | £68,814 | 5% |
83 Properties |
| 1996 | £65,144 | -24% |
78 Properties |
| 1995 | £80,522 | - |
44 Properties |
Property Price per Property Type in Southgate
Here you can find historic sold price data in order to help with your property search.
The average Property Paid Price for specific property types in the last three years are:
| Property Type | Average Sold Price | Sold Properties |
|---|---|---|
| Semi Detached House | £286,971.00 | 16 Semi Detached Houses |
| Detached House | £533,389.00 | 61 Detached Houses |
| Terraced House | £285,359.00 | 60 Terraced Houses |
| Flat | £168,023.00 | 21 Flats |

