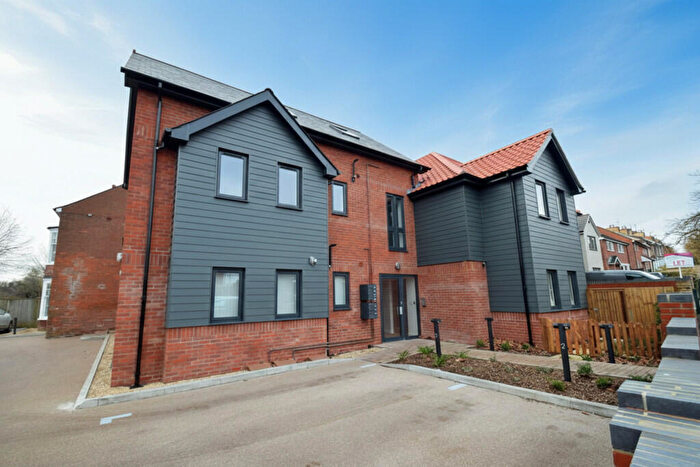
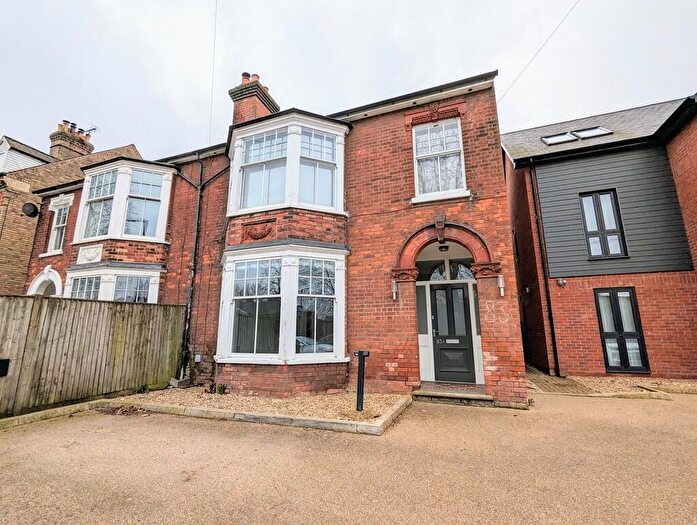
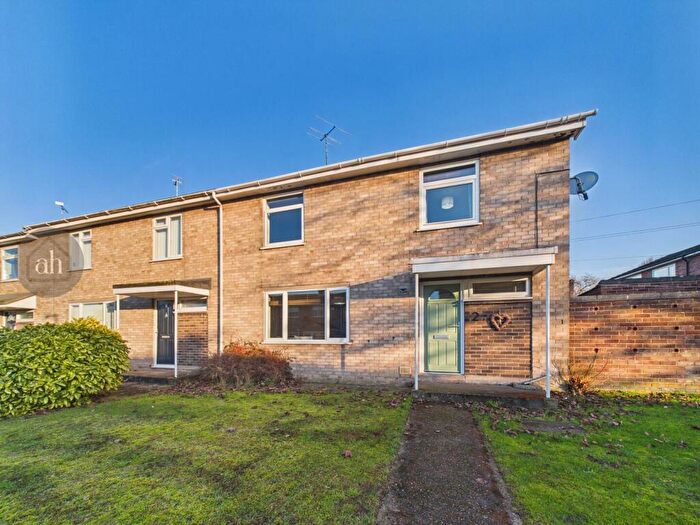
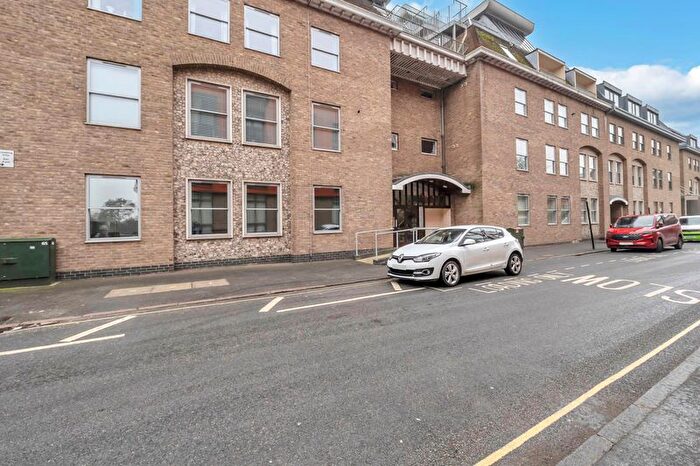
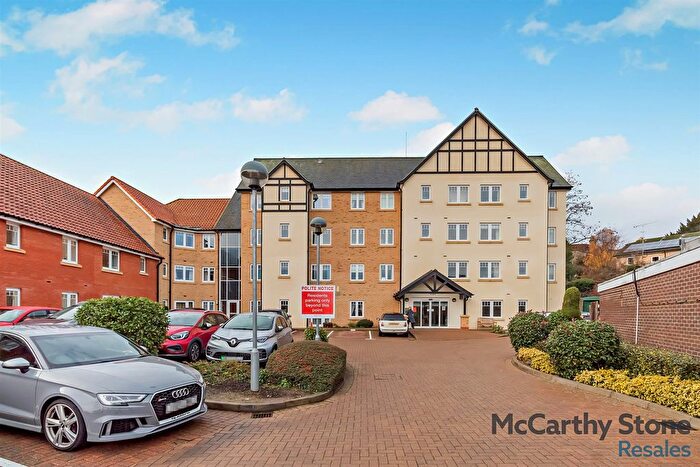
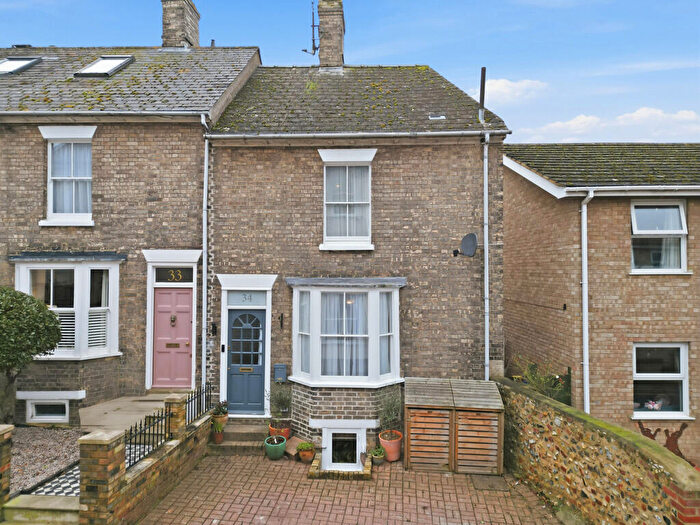
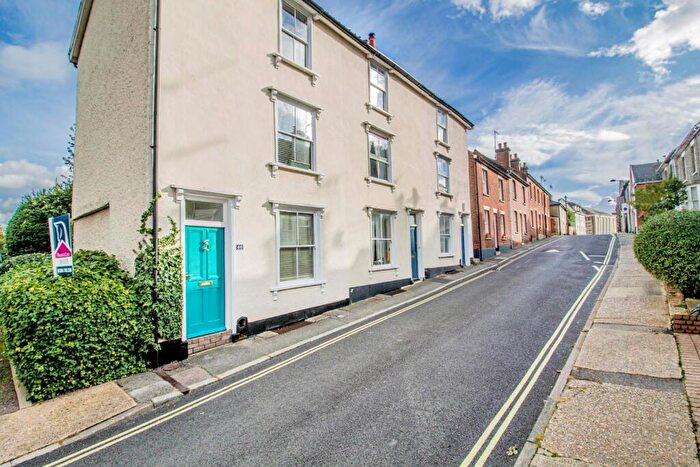
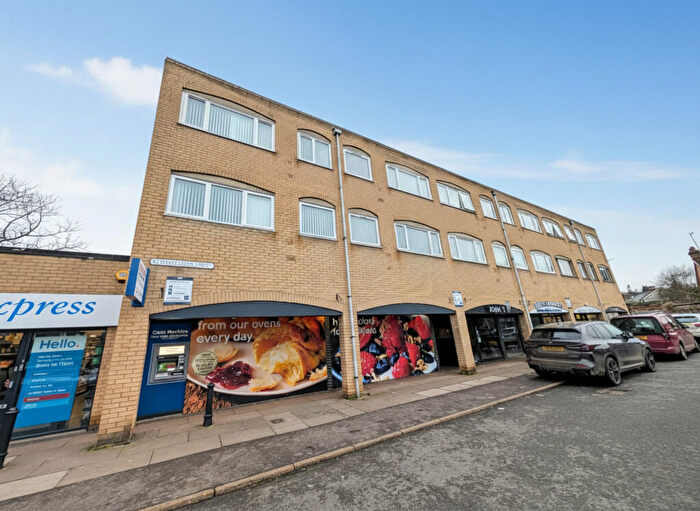
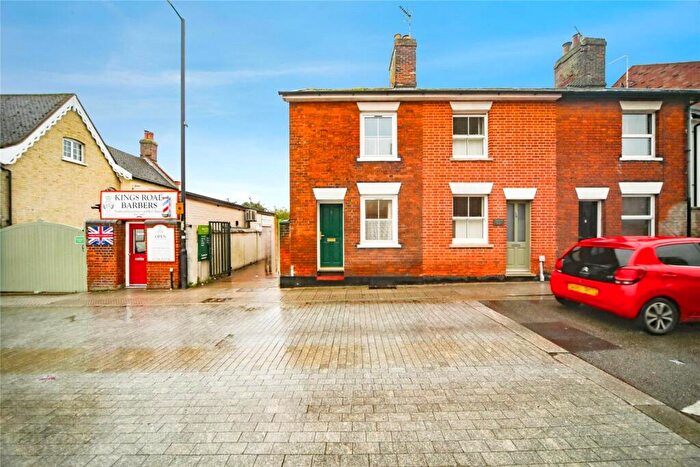
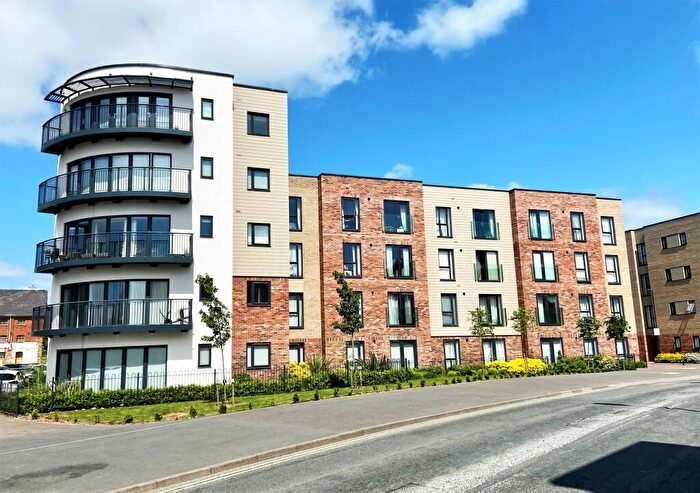
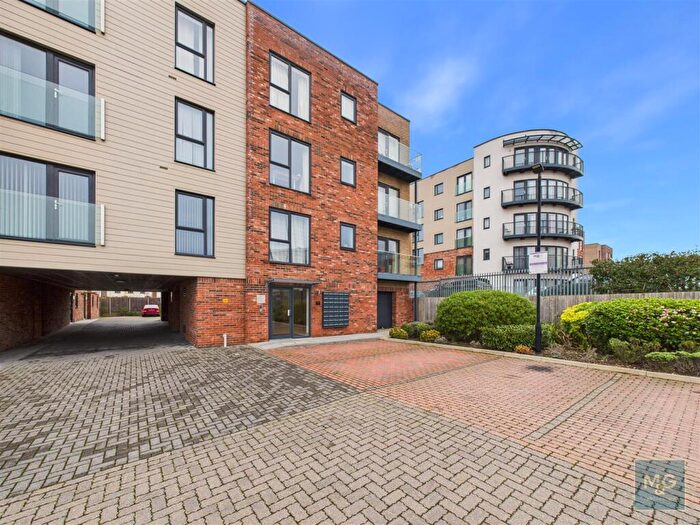
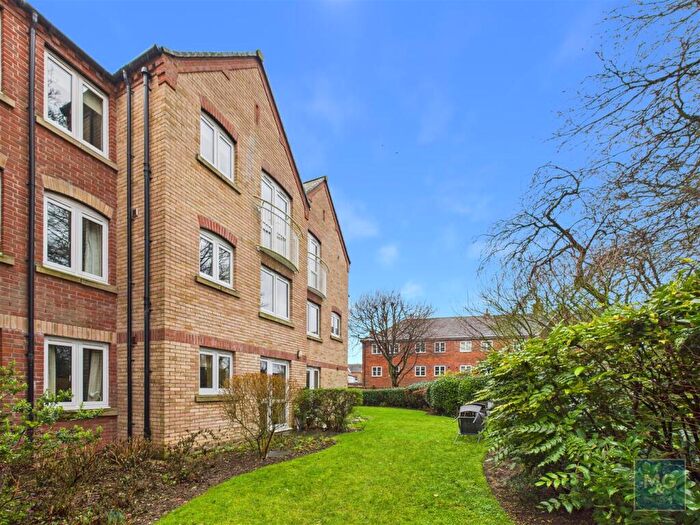
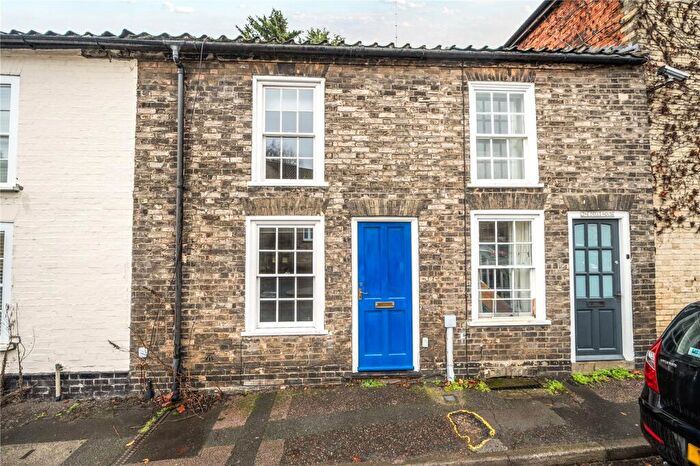
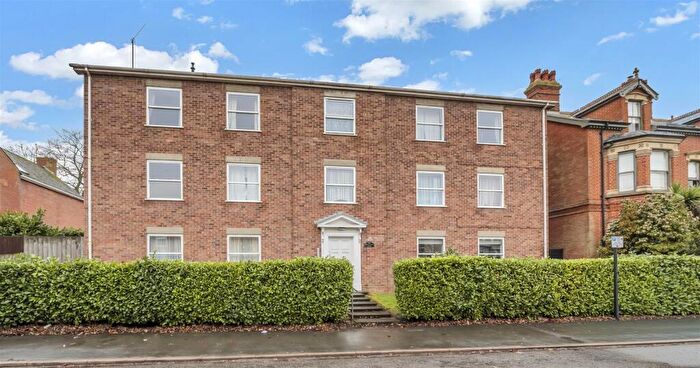
Houses for sale & to rent in Risbygate, Bury St Edmunds
House Prices in Risbygate
Properties in Risbygate have an average house price of £297,801.00 and had 280 Property Transactions within the last 3 years¹.
Risbygate is an area in Bury St Edmunds, Suffolk with 2,358 households², where the most expensive property was sold for £1,350,000.00.
Properties for sale in Risbygate
Roads and Postcodes in Risbygate
Navigate through our locations to find the location of your next house in Risbygate, Bury St Edmunds for sale or to rent.
| Streets | Postcodes |
|---|---|
| Albert Crescent | IP33 3DY |
| Albert Street | IP33 3DZ |
| Avenue Approach | IP32 6BA |
| Bell Meadow | IP32 6AU |
| Bishops Road | IP33 1TG IP33 1TQ |
| Blomfield Street | IP33 1TD IP33 1TE |
| Bulrush Crescent | IP33 3ZE |
| Cannon Street | IP33 1JN |
| Chancellery Mews | IP33 3AB |
| Cherry Tree Close | IP33 3GB |
| Cornfield Road | IP33 3BL IP33 3BN |
| Durbar Terrace | IP33 3AW |
| Etna Road | IP33 1JF |
| Fen Way | IP33 3ZA |
| Fornham Road | IP32 6AP IP32 6AW IP32 6AH IP32 6AX IP32 6AN |
| Forum Court | IP32 6AR IP32 6BD IP32 6BP |
| Foundry Terrace | IP33 1SA |
| Gage Close | IP32 6EB |
| Grove Park | IP33 3BG IP33 3BQ |
| Grove Road | IP33 3BJ IP33 3BE |
| Ipswich Court | IP33 1ST |
| Ipswich Street | IP33 1SX |
| Lathbury Court | IP33 1JY |
| Layham Drive | IP32 6BL |
| Long Brackland | IP33 1JH |
| Maltings Way | IP32 6EZ IP32 6EY |
| Marsh Way | IP33 3ZF |
| Mermaid Close | IP32 6AG |
| Myrtle Close | IP33 3ZB |
| Myrtle Mews | IP33 1JE |
| Northgate Avenue | IP32 6BB IP32 6BG |
| Northgate Lodge | IP33 1UF |
| Old Stable Yard | IP33 1SU |
| Out Northgate | IP33 1JQ |
| Out Risbygate | IP33 3RJ IP33 3RQ |
| Peckham Street | IP33 1SY |
| Petch Close | IP33 1JW |
| Prince Of Wales Close | IP33 3SH |
| Queens Close | IP33 3ER |
| Queens Road | IP33 3EP IP33 3EW IP33 3ES |
| Raes Yard | IP33 3EY |
| Ramplin Close | IP33 1GZ |
| Raynham Road | IP32 6EA IP32 6ED |
| Risbygate Street | IP33 3AQ IP33 3AA IP33 3AD IP33 3AZ |
| Sedge Way | IP33 3ZD |
| Sergeants Walk | IP33 1TP |
| Spring Lane | IP33 3AP IP33 3AU IP33 3RG |
| Springfield Avenue | IP33 3AY |
| Springfield Road | IP33 3AN IP33 3AR IP33 3AS |
| St Andrews Street North | IP33 1TH IP33 1SZ IP33 1TZ |
| St Johns Mews | IP33 1AL |
| St Johns Place | IP33 1SW |
| St Johns Street | IP33 1SN IP33 1SP IP33 1SQ |
| St Martins Street | IP33 1JL |
| Station Hill | IP32 6AD |
| Stephensons Place | IP32 6BF |
| Tayfen Road | IP32 6BH IP33 1UE |
| Tayfen Terrace | IP32 6BJ |
| The Beeches | IP33 3RD |
| The Mews | IP33 3FN |
| Thingoe Hill | IP32 6BE IP32 6BQ |
| Trinity Mews | IP33 3AT |
| West Road | IP33 3EH IP33 3EL |
| Willow Way | IP33 3ZG |
| York Close | IP33 3EF |
| York Road | IP33 3EG IP33 3EB IP33 3EE IP33 3EQ |
| York Terrace | IP33 3ED |
Transport near Risbygate
- FAQ
- Price Paid By Year
- Property Type Price
Frequently asked questions about Risbygate
What is the average price for a property for sale in Risbygate?
The average price for a property for sale in Risbygate is £297,801. This amount is 15% lower than the average price in Bury St Edmunds. There are 939 property listings for sale in Risbygate.
What streets have the most expensive properties for sale in Risbygate?
The streets with the most expensive properties for sale in Risbygate are Queens Close at an average of £825,000, Grove Road at an average of £659,625 and Northgate Avenue at an average of £610,000.
What streets have the most affordable properties for sale in Risbygate?
The streets with the most affordable properties for sale in Risbygate are Tayfen Road at an average of £120,000, The Beeches at an average of £138,050 and Prince Of Wales Close at an average of £140,250.
Which train stations are available in or near Risbygate?
Some of the train stations available in or near Risbygate are Bury St.Edmunds, Thurston and Elmswell.
Property Price Paid in Risbygate by Year
The average sold property price by year was:
| Year | Average Sold Price | Price Change |
Sold Properties
|
|---|---|---|---|
| 2025 | £291,000 | 4% |
92 Properties |
| 2024 | £279,965 | -16% |
101 Properties |
| 2023 | £325,700 | 11% |
87 Properties |
| 2022 | £288,382 | 0,3% |
104 Properties |
| 2021 | £287,657 | 12% |
134 Properties |
| 2020 | £254,222 | -16% |
78 Properties |
| 2019 | £294,789 | 4% |
73 Properties |
| 2018 | £282,362 | 5% |
98 Properties |
| 2017 | £267,873 | 13% |
104 Properties |
| 2016 | £231,958 | -2% |
131 Properties |
| 2015 | £237,440 | 10% |
118 Properties |
| 2014 | £214,802 | 1% |
115 Properties |
| 2013 | £211,872 | 4% |
95 Properties |
| 2012 | £203,822 | 3% |
115 Properties |
| 2011 | £197,339 | 5% |
90 Properties |
| 2010 | £188,325 | 9% |
92 Properties |
| 2009 | £171,270 | -0,1% |
122 Properties |
| 2008 | £171,363 | -9% |
152 Properties |
| 2007 | £186,521 | -7% |
187 Properties |
| 2006 | £198,698 | 13% |
166 Properties |
| 2005 | £173,704 | -0,4% |
123 Properties |
| 2004 | £174,441 | 13% |
138 Properties |
| 2003 | £152,365 | 16% |
211 Properties |
| 2002 | £128,489 | 24% |
217 Properties |
| 2001 | £98,208 | 7% |
183 Properties |
| 2000 | £91,619 | 21% |
114 Properties |
| 1999 | £72,254 | -21% |
113 Properties |
| 1998 | £87,501 | 34% |
118 Properties |
| 1997 | £57,934 | 14% |
119 Properties |
| 1996 | £49,957 | -10% |
127 Properties |
| 1995 | £54,932 | - |
90 Properties |
Property Price per Property Type in Risbygate
Here you can find historic sold price data in order to help with your property search.
The average Property Paid Price for specific property types in the last three years are:
| Property Type | Average Sold Price | Sold Properties |
|---|---|---|
| Semi Detached House | £367,919.00 | 46 Semi Detached Houses |
| Detached House | £573,063.00 | 23 Detached Houses |
| Terraced House | £314,837.00 | 125 Terraced Houses |
| Flat | £161,918.00 | 86 Flats |

