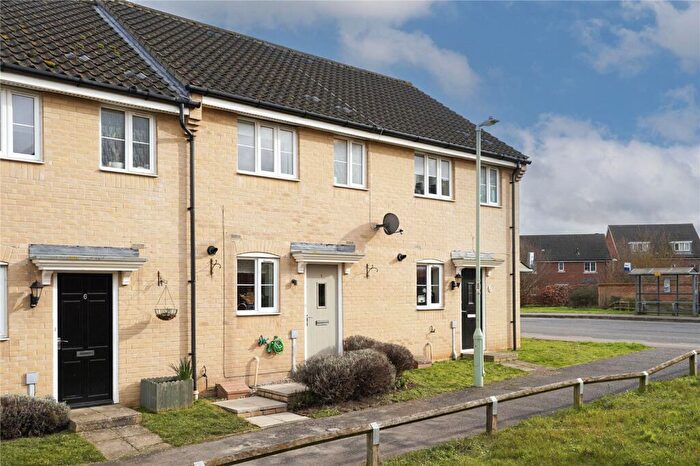
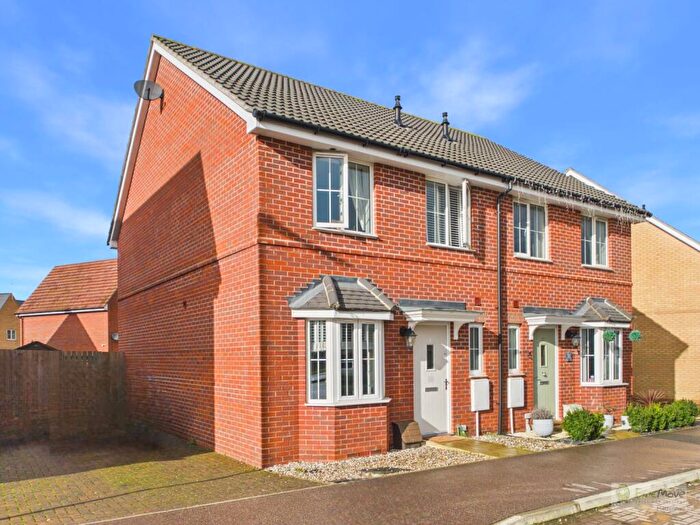
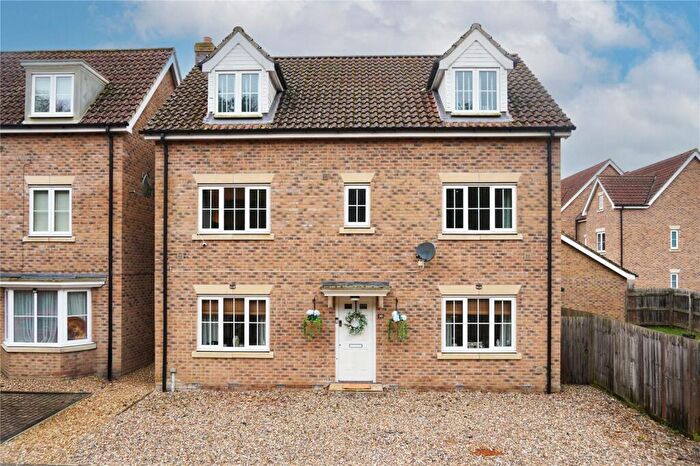
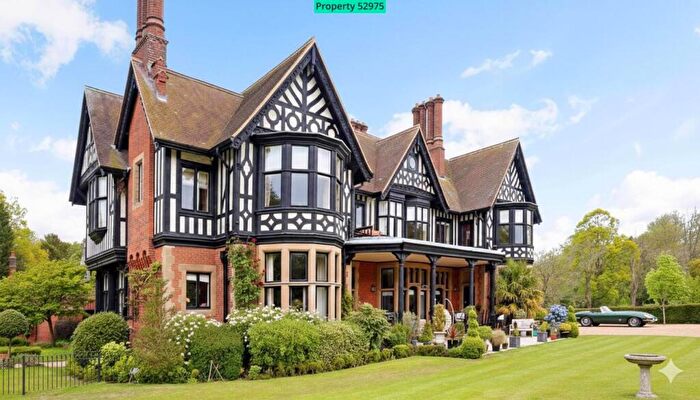
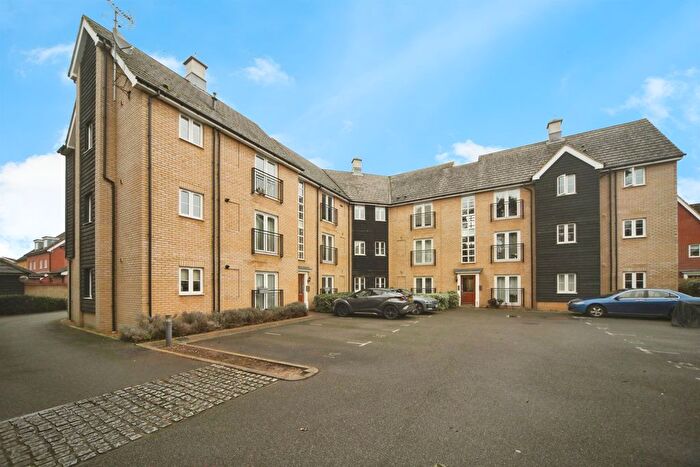
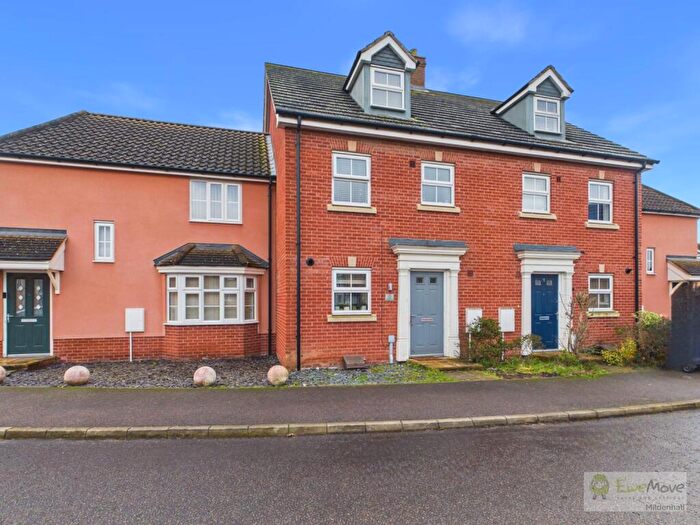
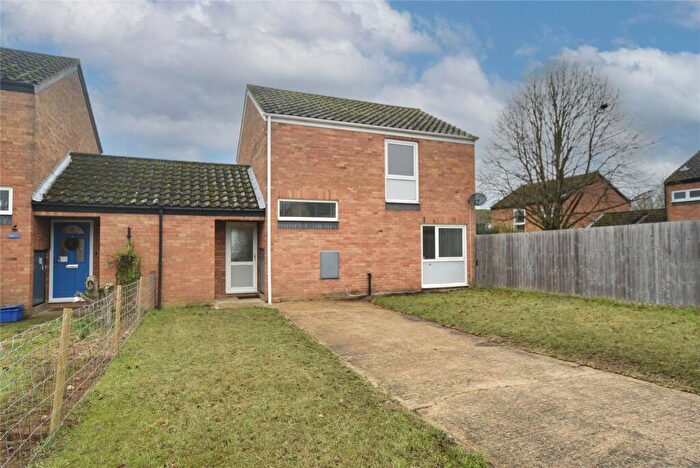
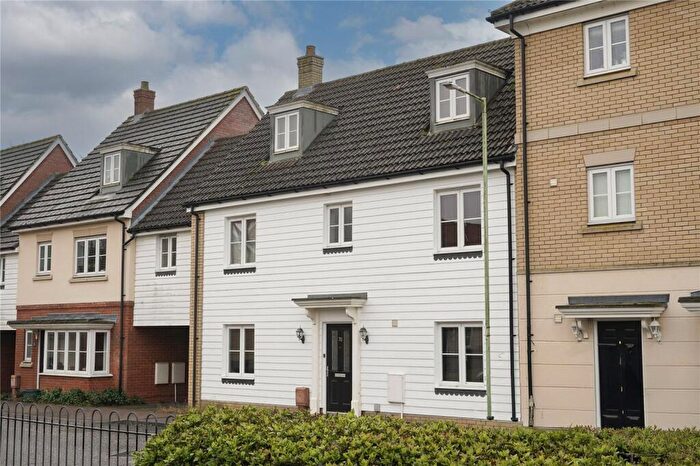
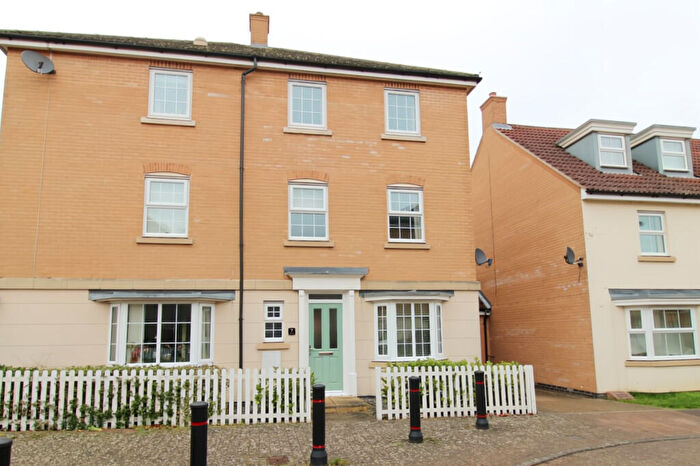
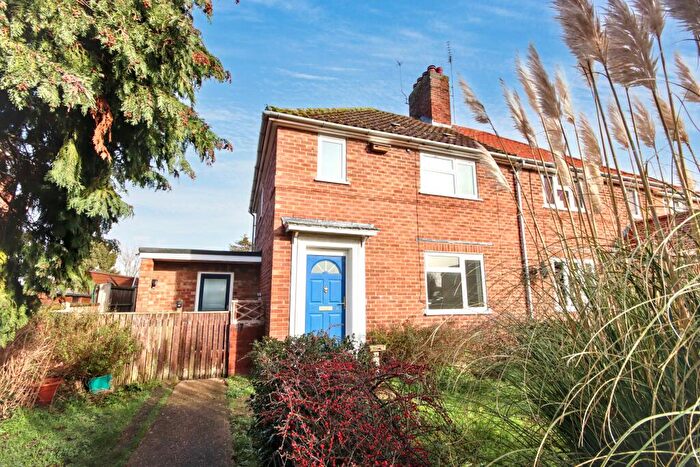
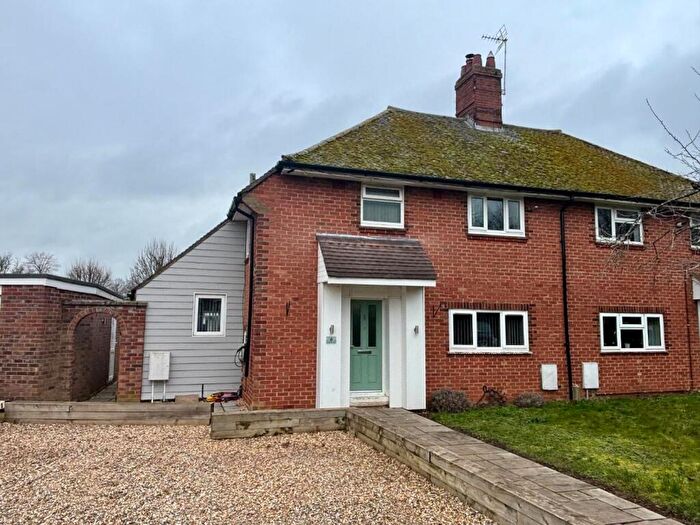
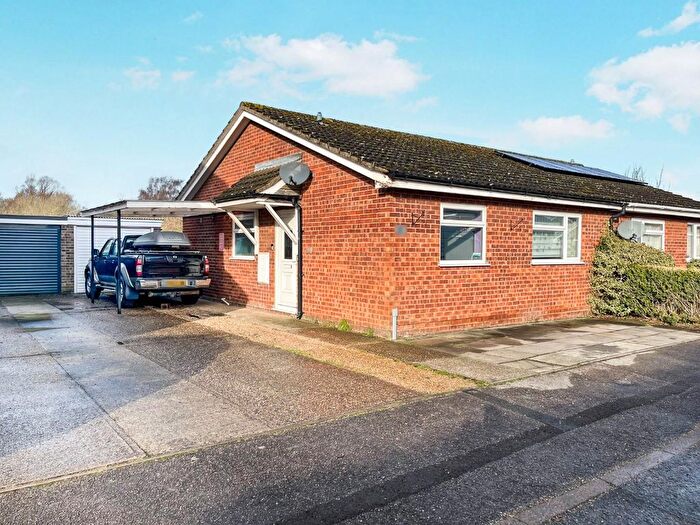
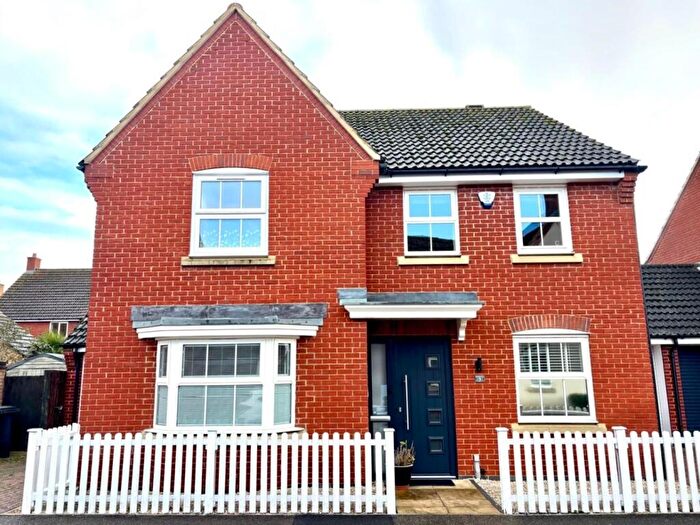
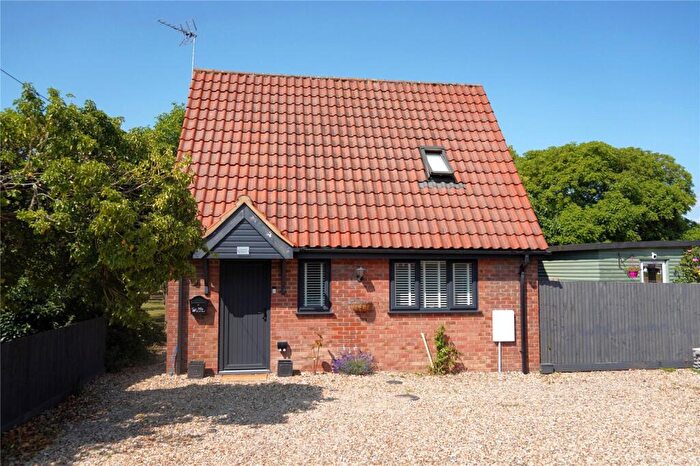
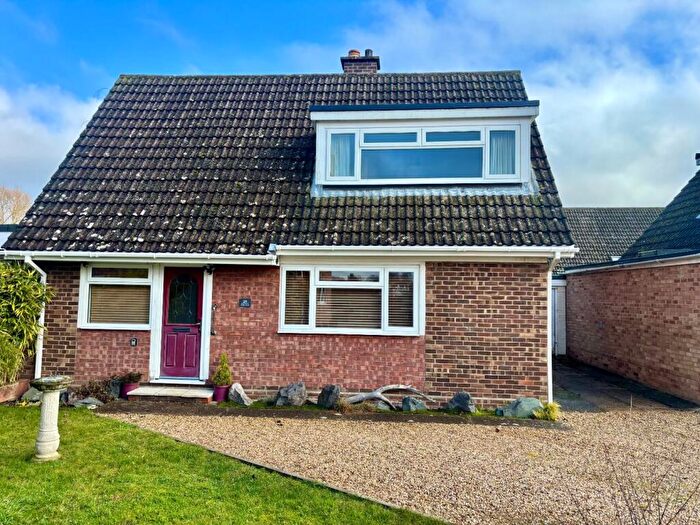
Houses for sale & to rent in Iceni, Bury St Edmunds
House Prices in Iceni
Properties in Iceni have an average house price of £353,424.00 and had 81 Property Transactions within the last 3 years¹.
Iceni is an area in Bury St Edmunds, Suffolk with 464 households², where the most expensive property was sold for £1,350,000.00.
Properties for sale in Iceni
Roads and Postcodes in Iceni
Navigate through our locations to find the location of your next house in Iceni, Bury St Edmunds for sale or to rent.
| Streets | Postcodes |
|---|---|
| Acacia Close | IP28 8WT |
| Ash Court | IP28 8GW |
| Bakers Way | IP28 6SL |
| Bellflower Crescent | IP28 8XQ IP28 8YT |
| Bluebell Rise | IP28 8TU |
| Buckthorn Way | IP28 8ZL |
| Burdock Road | IP28 8YU |
| Cavenham Road | IP28 6SE |
| Cedar Close | IP28 8ZN |
| Chapel Lane | IP28 6SP |
| Chase Avenue | IP28 1AB |
| Daffodil Way | IP28 8YW |
| Dandelion Crescent | IP28 8YX |
| Eagle Close | IP28 1AF |
| Elms Road | IP28 8TD |
| Falconer Road | IP28 1AE |
| Gillyflower Way | IP28 8YZ |
| Green Lane | IP28 8ZB |
| High Street | IP28 6SQ IP28 6SA |
| Higham Road | IP28 6SG |
| Hundred Acre Way | IP28 8XR |
| Hyacinth Drive | IP28 8YY |
| Keepers Close | IP28 8XD |
| Kendall Court | IP28 6SB |
| Larchwood Road | IP28 8ZT |
| Lily Close | IP28 8WR |
| Linden Drive | IP28 8SZ |
| Lower Green | IP28 6NL IP28 6NJ |
| Mandrake Drive | IP28 8ZE |
| Mendham Court | IP28 6SF |
| Middle Green | IP28 6NY |
| Mulberry Green | IP28 8WN |
| Myrtle Lane | IP28 8RW |
| Oaklands Drive | IP28 8ZX |
| Peppermint Walk | IP28 8JY |
| Periwinkle Walk | IP28 8ZG |
| Primrose Drive | IP28 8ZQ |
| Reed Lane | IP28 8ZA |
| Temple Close | IP28 6QD |
| The Farthings | IP28 6PE |
| The Green | IP28 6SD |
| The Hall Close | IP28 6PU |
| The Mulberries | IP28 8ZU |
| The Street | IP28 6PL IP28 6PS IP28 6SX IP28 6DA |
| The Vines | IP28 8RT |
| Thornapple View | IP28 8WF |
| Tuddenham Road | IP28 6SN |
| Upper Green | IP28 6PA |
| Warren Road | IP28 8JX |
| Weather Hill Farm Cottages | IP28 6PP |
| West Street | IP28 6QB |
| White Mullein Drive | IP28 8XP |
| Willoway Park | IP28 8LA |
| Willowfield Close | IP28 8ZR |
| IP28 6DB IP28 6DF IP28 6NZ IP28 6NH IP28 6PH IP28 6SR IP28 6SU IP28 6SW IP28 8WG IP28 6FA |
Transport near Iceni
- FAQ
- Price Paid By Year
- Property Type Price
Frequently asked questions about Iceni
What is the average price for a property for sale in Iceni?
The average price for a property for sale in Iceni is £353,424. This amount is 0.78% higher than the average price in Bury St Edmunds. There are 1,680 property listings for sale in Iceni.
What streets have the most expensive properties for sale in Iceni?
The streets with the most expensive properties for sale in Iceni are Upper Green at an average of £997,500, Lower Green at an average of £698,000 and Higham Road at an average of £675,000.
What streets have the most affordable properties for sale in Iceni?
The streets with the most affordable properties for sale in Iceni are Myrtle Lane at an average of £137,937, Willowfield Close at an average of £158,916 and The Hall Close at an average of £210,000.
Which train stations are available in or near Iceni?
Some of the train stations available in or near Iceni are Kennett, Newmarket and Bury St.Edmunds.
Property Price Paid in Iceni by Year
The average sold property price by year was:
| Year | Average Sold Price | Price Change |
Sold Properties
|
|---|---|---|---|
| 2025 | £387,995 | 10% |
25 Properties |
| 2024 | £350,192 | 7% |
26 Properties |
| 2023 | £327,416 | -6% |
30 Properties |
| 2022 | £348,504 | 10% |
26 Properties |
| 2021 | £313,495 | -4% |
54 Properties |
| 2020 | £326,250 | 14% |
33 Properties |
| 2019 | £281,982 | -13% |
66 Properties |
| 2018 | £319,065 | 10% |
73 Properties |
| 2017 | £286,782 | -7% |
69 Properties |
| 2016 | £306,291 | 6% |
17 Properties |
| 2015 | £288,846 | 6% |
38 Properties |
| 2014 | £271,443 | 6% |
39 Properties |
| 2013 | £255,600 | -11% |
12 Properties |
| 2012 | £283,892 | 11% |
14 Properties |
| 2011 | £253,307 | -36% |
13 Properties |
| 2010 | £345,000 | 41% |
10 Properties |
| 2009 | £205,110 | -26% |
9 Properties |
| 2008 | £259,388 | 20% |
9 Properties |
| 2007 | £207,178 | -30% |
22 Properties |
| 2006 | £269,309 | -15% |
16 Properties |
| 2005 | £308,650 | 43% |
10 Properties |
| 2004 | £175,849 | 13% |
11 Properties |
| 2003 | £152,483 | -12% |
9 Properties |
| 2002 | £170,317 | 3% |
17 Properties |
| 2001 | £164,373 | -6% |
17 Properties |
| 2000 | £175,007 | 34% |
13 Properties |
| 1999 | £116,062 | -9% |
16 Properties |
| 1998 | £126,281 | -10% |
16 Properties |
| 1997 | £138,412 | 44% |
12 Properties |
| 1996 | £77,800 | 6% |
5 Properties |
| 1995 | £73,350 | - |
11 Properties |
Property Price per Property Type in Iceni
Here you can find historic sold price data in order to help with your property search.
The average Property Paid Price for specific property types in the last three years are:
| Property Type | Average Sold Price | Sold Properties |
|---|---|---|
| Semi Detached House | £260,310.00 | 33 Semi Detached Houses |
| Detached House | £451,400.00 | 40 Detached Houses |
| Terraced House | £248,571.00 | 7 Terraced Houses |
| Flat | £241,125.00 | 1 Flat |

