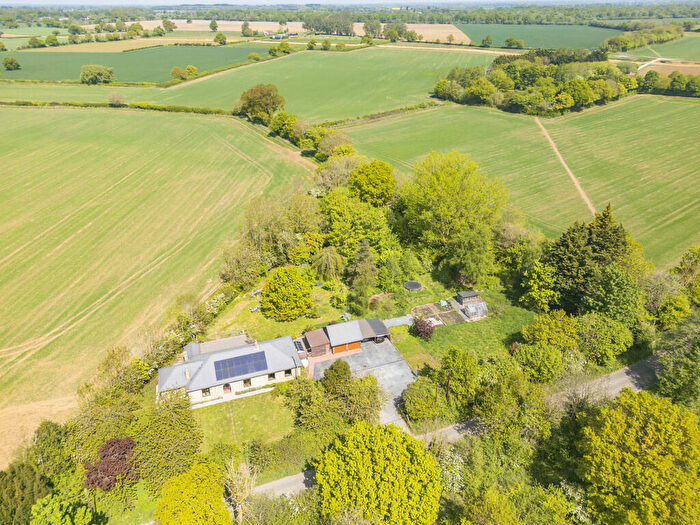
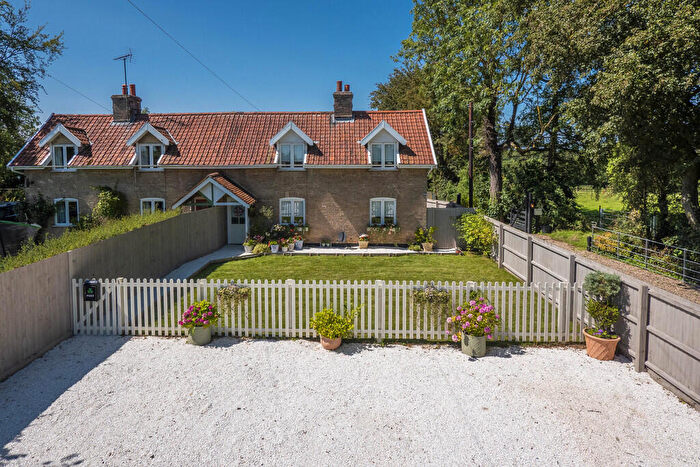
Houses for sale & to rent in North Cosford, Bury St Edmunds
House Prices in North Cosford
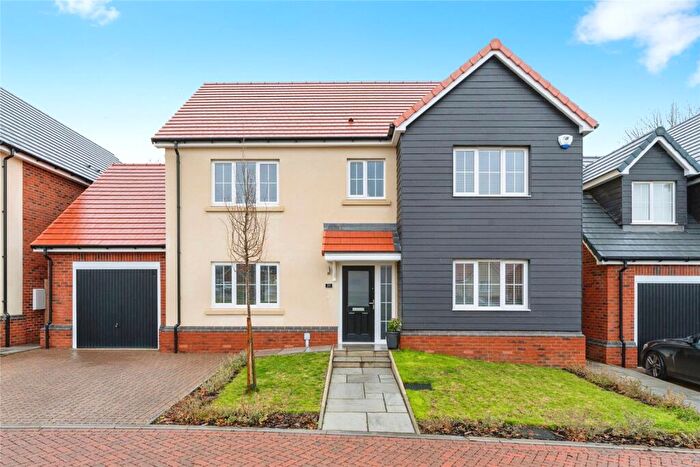
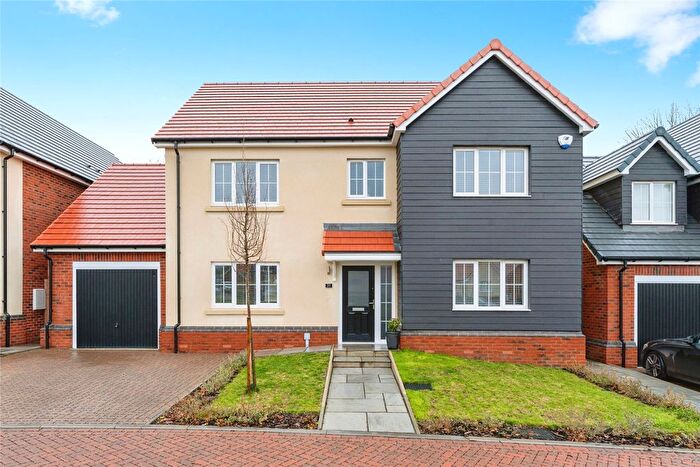
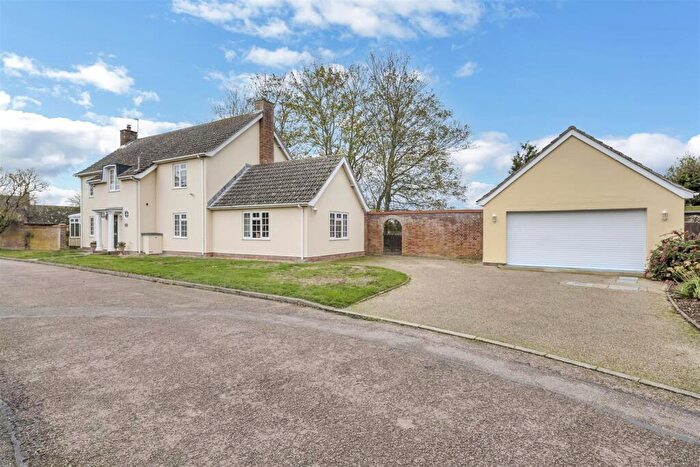
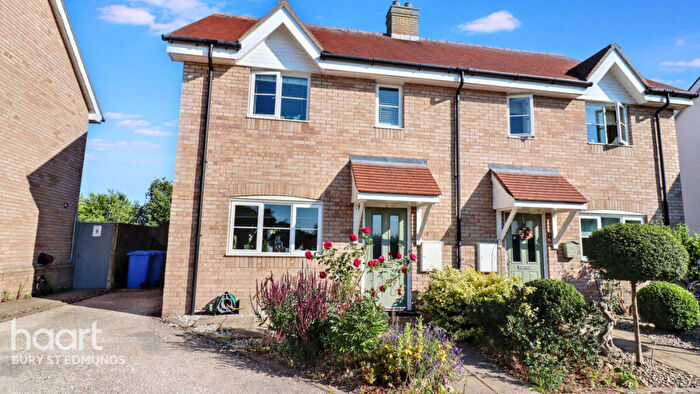
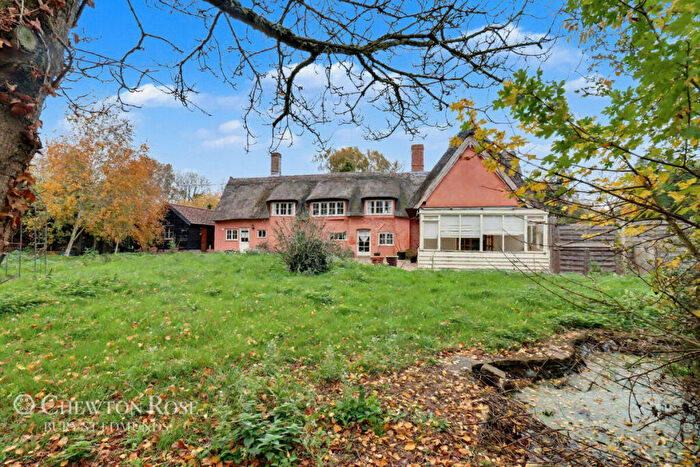
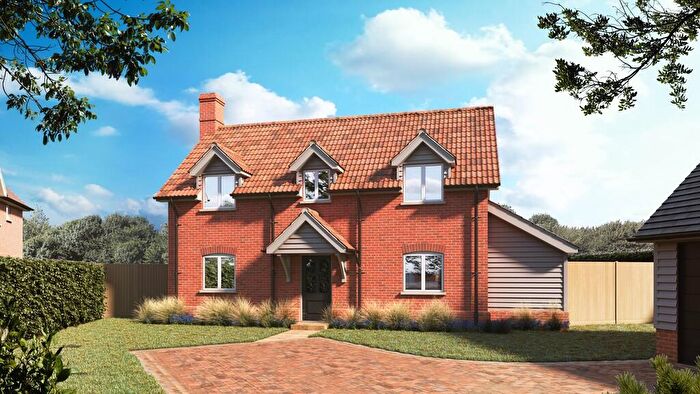
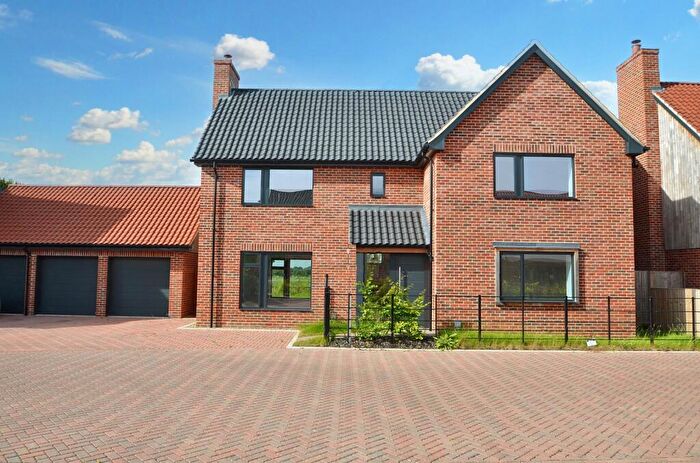
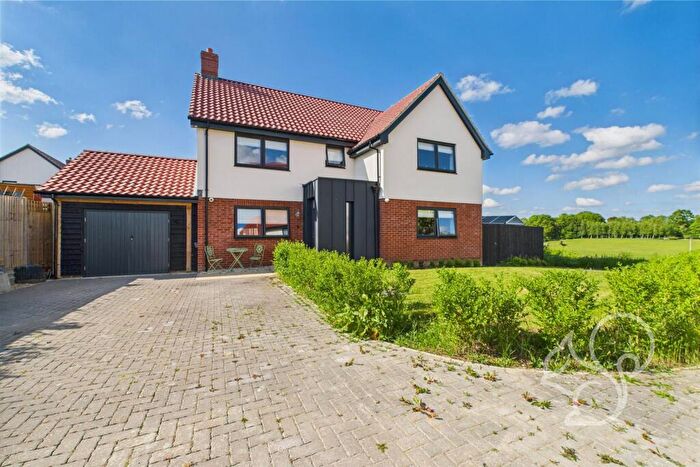
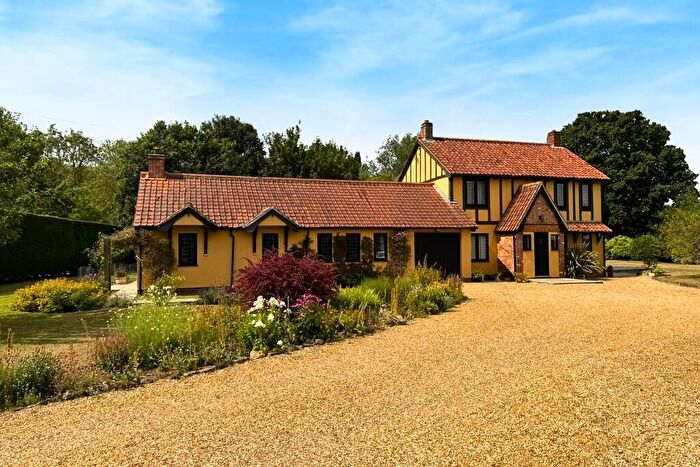
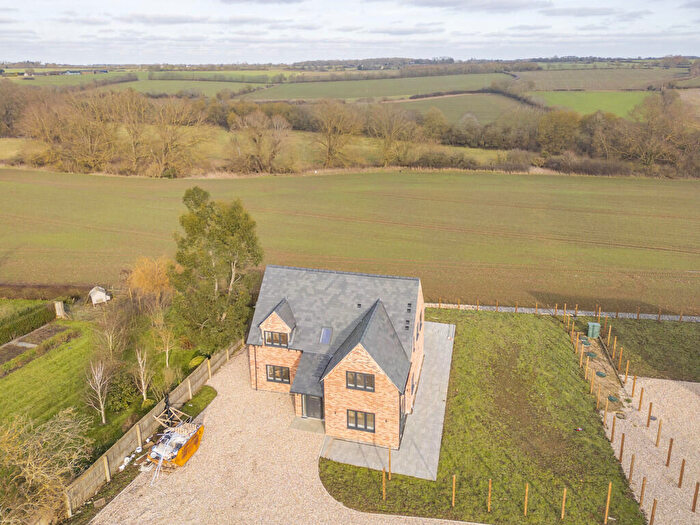
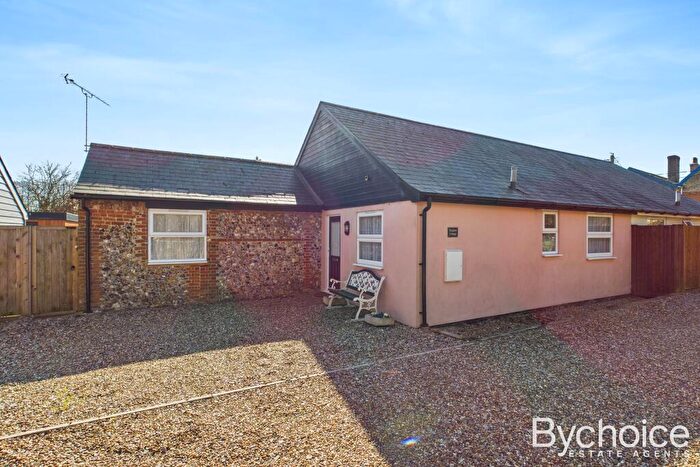
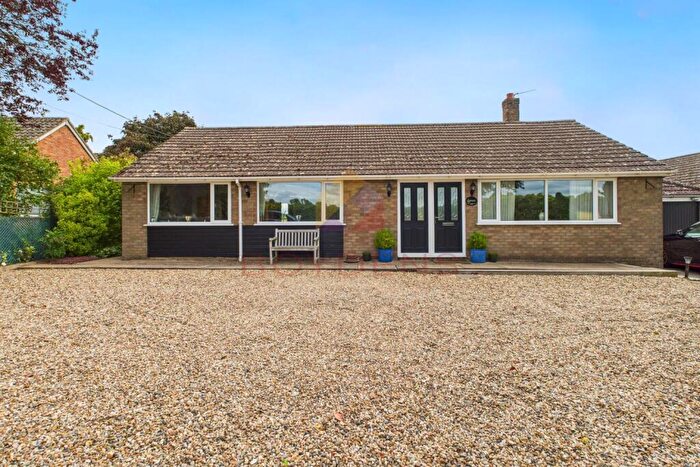
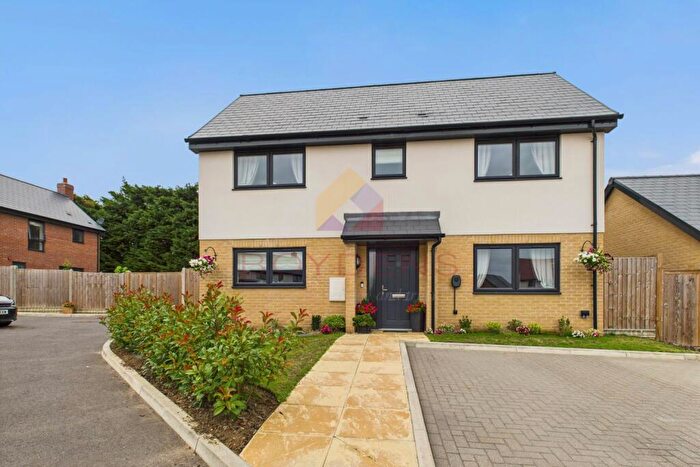
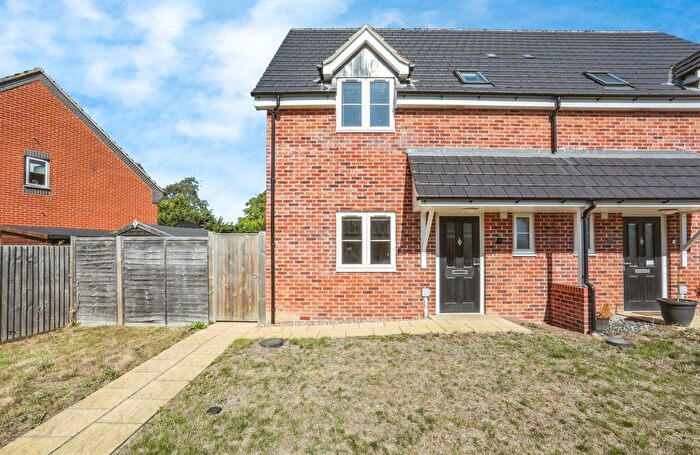
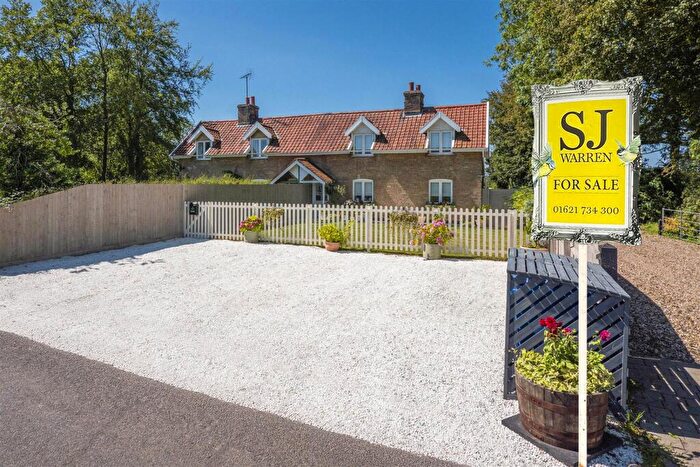
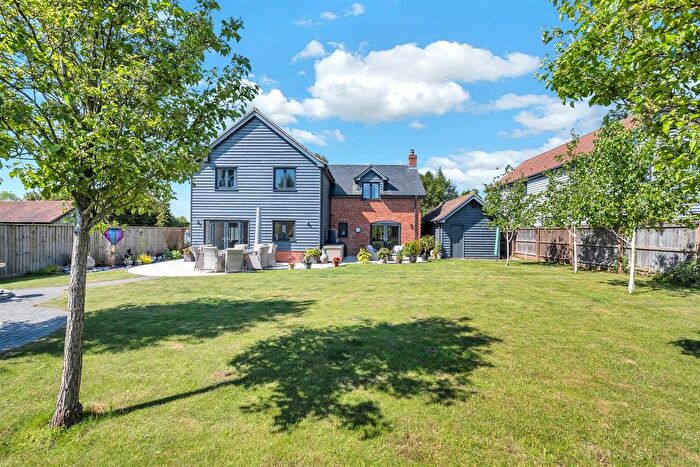
Properties in North Cosford have an average house price of £488,477.00 and had 54 Property Transactions within the last 3 years¹.
North Cosford is an area in Bury St Edmunds, Suffolk with 422 households², where the most expensive property was sold for £1,500,000.00.
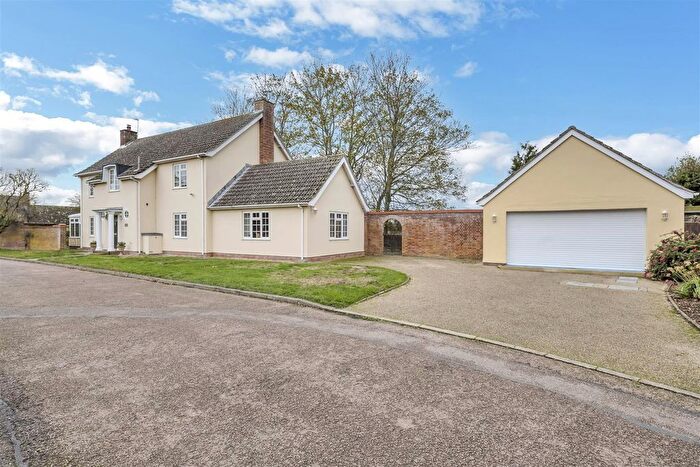
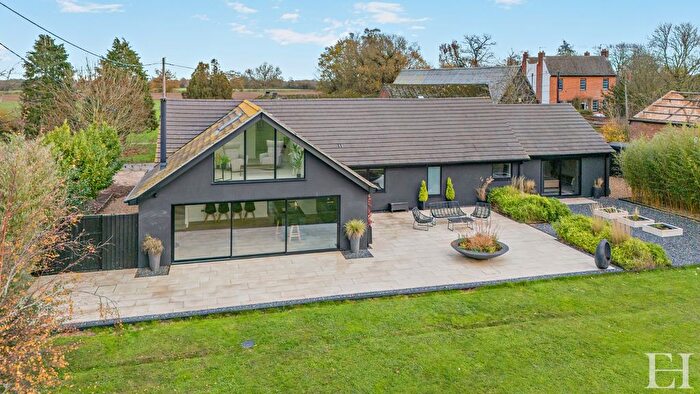
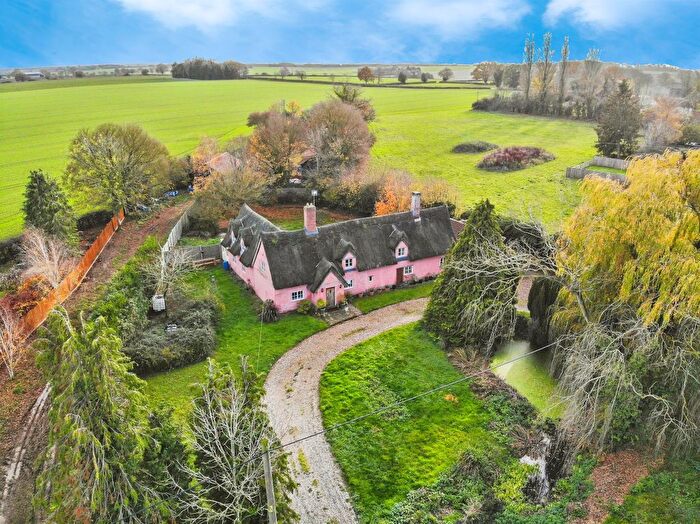
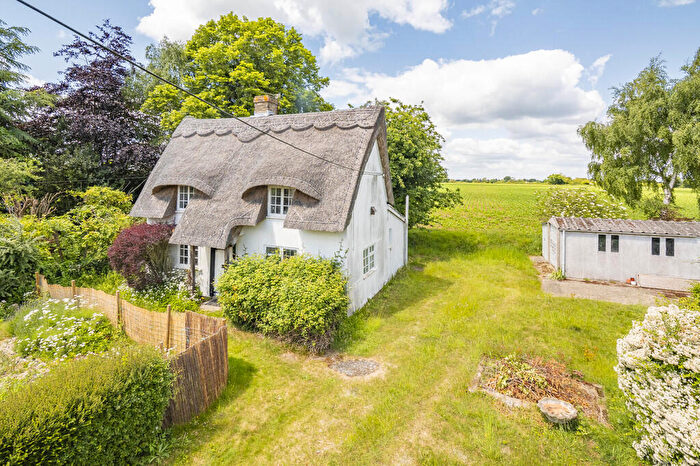
Properties for sale in North Cosford
Previously listed properties in North Cosford
Roads and Postcodes in North Cosford
Navigate through our locations to find the location of your next house in North Cosford, Bury St Edmunds for sale or to rent.
| Streets | Postcodes |
|---|---|
| Blacksmiths Lane | IP30 0NJ |
| Bury Road | IP30 0JR IP30 0NR IP30 0NT IP30 0LB |
| Buttons Green | IP30 0JF |
| Chapel Road | IP30 0HE |
| Church Lane | IP30 0LA |
| Colchester Green | IP30 0HG |
| Cross Green | IP30 0LG |
| Crowbrook Place | IP30 0HZ |
| Dakings Lane | IP30 0NX |
| Dukes Meadow | IP30 0HR |
| Felsham Road | IP30 0HW |
| Great Green | IP30 0HJ IP30 0HQ IP30 0HN |
| Green Lane | IP30 0HL |
| Home Meadow | IP30 0AF |
| Howe Lane | IP30 0HA IP30 0HT |
| Lavenham Road | IP30 0HX |
| Mackenzie Place | IP30 0HY |
| Old Hall Lane | IP30 0LQ |
| Parsonage Green | IP30 0HB |
| Smithwood Green | IP30 0JQ |
| Stows Hill | IP30 0JB |
| The Green | IP30 0NZ |
| Tuns Field | IP30 0HS |
| Willow Bridge | IP30 0JA |
| Windsor Green | IP30 0LY |
| IP30 0JW IP30 0LN IP30 0NU IP30 0NW IP30 0PD IP30 0HH IP30 0NP IP30 0PA |
Transport near North Cosford
- FAQ
- Price Paid By Year
- Property Type Price
Frequently asked questions about North Cosford
What is the average price for a property for sale in North Cosford?
The average price for a property for sale in North Cosford is £488,477. This amount is 38% higher than the average price in Bury St Edmunds. There are 104 property listings for sale in North Cosford.
What streets have the most expensive properties for sale in North Cosford?
The streets with the most expensive properties for sale in North Cosford are Cross Green at an average of £658,750, Chapel Road at an average of £588,166 and Windsor Green at an average of £580,000.
What streets have the most affordable properties for sale in North Cosford?
The streets with the most affordable properties for sale in North Cosford are Blacksmiths Lane at an average of £239,166, Green Lane at an average of £254,175 and Mackenzie Place at an average of £344,166.
Which train stations are available in or near North Cosford?
Some of the train stations available in or near North Cosford are Thurston, Elmswell and Bury St.Edmunds.
Property Price Paid in North Cosford by Year
The average sold property price by year was:
| Year | Average Sold Price | Price Change |
Sold Properties
|
|---|---|---|---|
| 2025 | £435,666 | -12% |
15 Properties |
| 2024 | £488,489 | -10% |
16 Properties |
| 2023 | £536,141 | 5% |
12 Properties |
| 2022 | £508,477 | -4% |
11 Properties |
| 2021 | £531,265 | 1% |
14 Properties |
| 2020 | £524,883 | 16% |
15 Properties |
| 2019 | £442,968 | -18% |
16 Properties |
| 2018 | £523,681 | 35% |
11 Properties |
| 2017 | £341,500 | -25% |
10 Properties |
| 2016 | £426,127 | 11% |
11 Properties |
| 2015 | £377,780 | -4% |
16 Properties |
| 2014 | £392,833 | 11% |
18 Properties |
| 2013 | £348,276 | -17% |
13 Properties |
| 2012 | £405,791 | 32% |
12 Properties |
| 2011 | £276,553 | -2% |
14 Properties |
| 2010 | £282,547 | -4% |
20 Properties |
| 2009 | £294,460 | -34% |
14 Properties |
| 2008 | £394,431 | 11% |
11 Properties |
| 2007 | £349,500 | -5% |
17 Properties |
| 2006 | £367,750 | 28% |
18 Properties |
| 2005 | £264,561 | -16% |
9 Properties |
| 2004 | £307,429 | 29% |
15 Properties |
| 2003 | £219,170 | -17% |
10 Properties |
| 2002 | £256,707 | 38% |
20 Properties |
| 2001 | £158,090 | -32% |
11 Properties |
| 2000 | £208,258 | 41% |
13 Properties |
| 1999 | £123,740 | 6% |
12 Properties |
| 1998 | £115,836 | -50% |
15 Properties |
| 1997 | £173,571 | 45% |
16 Properties |
| 1996 | £95,954 | -4% |
12 Properties |
| 1995 | £99,375 | - |
16 Properties |
Property Price per Property Type in North Cosford
Here you can find historic sold price data in order to help with your property search.
The average Property Paid Price for specific property types in the last three years are:
| Property Type | Average Sold Price | Sold Properties |
|---|---|---|
| Semi Detached House | £348,126.00 | 26 Semi Detached Houses |
| Detached House | £656,104.00 | 24 Detached Houses |
| Terraced House | £395,000.00 | 4 Terraced Houses |

