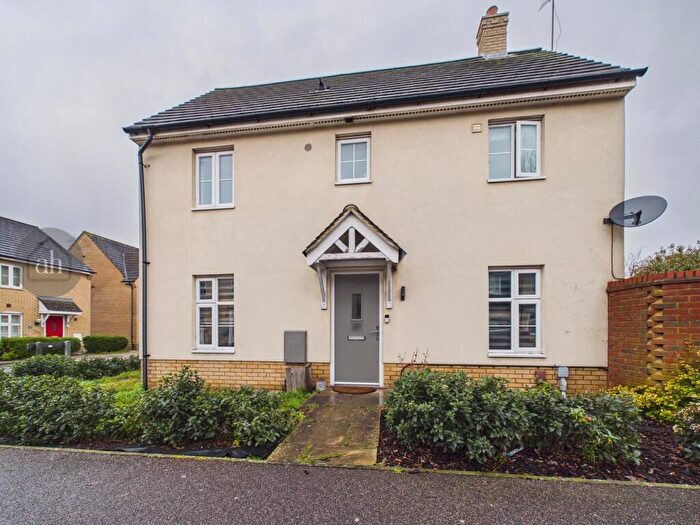
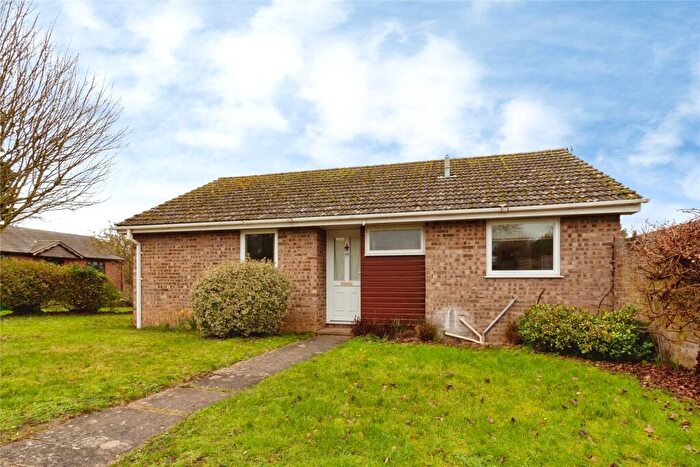
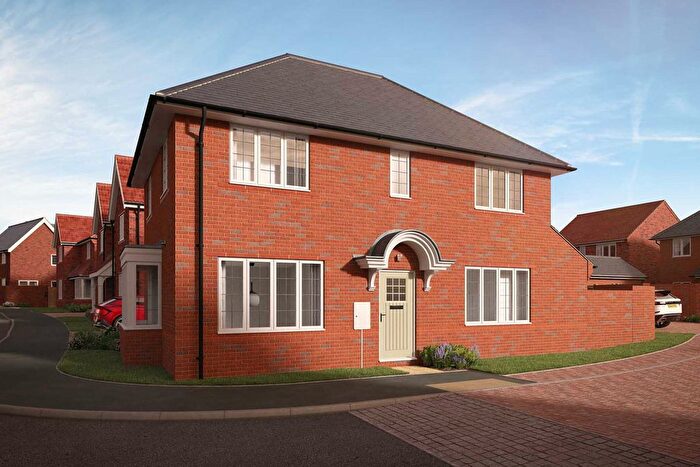
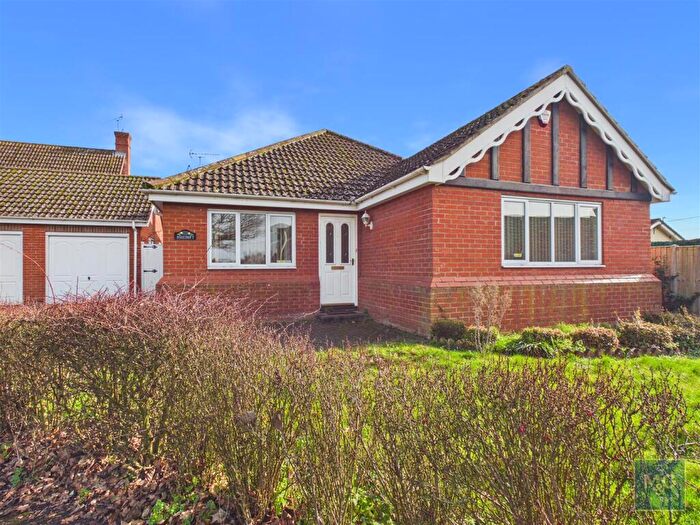
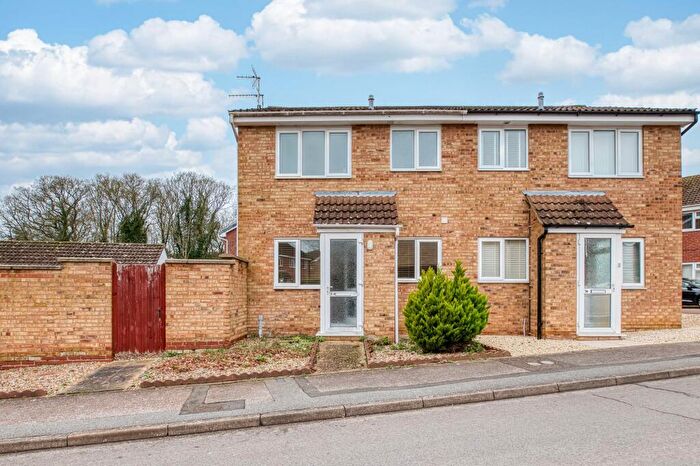
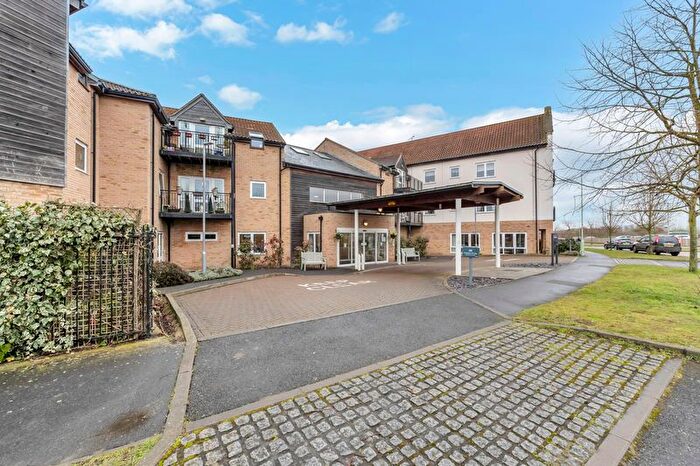
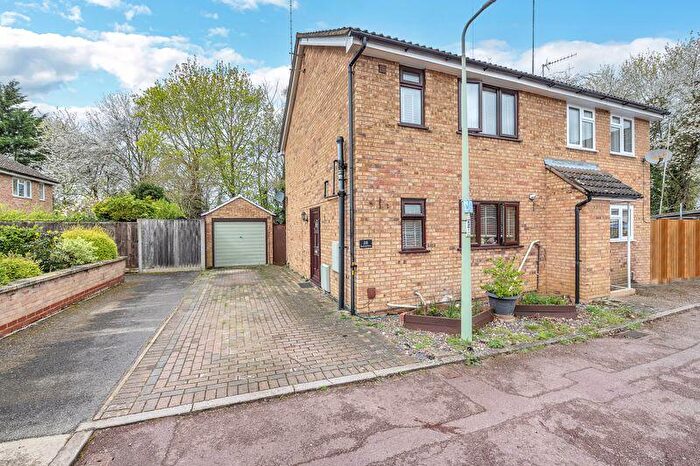
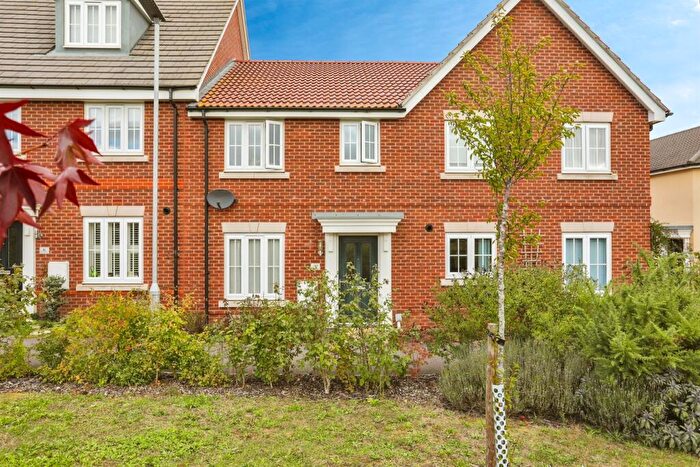
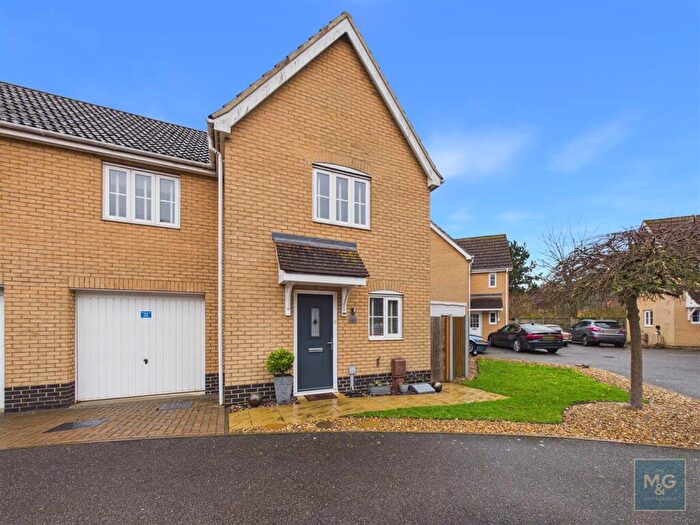
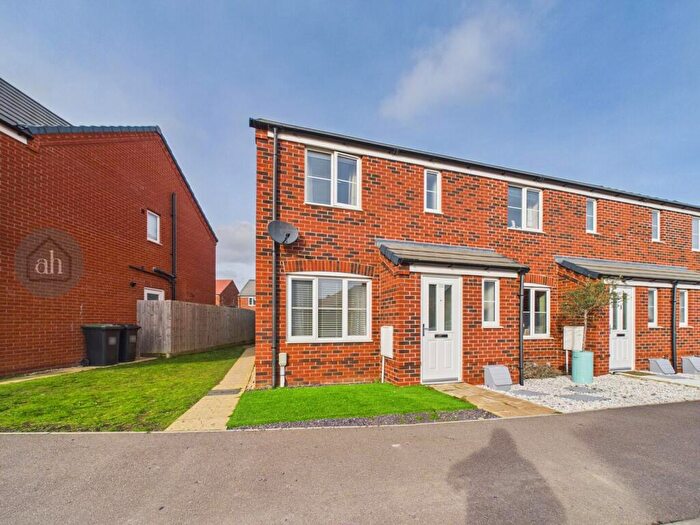
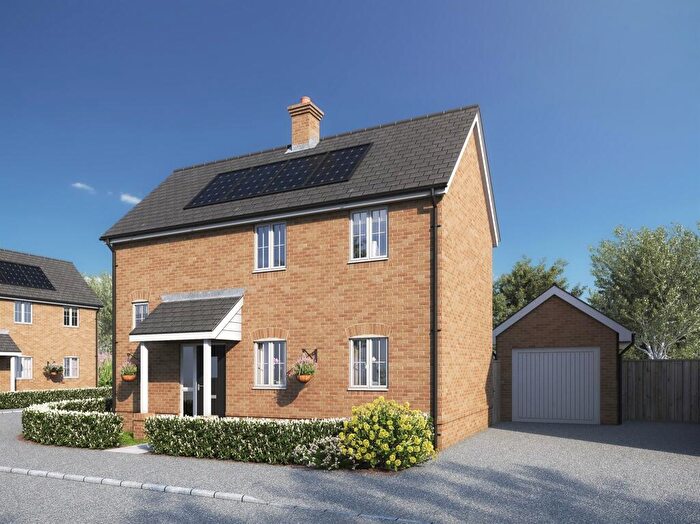
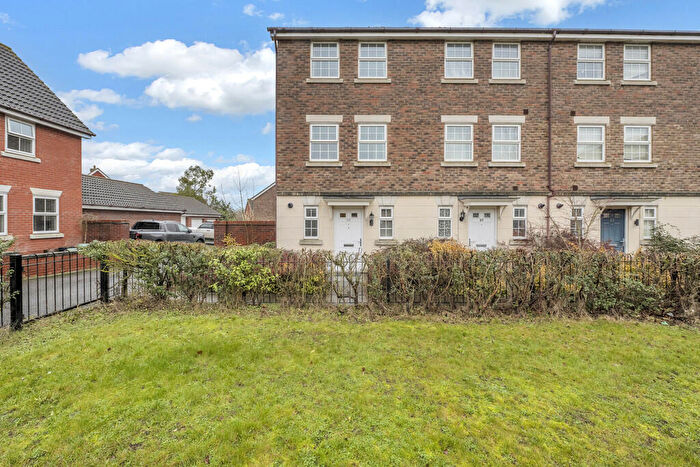
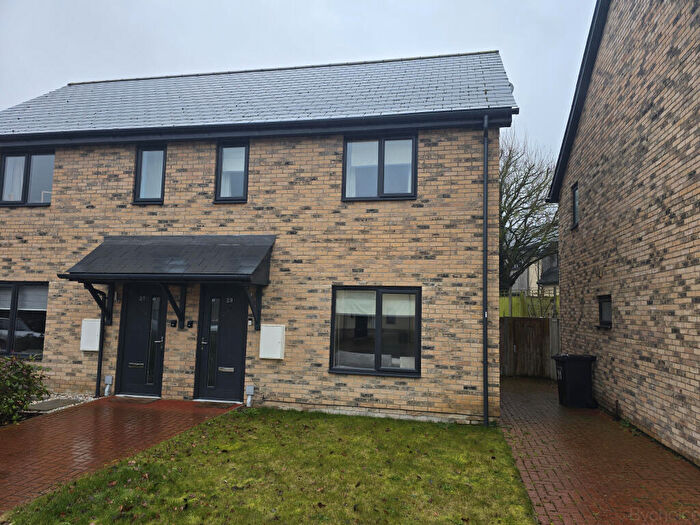
Houses for sale & to rent in Rougham, Bury St Edmunds
House Prices in Rougham
Properties in Rougham have an average house price of £353,692.00 and had 72 Property Transactions within the last 3 years¹.
Rougham is an area in Bury St Edmunds, Suffolk with 968 households², where the most expensive property was sold for £850,000.00.
Properties for sale in Rougham
Roads and Postcodes in Rougham
Navigate through our locations to find the location of your next house in Rougham, Bury St Edmunds for sale or to rent.
| Streets | Postcodes |
|---|---|
| Almshouse Road | IP30 9JN |
| Beechcroft | IP29 4RT |
| Blackthorpe | IP30 9HZ IP30 9JG |
| Bradfield Road | IP30 9LQ |
| Bradfield St George Road | IP30 0EH |
| Bury Road | IP30 0DJ IP30 0ED IP29 4SE IP29 4RS IP30 0EN |
| Chapmans Close | IP30 9NE |
| Church Road | IP30 0DH IP30 0DQ IP29 4RE IP30 0BG |
| Drury Close | IP30 9JE |
| Eastlowe Hill | IP30 9JT |
| Elderstub Lane | IP30 9HY |
| Elm Green Lane | IP30 0BH |
| Felsham Road | IP30 0AB IP30 0AD IP30 0AG IP30 0AS |
| Fox Cottages | IP29 4RU |
| Freewood Street | IP30 0AY |
| Green Lane | IP30 9JR |
| Hessett Road | IP30 0BB |
| High Rougham | IP30 9LN IP30 9LP |
| Hoggards Green | IP29 4RG |
| Hollybush Corner | IP30 0AX |
| Ipswich Road | IP30 9LZ IP30 9NG |
| Ixer Lane | IP30 0LR IP30 0LU |
| James Stiff Cottages | IP30 9JL |
| Kedington Close | IP30 9JF |
| Kings Close | IP30 9GX |
| Kingshall Green | IP30 0BA |
| Kingshall Street | IP30 9LF IP30 9LG IP30 9LH IP30 9LE |
| Lower Gorse | IP30 9HX |
| Moat Lane | IP30 9JZ IP30 9LD |
| Mouse Lane | IP30 9JB |
| Nether Street | IP30 9LW |
| New Road | IP30 9LJ |
| Newthorpe | IP30 9NQ |
| Norse Avenue | IP29 4RN |
| North Hill | IP30 0EU |
| Oak Lane | IP30 9JX |
| Oakey Ley | IP30 0AU |
| Old Lane | IP29 4SA |
| Orchard Close | IP30 9NJ |
| Pitchers Green | IP30 0AW |
| Poplar Meadow | IP30 0EW |
| Priors Close | IP30 9LL |
| Reed Place | IP30 9LB |
| Rokewood Place | IP29 4RF |
| Rookwood Farm Cottages | IP29 4SB |
| Rougham Park | IP30 9LX |
| Rougham Road | IP30 0AZ |
| Sandy Lane | IP30 0ET |
| Skyliner Way | IP32 7FR |
| Smallwood Green | IP30 0AJ |
| Smithy Close | IP29 4RH IP30 9LA |
| Smithy Court | IP30 9FE |
| St Clare Hall Bungalows | IP30 0EJ |
| The Battlies | IP30 9NA IP30 9ZD |
| The Downs | IP30 9JQ |
| The Green | IP29 4RJ IP30 9JP IP30 9JY IP29 4RL IP30 9JU |
| The Street | IP30 0LP |
| Thurston Road | IP30 9LU |
| Tower Cottages | IP30 0EL IP30 0EQ |
| Vikings Close | IP29 4RW |
| Wheelwright Close | IP30 9JD |
| White Horse Lane | IP30 0BQ |
| IP30 0BP IP30 0EE IP30 0EF IP29 4RA IP29 4RR IP29 4RB IP29 4RD IP29 4RQ IP29 4SD IP30 0DX IP30 0EG IP30 0LS IP30 0LW IP30 9JW IP29 4SG IP29 4SJ IP30 0AA IP30 0AL IP30 0AN IP30 0DL IP30 0EP IP30 0ER IP30 0ES IP30 0LL IP30 9JA IP30 9JJ IP30 9JS IP30 9LR IP30 9LS |
Transport near Rougham
- FAQ
- Price Paid By Year
- Property Type Price
Frequently asked questions about Rougham
What is the average price for a property for sale in Rougham?
The average price for a property for sale in Rougham is £353,692. This amount is 0.86% higher than the average price in Bury St Edmunds. There are 1,609 property listings for sale in Rougham.
What streets have the most expensive properties for sale in Rougham?
The streets with the most expensive properties for sale in Rougham are Freewood Street at an average of £850,000, High Rougham at an average of £496,000 and Kings Close at an average of £453,750.
What streets have the most affordable properties for sale in Rougham?
The streets with the most affordable properties for sale in Rougham are Reed Place at an average of £177,500, Rougham Road at an average of £195,000 and Tower Cottages at an average of £205,000.
Which train stations are available in or near Rougham?
Some of the train stations available in or near Rougham are Thurston, Bury St.Edmunds and Elmswell.
Property Price Paid in Rougham by Year
The average sold property price by year was:
| Year | Average Sold Price | Price Change |
Sold Properties
|
|---|---|---|---|
| 2025 | £341,117 | -8% |
18 Properties |
| 2024 | £367,548 | 6% |
31 Properties |
| 2023 | £344,858 | -15% |
23 Properties |
| 2022 | £395,218 | -16% |
16 Properties |
| 2021 | £457,117 | 19% |
35 Properties |
| 2020 | £371,753 | -5% |
24 Properties |
| 2019 | £388,806 | 10% |
31 Properties |
| 2018 | £349,269 | 11% |
26 Properties |
| 2017 | £309,920 | -5% |
27 Properties |
| 2016 | £325,629 | -21% |
27 Properties |
| 2015 | £395,639 | 32% |
32 Properties |
| 2014 | £270,284 | 4% |
32 Properties |
| 2013 | £260,515 | -5% |
29 Properties |
| 2012 | £273,157 | 2% |
21 Properties |
| 2011 | £267,071 | 3% |
21 Properties |
| 2010 | £259,269 | 10% |
20 Properties |
| 2009 | £232,729 | -7% |
25 Properties |
| 2008 | £249,902 | -24% |
18 Properties |
| 2007 | £308,975 | 21% |
33 Properties |
| 2006 | £244,903 | -7% |
44 Properties |
| 2005 | £263,250 | -13% |
30 Properties |
| 2004 | £296,170 | 23% |
24 Properties |
| 2003 | £228,023 | 21% |
21 Properties |
| 2002 | £181,226 | 10% |
28 Properties |
| 2001 | £162,930 | 10% |
34 Properties |
| 2000 | £146,621 | 29% |
26 Properties |
| 1999 | £104,105 | 14% |
24 Properties |
| 1998 | £90,027 | 13% |
31 Properties |
| 1997 | £78,605 | -1% |
28 Properties |
| 1996 | £79,586 | -26% |
29 Properties |
| 1995 | £100,365 | - |
19 Properties |
Property Price per Property Type in Rougham
Here you can find historic sold price data in order to help with your property search.
The average Property Paid Price for specific property types in the last three years are:
| Property Type | Average Sold Price | Sold Properties |
|---|---|---|
| Semi Detached House | £302,173.00 | 23 Semi Detached Houses |
| Detached House | £471,234.00 | 26 Detached Houses |
| Terraced House | £276,037.00 | 20 Terraced Houses |
| Flat | £247,666.00 | 3 Flats |

