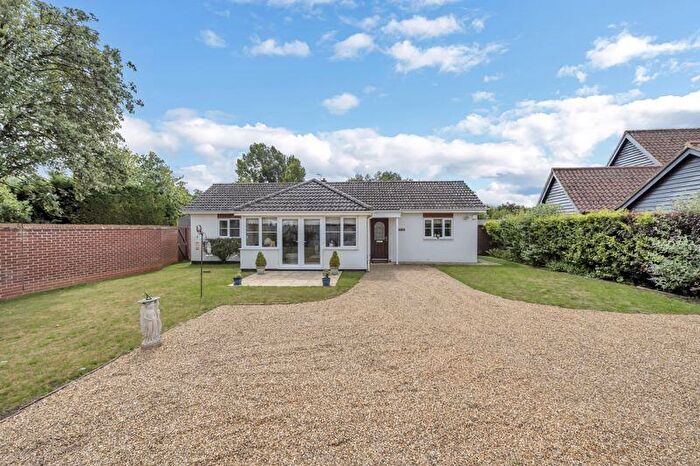
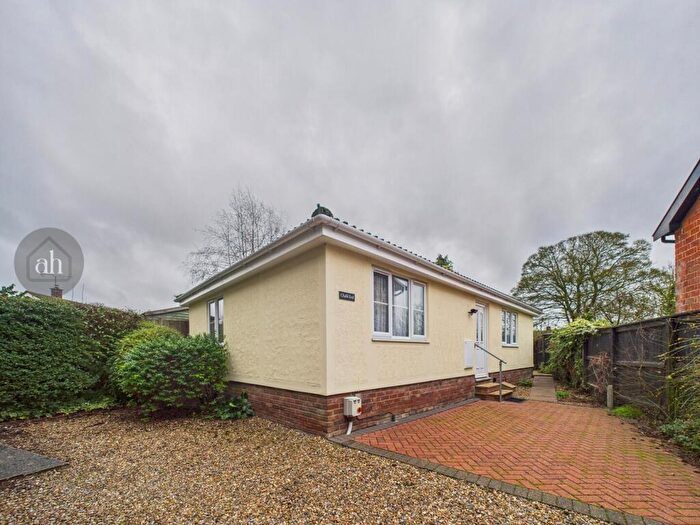
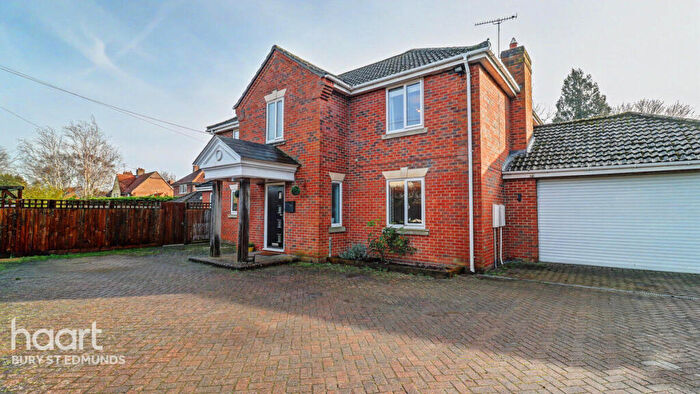
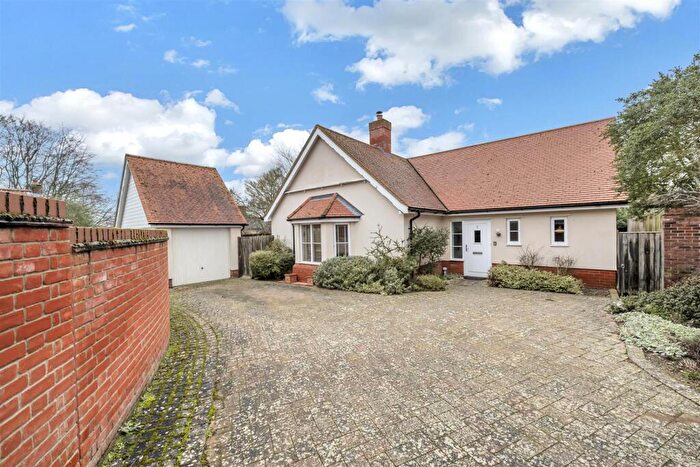
Houses for sale & to rent in Pakenham, Bury St Edmunds
House Prices in Pakenham
Properties in Pakenham have an average house price of £417,008.00 and had 52 Property Transactions within the last 3 years¹.
Pakenham is an area in Bury St Edmunds, Suffolk with 635 households², where the most expensive property was sold for £1,115,000.00.
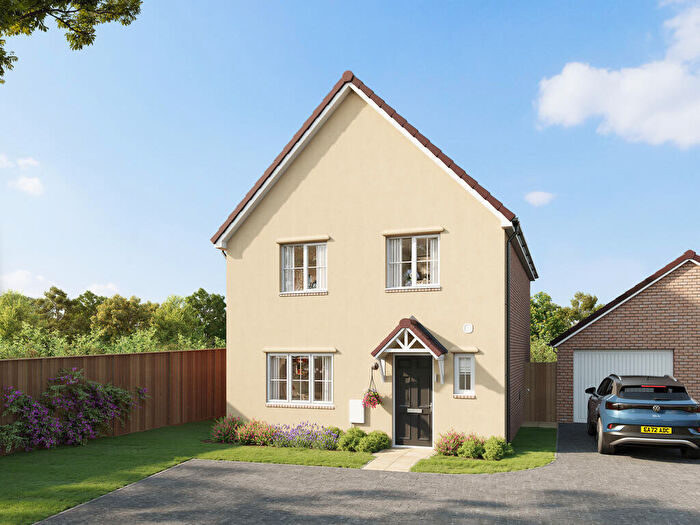
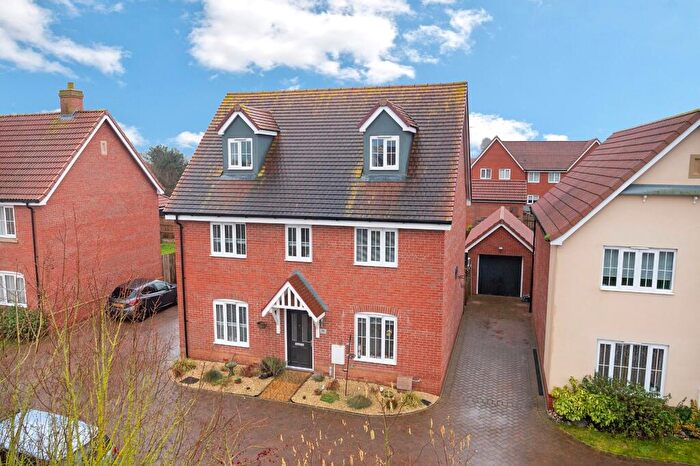
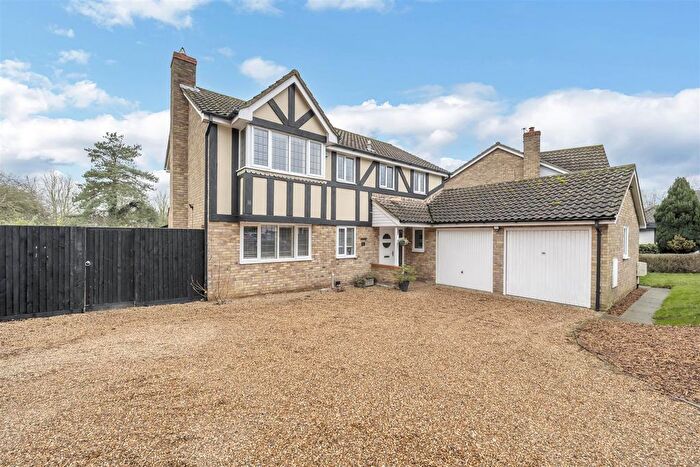
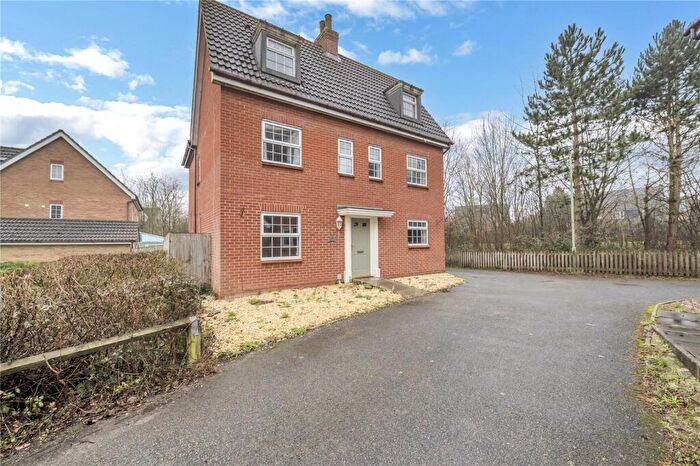
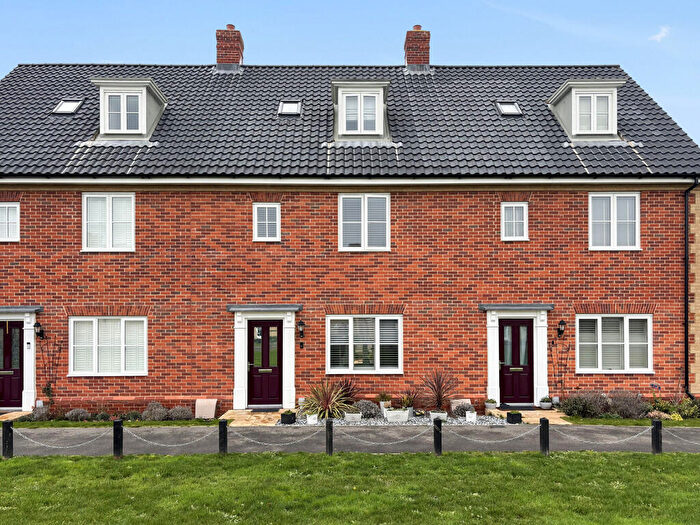
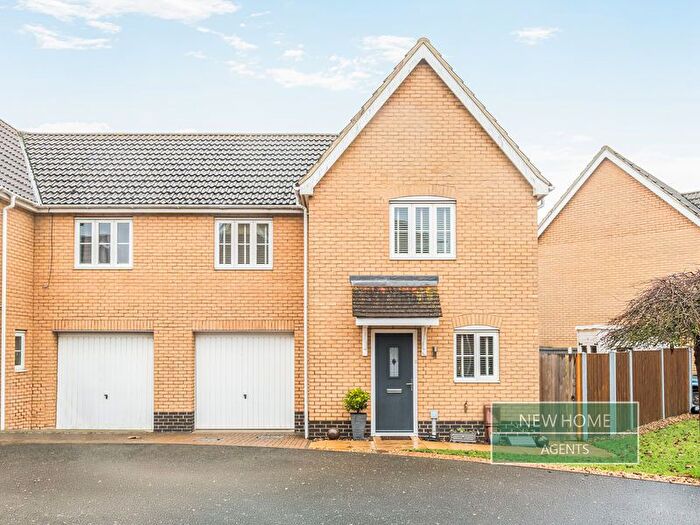
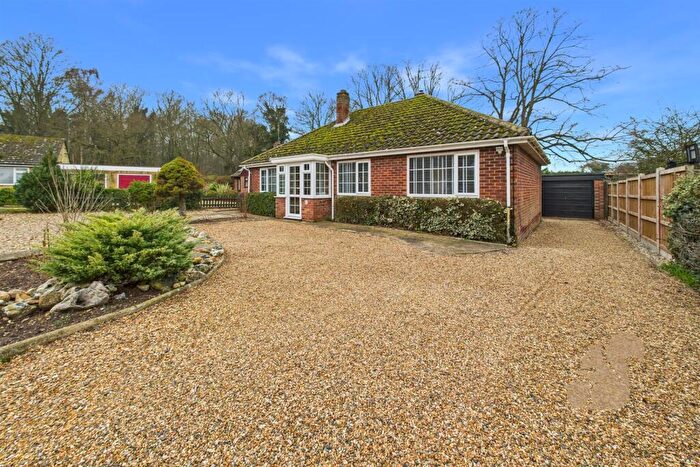
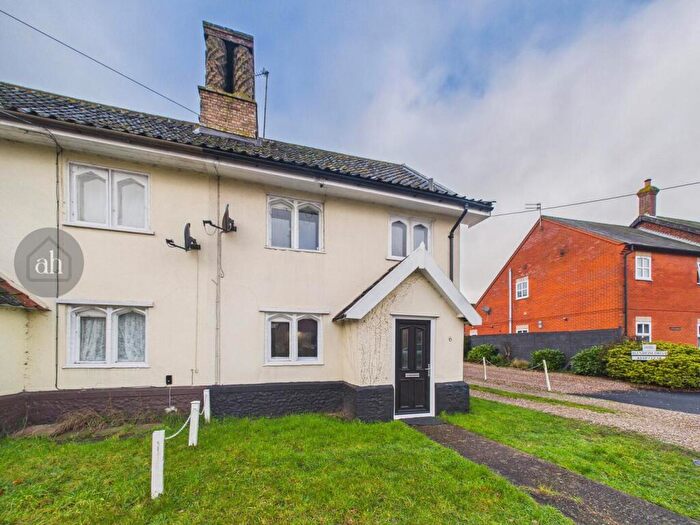
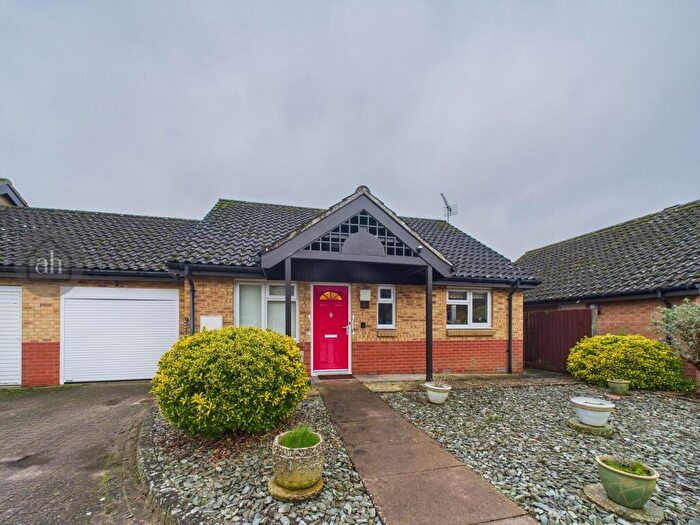
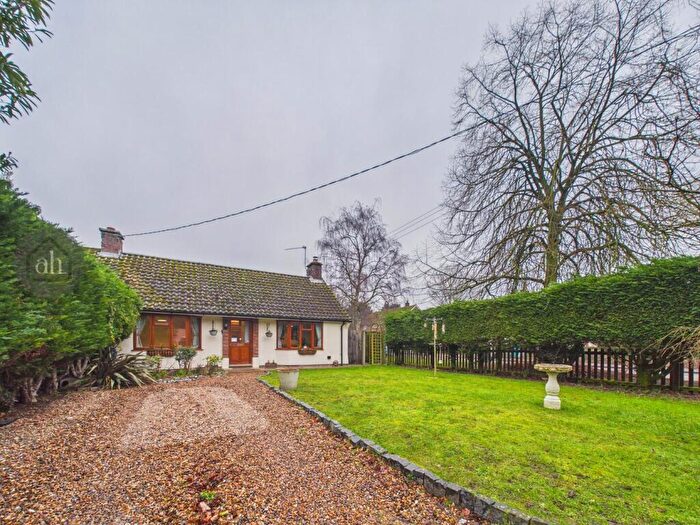
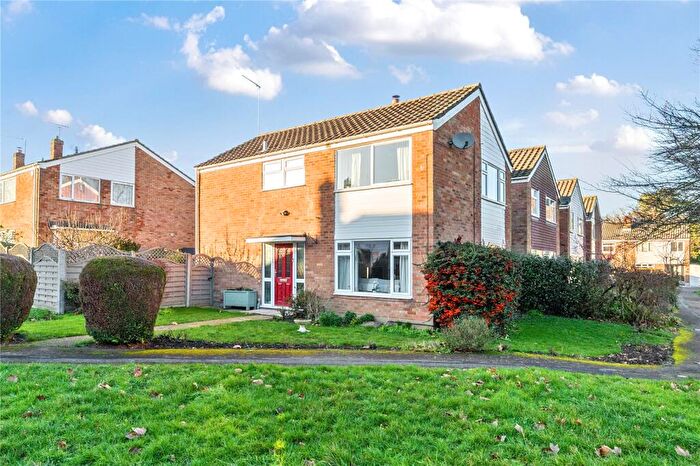
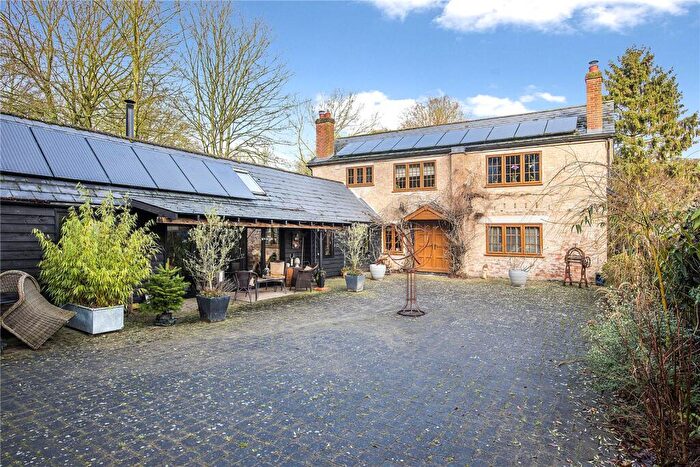
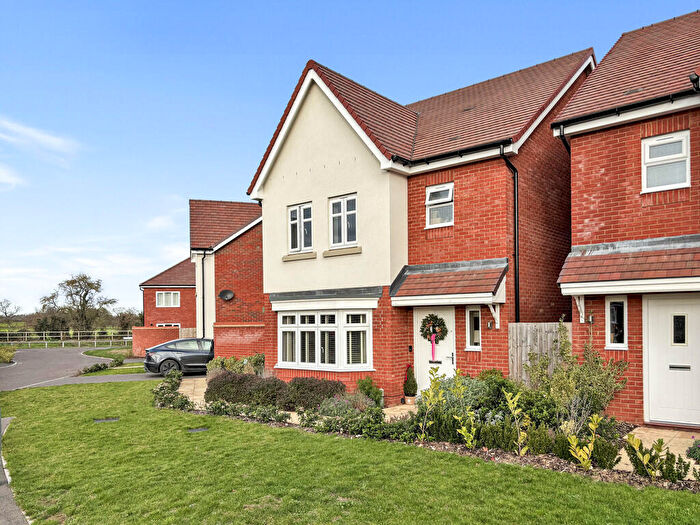
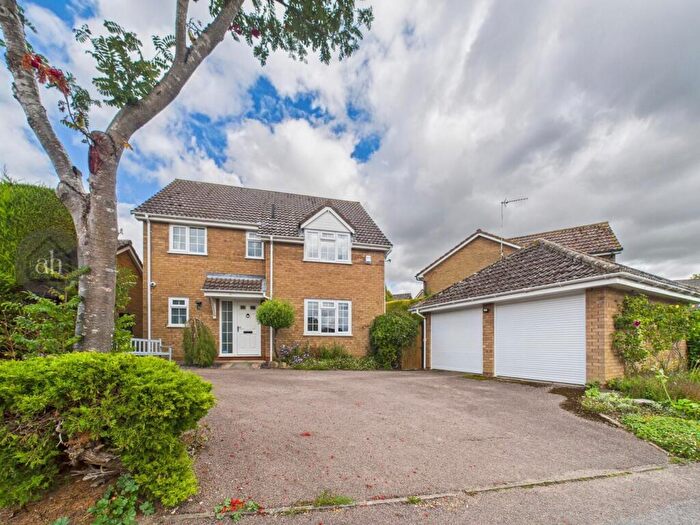
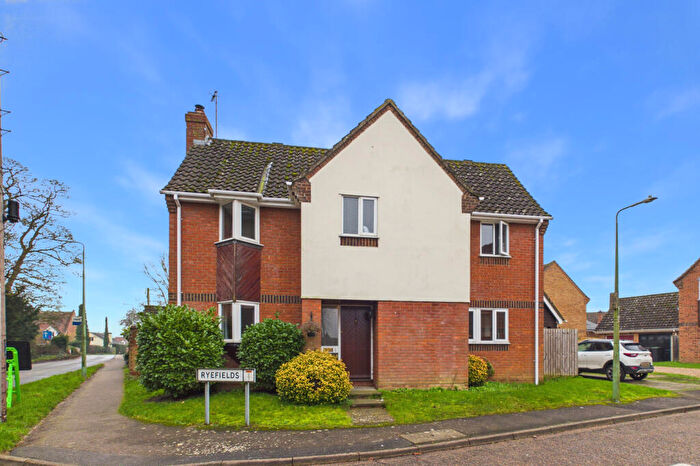
Properties for sale in Pakenham
Roads and Postcodes in Pakenham
Navigate through our locations to find the location of your next house in Pakenham, Bury St Edmunds for sale or to rent.
| Streets | Postcodes |
|---|---|
| Baileypool Road | IP31 2LX |
| Bell Corner | IP31 2JT |
| Birds Croft | IP31 1JJ |
| Brand Road | IP31 2PZ |
| Bull Lane | IP31 3LL |
| Bull Road | IP31 2LW |
| Bury Road | IP31 2HX |
| Calthorpe Cottages | IP31 1NX |
| Capel Close | IP31 1EP |
| Church Green | IP31 2LL |
| Church Hill | IP31 2LH IP31 2LN |
| Church Lane | IP31 1EX |
| Common Lane | IP31 1EY |
| Fen Road | IP31 2LP IP31 2LS IP31 2JS IP31 2LT |
| Garden Fields | IP31 1HA |
| Grimstone End | IP31 2LZ |
| Hall Lane | IP31 1EU |
| Honington Road | IP31 1EL |
| Ixworth Road | IP31 1EZ IP31 2PT IP31 2PU |
| Livermere Road | IP31 1ER |
| Manor Garth | IP31 2LB |
| Mere View | IP31 1JU |
| Mill Road | IP31 2NE IP31 2NB |
| Orchard Close | IP31 1JN |
| Paddock Way | IP31 1ES |
| Poplar Close | IP31 1LJ |
| School Gardens | IP31 1JY |
| St Marys View | IP31 2ND |
| The Greenwoods | IP31 2JJ |
| The Owell | IP31 2LE IP31 2LF |
| The Street | IP31 2JU IP31 2JX IP31 1JX IP31 1EW |
| Thurston Road | IP31 2NG IP31 2JZ |
| Troston Road | IP31 1JL |
| Upper Town | IP31 2LA IP31 2JY |
| Woodsdale Grove | IP31 1EJ |
| IP31 1JR IP31 2LR IP31 1ET IP31 1JH |
Transport near Pakenham
- FAQ
- Price Paid By Year
- Property Type Price
Frequently asked questions about Pakenham
What is the average price for a property for sale in Pakenham?
The average price for a property for sale in Pakenham is £417,008. This amount is 19% higher than the average price in Bury St Edmunds. There are 1,316 property listings for sale in Pakenham.
What streets have the most expensive properties for sale in Pakenham?
The streets with the most expensive properties for sale in Pakenham are Fen Road at an average of £631,428, Woodsdale Grove at an average of £588,500 and School Gardens at an average of £490,000.
What streets have the most affordable properties for sale in Pakenham?
The streets with the most affordable properties for sale in Pakenham are Poplar Close at an average of £150,000, Garden Fields at an average of £257,497 and Orchard Close at an average of £265,000.
Which train stations are available in or near Pakenham?
Some of the train stations available in or near Pakenham are Thurston, Bury St.Edmunds and Elmswell.
Property Price Paid in Pakenham by Year
The average sold property price by year was:
| Year | Average Sold Price | Price Change |
Sold Properties
|
|---|---|---|---|
| 2025 | £404,067 | 1% |
14 Properties |
| 2024 | £401,433 | -8% |
15 Properties |
| 2023 | £435,043 | 10% |
23 Properties |
| 2022 | £393,548 | -1% |
26 Properties |
| 2021 | £396,421 | 8% |
22 Properties |
| 2020 | £366,447 | 13% |
19 Properties |
| 2019 | £317,820 | -8% |
19 Properties |
| 2018 | £344,184 | 4% |
19 Properties |
| 2017 | £331,261 | 2% |
21 Properties |
| 2016 | £323,533 | 14% |
15 Properties |
| 2015 | £276,690 | 9% |
21 Properties |
| 2014 | £250,439 | -19% |
31 Properties |
| 2013 | £298,147 | 12% |
17 Properties |
| 2012 | £262,090 | -5% |
11 Properties |
| 2011 | £274,653 | -10% |
13 Properties |
| 2010 | £303,144 | 25% |
17 Properties |
| 2009 | £226,194 | -3% |
22 Properties |
| 2008 | £234,062 | -13% |
16 Properties |
| 2007 | £263,888 | 2% |
32 Properties |
| 2006 | £258,109 | 35% |
27 Properties |
| 2005 | £166,829 | -50% |
51 Properties |
| 2004 | £249,893 | 23% |
32 Properties |
| 2003 | £192,243 | -4% |
24 Properties |
| 2002 | £200,132 | 33% |
26 Properties |
| 2001 | £133,138 | 12% |
21 Properties |
| 2000 | £117,344 | 2% |
18 Properties |
| 1999 | £114,972 | 1% |
20 Properties |
| 1998 | £113,670 | -2% |
22 Properties |
| 1997 | £115,798 | 26% |
35 Properties |
| 1996 | £85,998 | 19% |
29 Properties |
| 1995 | £69,678 | - |
14 Properties |
Property Price per Property Type in Pakenham
Here you can find historic sold price data in order to help with your property search.
The average Property Paid Price for specific property types in the last three years are:
| Property Type | Average Sold Price | Sold Properties |
|---|---|---|
| Semi Detached House | £320,663.00 | 15 Semi Detached Houses |
| Detached House | £494,758.00 | 29 Detached Houses |
| Terraced House | £283,071.00 | 7 Terraced Houses |
| Flat | £545,000.00 | 1 Flat |

