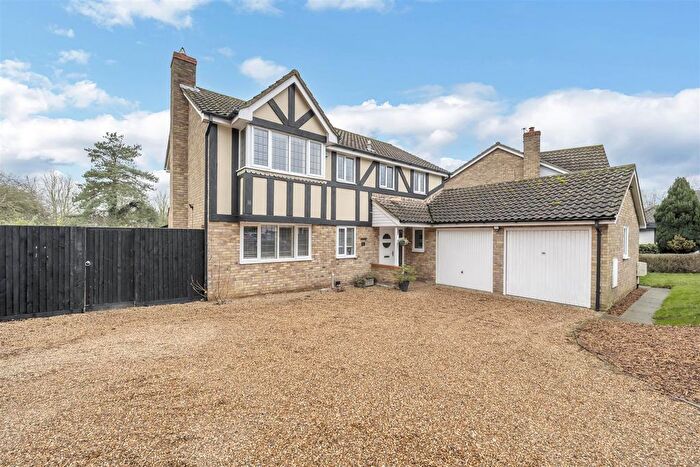
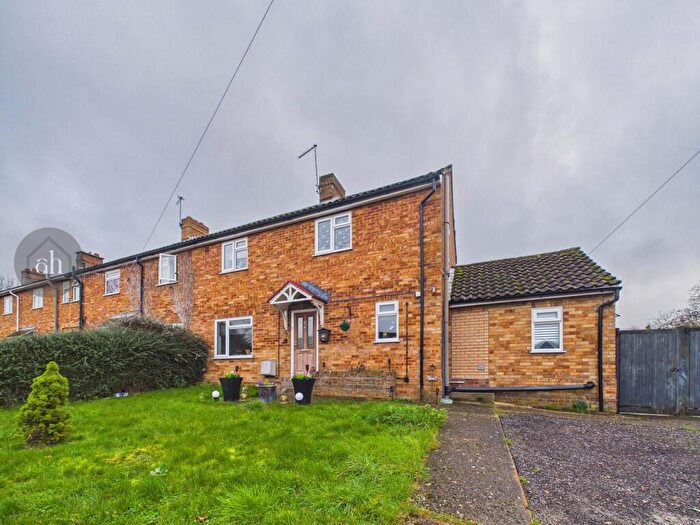
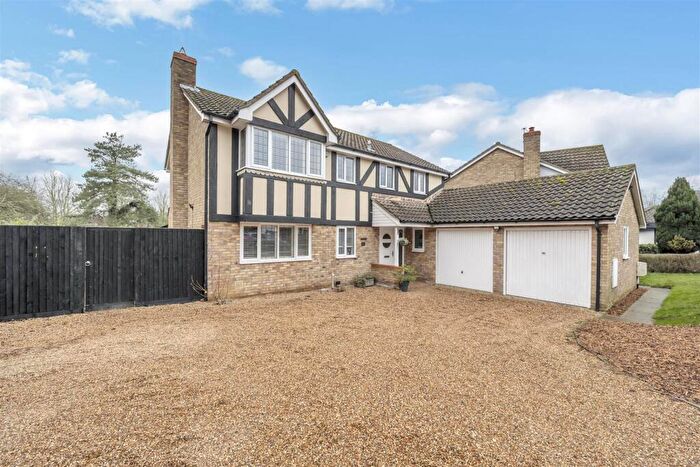
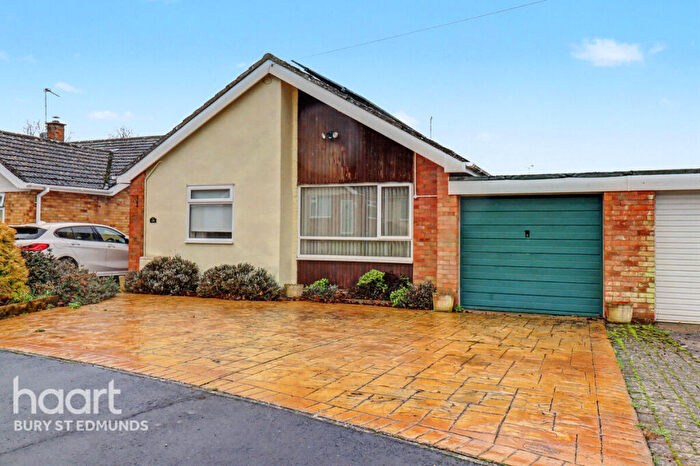
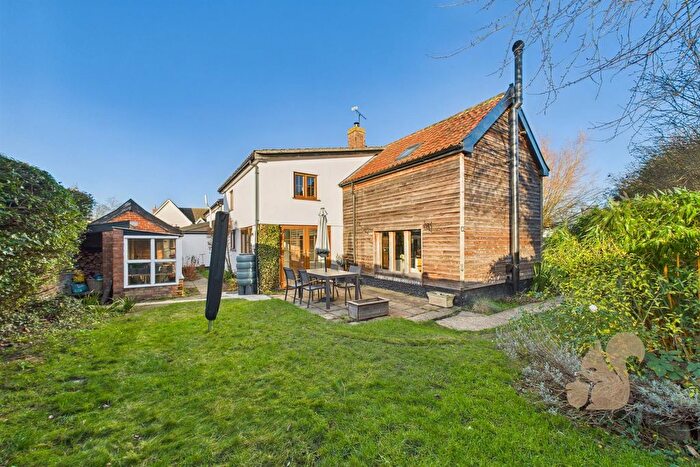
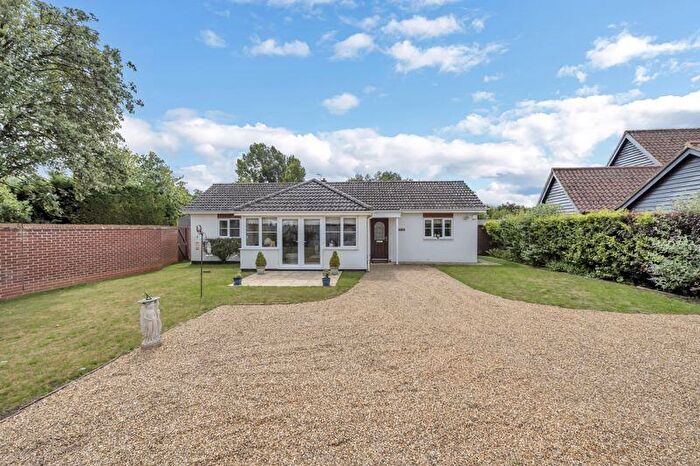
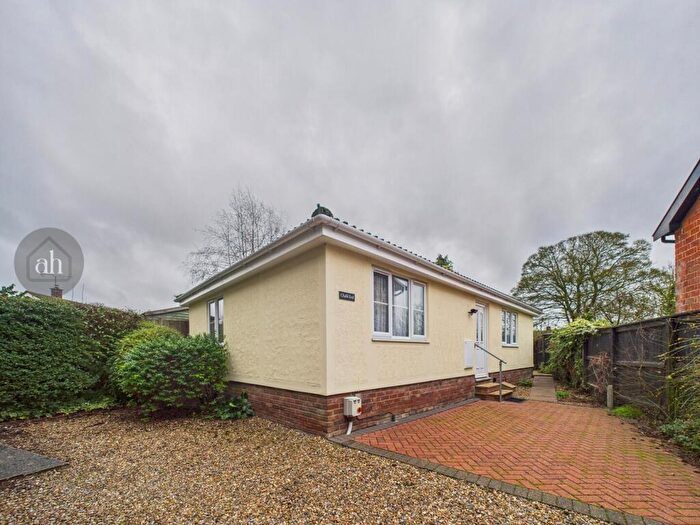
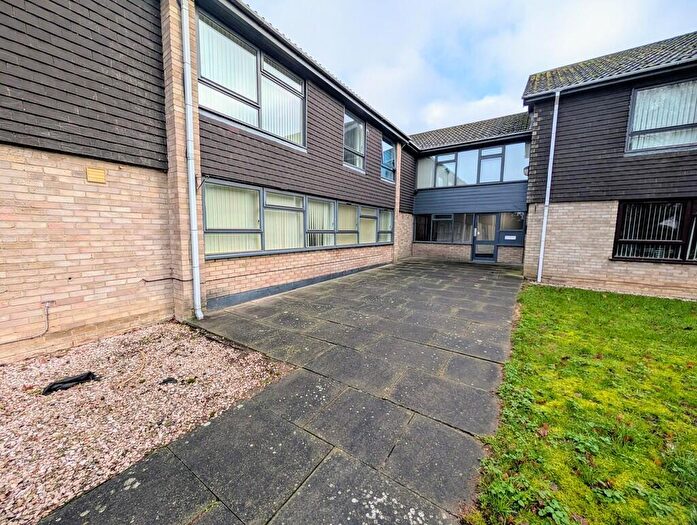
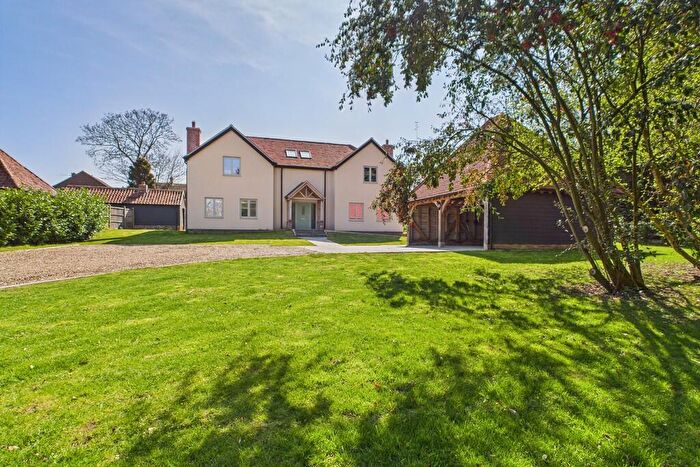
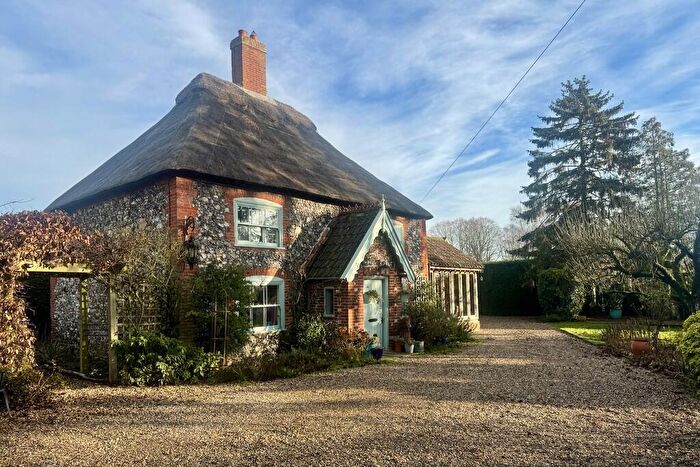
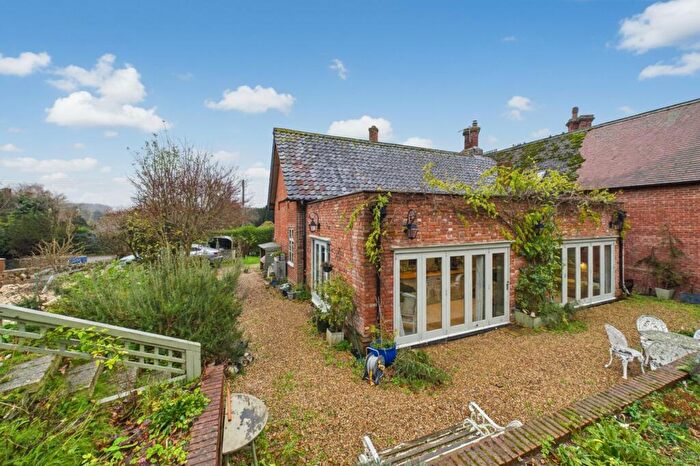
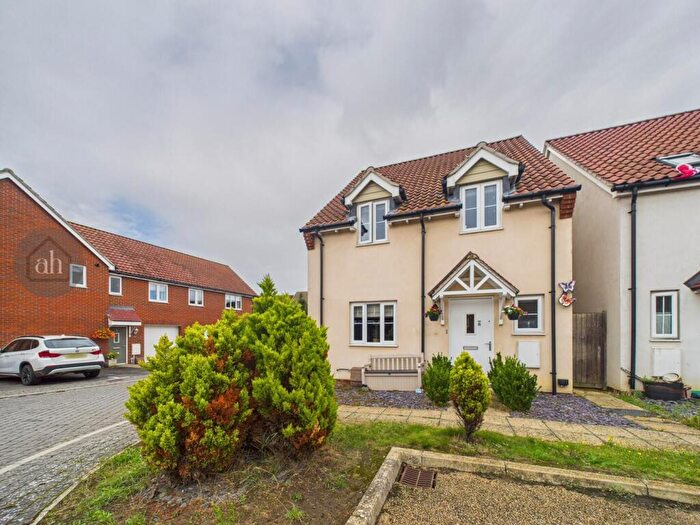
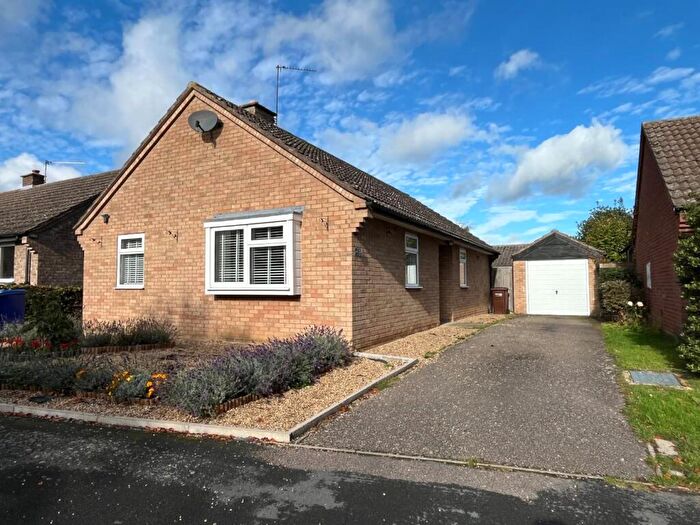
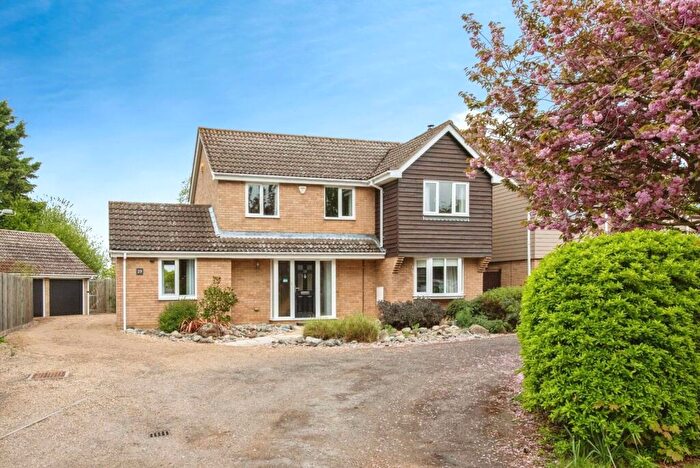
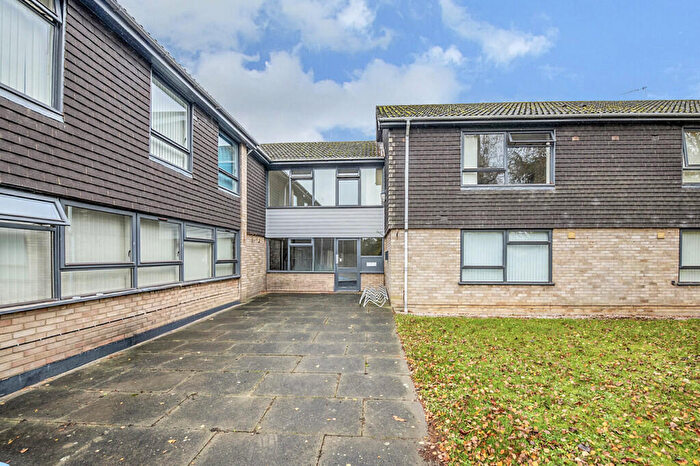
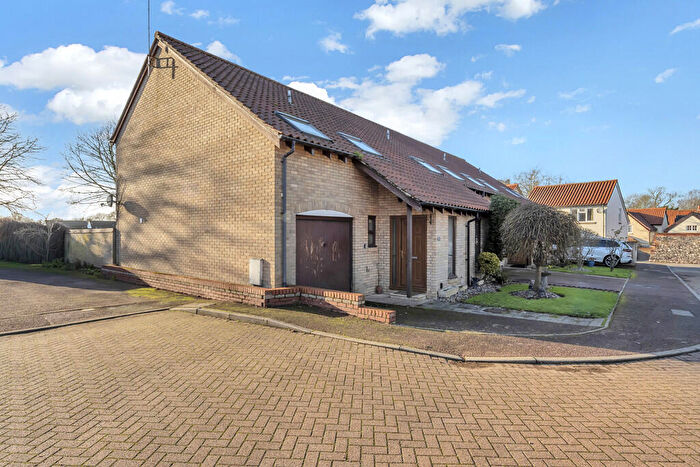
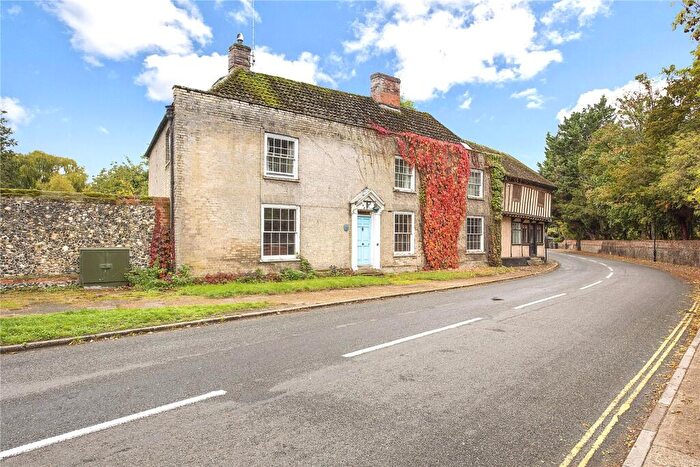
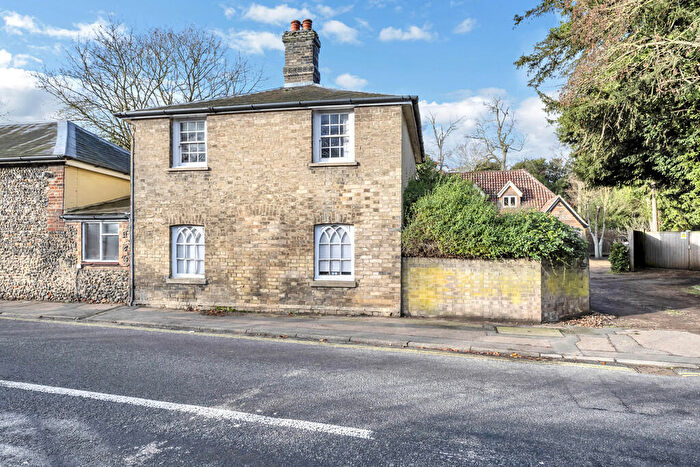
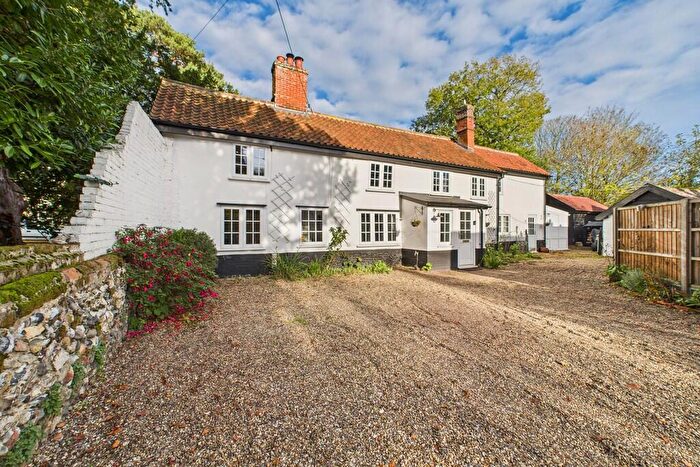
Houses for sale & to rent in Bardwell, Bury St Edmunds
House Prices in Bardwell
Properties in Bardwell have an average house price of £386,231.00 and had 41 Property Transactions within the last 3 years¹.
Bardwell is an area in Bury St Edmunds, Suffolk with 706 households², where the most expensive property was sold for £945,000.00.
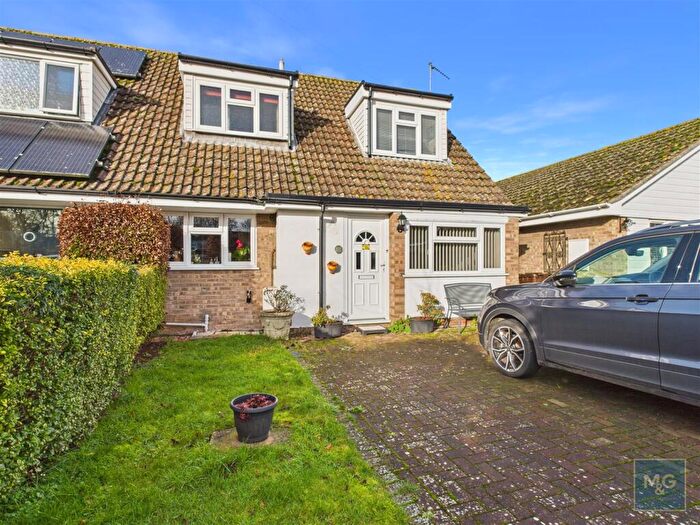
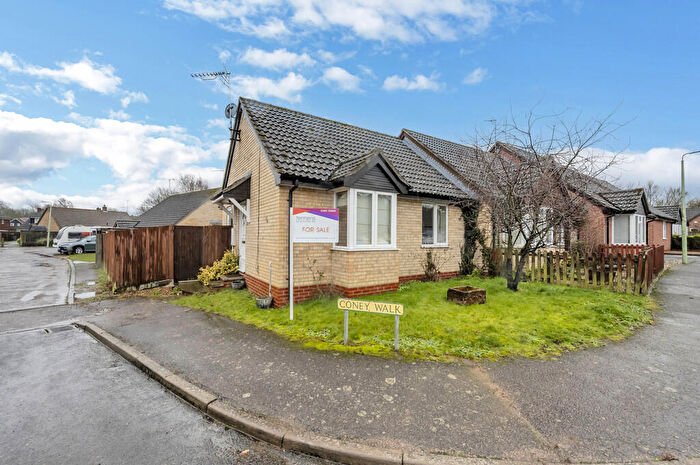
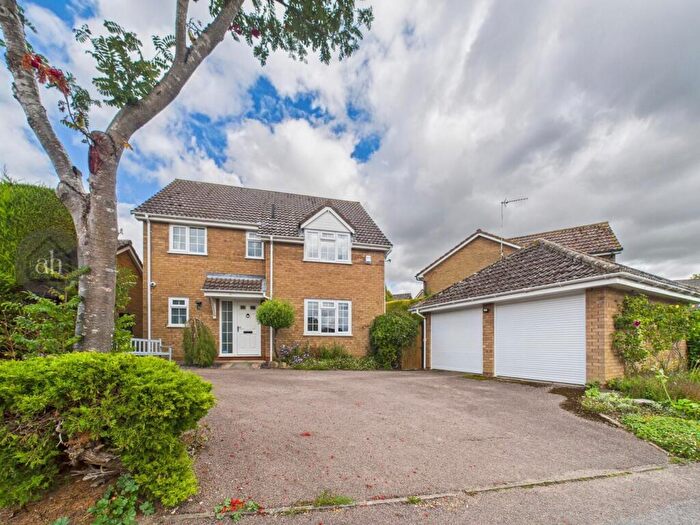
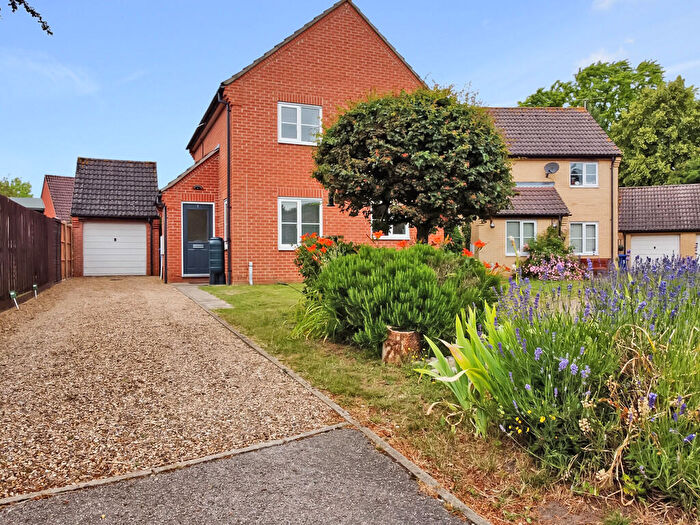
Properties for sale in Bardwell
Roads and Postcodes in Bardwell
Navigate through our locations to find the location of your next house in Bardwell, Bury St Edmunds for sale or to rent.
| Streets | Postcodes |
|---|---|
| Barningham Park | IP31 1EA |
| Bloomfield Close | IP31 1RL |
| Borley Close | IP31 1RF |
| Bowbeck | IP31 1AZ IP31 1BA |
| Carr Lane | IP31 1AT |
| Church Road | IP31 1RG IP31 1AH |
| Coney Weston Road | IP31 1RX IP31 1RU |
| Crow Street | IP31 1DL |
| Daveys Lane | IP31 1BD |
| Glassfield Road | IP31 2DS |
| Heath Road | IP31 1RY |
| Ixworth Road | IP31 1AU IP31 1QY |
| Knox Lane | IP31 1AX |
| Lammas Close | IP31 1AF |
| Lampitt Way | IP31 1RS |
| Legion Rise | IP31 1BE |
| Low Street | IP31 1AR IP31 1AS |
| Malting Row | IP31 1RE |
| Mill Road | IP31 1SB |
| Norwich Lane | IP31 1HL |
| Old Mill Court | IP31 1BG |
| Paddock Farm | IP31 1DS |
| Park Road | IP31 1EB |
| Quaker Lane | IP31 1AJ IP31 1AL IP31 1BH |
| Rushford Road | IP31 1BL |
| Sapiston Road | IP31 1RJ |
| School Lane | IP31 1AD |
| Skinners Lane | IP31 1AE |
| Spring Road | IP31 1AB |
| Swan Lane | IP31 1DW |
| The Croft | IP31 1AN |
| The Drift | IP31 1RT |
| The Green | IP31 1AW |
| The Heath | IP31 1RZ |
| The Street | IP31 1HG |
| The Timbers | IP31 1RQ |
| Thetford Road | IP31 1DN IP31 1DP IP31 1HQ |
| Three Crossways | IP31 1DR |
| Troston Road | IP31 1RD |
| Up Street | IP31 1AA |
| Vine Close | IP31 1HP |
| Willow Green | IP31 1RH |
| Wyken Road | IP31 2DP |
| IP31 1AQ IP31 1HH IP31 1RB IP31 1RR IP31 1QX IP31 1QZ IP31 1SA IP31 1AP IP31 1AY IP31 1BB IP31 1HJ |
Transport near Bardwell
- FAQ
- Price Paid By Year
- Property Type Price
Frequently asked questions about Bardwell
What is the average price for a property for sale in Bardwell?
The average price for a property for sale in Bardwell is £386,231. This amount is 10% higher than the average price in Bury St Edmunds. There are 445 property listings for sale in Bardwell.
What streets have the most expensive properties for sale in Bardwell?
The streets with the most expensive properties for sale in Bardwell are Bowbeck at an average of £735,000, Old Mill Court at an average of £650,000 and The Street at an average of £584,000.
What streets have the most affordable properties for sale in Bardwell?
The streets with the most affordable properties for sale in Bardwell are Lammas Close at an average of £200,000, Willow Green at an average of £235,000 and School Lane at an average of £244,000.
Which train stations are available in or near Bardwell?
Some of the train stations available in or near Bardwell are Thurston, Thetford and Elmswell.
Property Price Paid in Bardwell by Year
The average sold property price by year was:
| Year | Average Sold Price | Price Change |
Sold Properties
|
|---|---|---|---|
| 2025 | £430,138 | 28% |
18 Properties |
| 2024 | £309,727 | -26% |
11 Properties |
| 2023 | £390,500 | -19% |
12 Properties |
| 2022 | £465,958 | 13% |
25 Properties |
| 2021 | £404,819 | 6% |
36 Properties |
| 2020 | £379,236 | -7% |
18 Properties |
| 2019 | £404,037 | -28% |
20 Properties |
| 2018 | £517,974 | 27% |
20 Properties |
| 2017 | £377,785 | 16% |
28 Properties |
| 2016 | £316,250 | -9% |
39 Properties |
| 2015 | £346,146 | 15% |
39 Properties |
| 2014 | £293,607 | 11% |
32 Properties |
| 2013 | £262,734 | -9% |
16 Properties |
| 2012 | £287,437 | 6% |
16 Properties |
| 2011 | £270,583 | -10% |
21 Properties |
| 2010 | £297,175 | 25% |
18 Properties |
| 2009 | £223,571 | -1% |
14 Properties |
| 2008 | £226,500 | -41% |
20 Properties |
| 2007 | £318,794 | 19% |
35 Properties |
| 2006 | £258,943 | 10% |
37 Properties |
| 2005 | £232,191 | -17% |
18 Properties |
| 2004 | £272,626 | 22% |
31 Properties |
| 2003 | £212,383 | -9% |
35 Properties |
| 2002 | £232,406 | 35% |
35 Properties |
| 2001 | £151,085 | 6% |
40 Properties |
| 2000 | £141,978 | 18% |
38 Properties |
| 1999 | £116,816 | -2% |
32 Properties |
| 1998 | £119,425 | 28% |
35 Properties |
| 1997 | £86,122 | 12% |
26 Properties |
| 1996 | £76,116 | 11% |
18 Properties |
| 1995 | £68,096 | - |
17 Properties |
Property Price per Property Type in Bardwell
Here you can find historic sold price data in order to help with your property search.
The average Property Paid Price for specific property types in the last three years are:
| Property Type | Average Sold Price | Sold Properties |
|---|---|---|
| Semi Detached House | £278,312.00 | 16 Semi Detached Houses |
| Detached House | £482,977.00 | 22 Detached Houses |
| Terraced House | £252,333.00 | 3 Terraced Houses |

