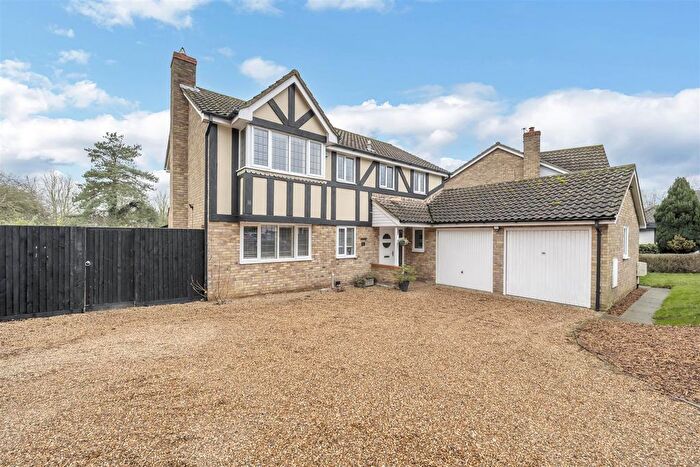
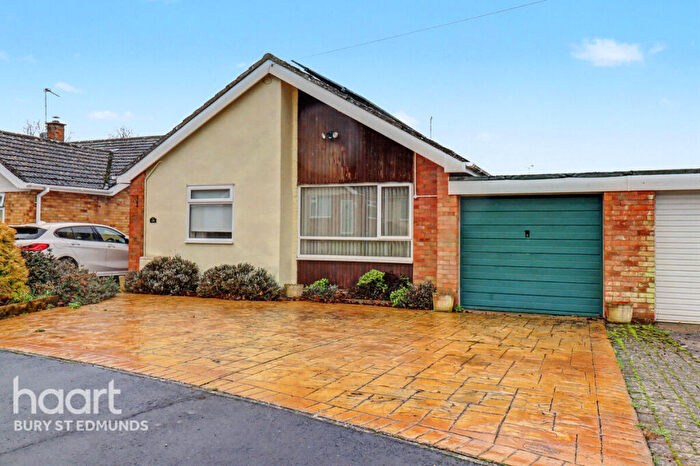
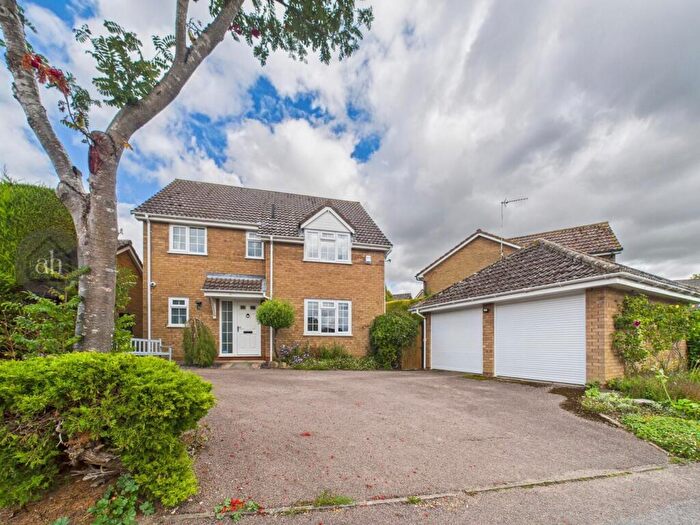
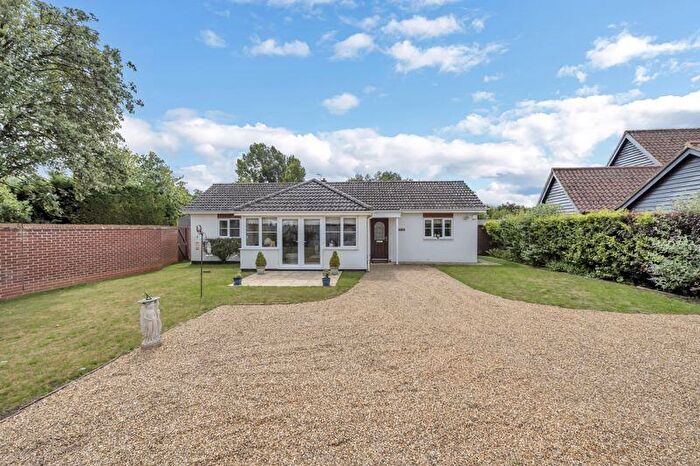
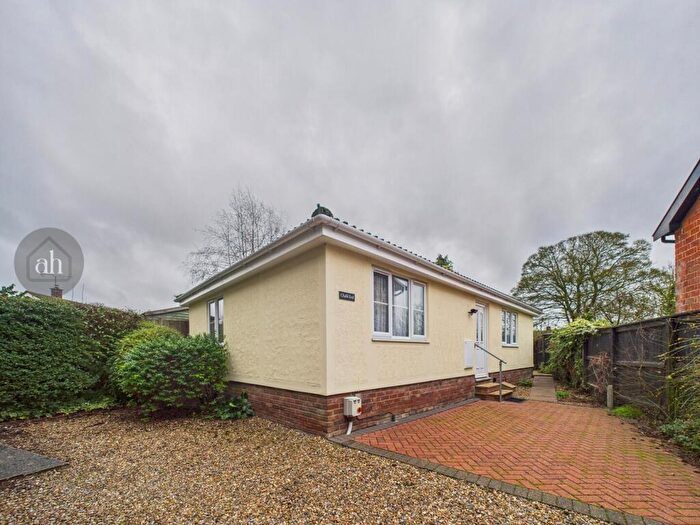
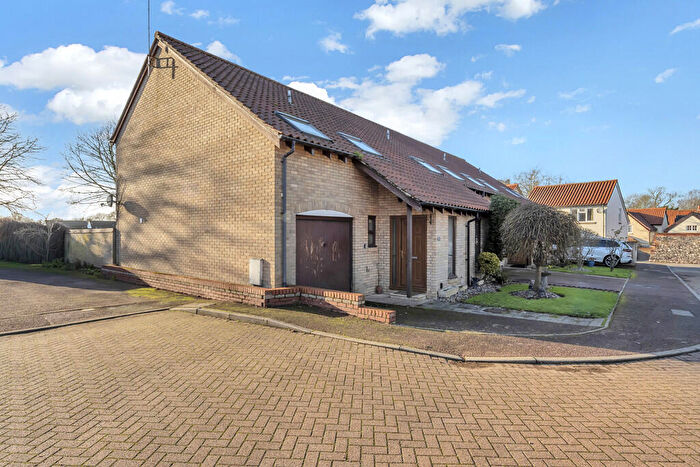
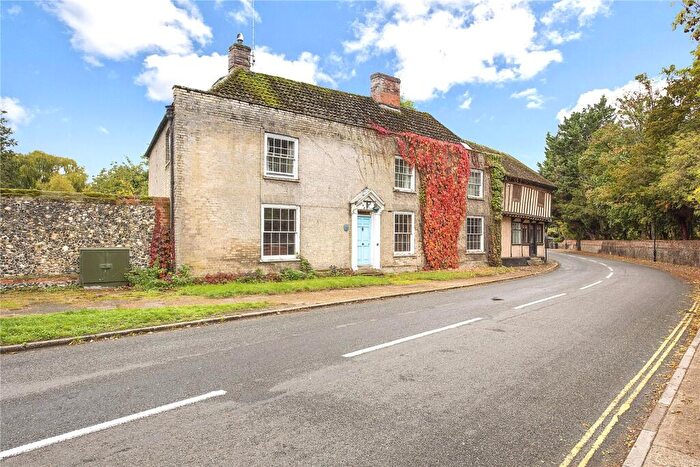
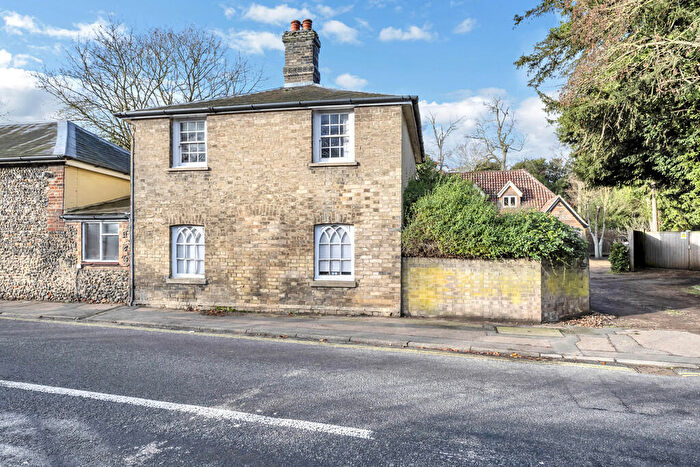
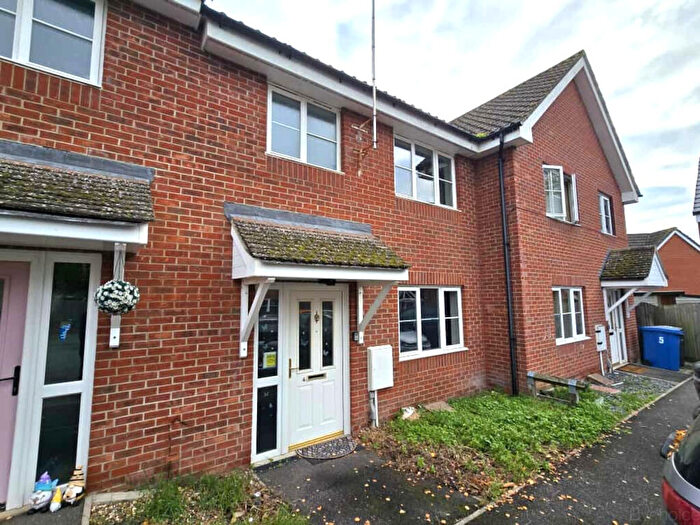
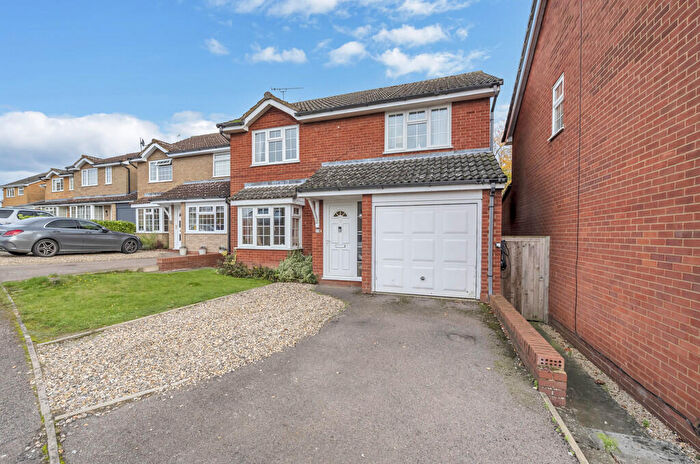
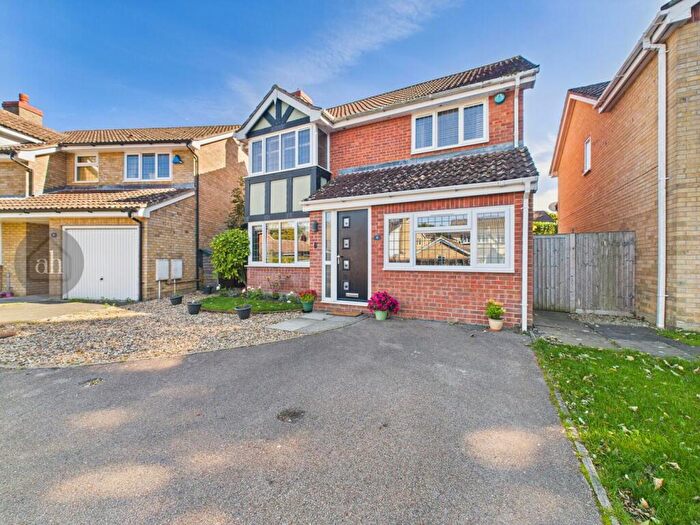
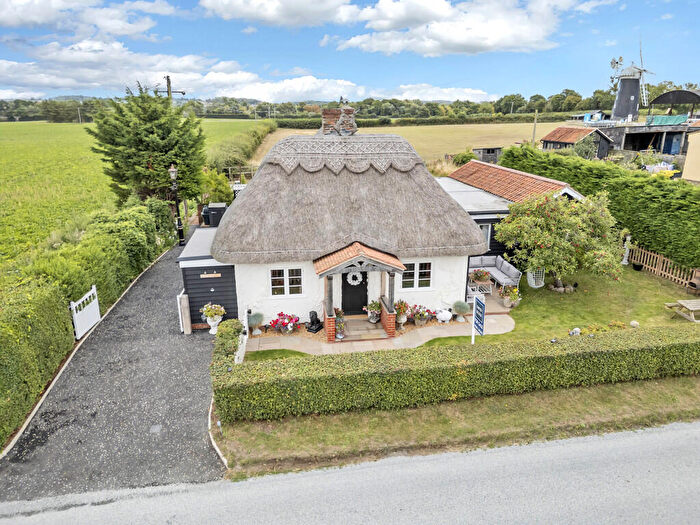
Houses for sale & to rent in Ixworth, Bury St Edmunds
House Prices in Ixworth
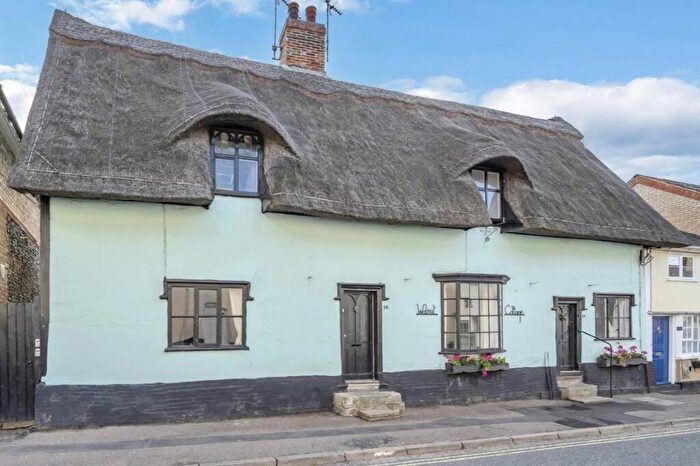
Properties in Ixworth have an average house price of £372,963.00 and had 68 Property Transactions within the last 3 years¹.
Ixworth is an area in Bury St Edmunds, Suffolk with 890 households², where the most expensive property was sold for £1,450,000.00.
Properties for sale in Ixworth
Previously listed properties in Ixworth
Roads and Postcodes in Ixworth
Navigate through our locations to find the location of your next house in Ixworth, Bury St Edmunds for sale or to rent.
| Streets | Postcodes |
|---|---|
| Abbey Close | IP31 2HF |
| Baileypool | IP31 2LY |
| Bardwell Road | IP31 1QR |
| Beeches Close | IP31 2EW |
| Carpenter Close | IP31 2FX |
| Chalk Lane | IP31 2JQ |
| Chalk Terrace | IP31 2HW |
| Coddington Way | IP31 2ET |
| Coltsfoot Close | IP31 2NJ |
| Commister Lane | IP31 2HE IP31 2GL |
| Crown Crescent | IP31 2EJ |
| Crown Lane | IP31 2EH IP31 2EL |
| Crown Mews | IP31 2NA |
| Dover Terrace | IP31 2JD |
| Field Barn Road | IP31 1QL |
| Fordham Place | IP31 2GJ |
| Garrard Place | IP31 2EP |
| Gough Place | IP31 2ES |
| Green Lane | IP31 1QN |
| Heath Road | IP31 2JP |
| High Street | IP31 2HH IP31 2HJ IP31 2HN IP31 2HT |
| Kettleborrow Close | IP31 2UN |
| Lower Farm Drive | IP31 2JW |
| Manor Cottages | IP31 1QJ |
| Micklesmere Drive | IP31 2UJ |
| New Road | IP31 2EN |
| Park Yard | IP31 2HL |
| Peacock Rise | IP31 2JA |
| Peasecroft Road | IP31 2EZ |
| Peddars Close | IP31 2HA |
| Plummer Close | IP31 2UL |
| Reeve Close | IP31 2GY |
| Saddlers Yard | IP31 2HY |
| Scott Road | IP31 2ER |
| St Edmund Close | IP31 2HP |
| Stow Lane | IP31 2FQ |
| Stow Road | IP31 2HZ IP31 2JB |
| Street Farm Lane | IP31 2JE IP31 2JF |
| The Paddock | IP31 2HG |
| Thetford Road | IP31 2EX IP31 1QP IP31 2EU IP31 2HB IP31 1QW IP31 2EY IP31 2HD |
| Thistledown Drive | IP31 2NH |
| Thomas Close | IP31 2UQ |
| Walsham Road | IP31 2HS |
| IP31 2HR IP31 1QH IP31 2HQ IP31 2JN IP31 2UX IP31 2WF IP31 2WX IP31 2XU |
Transport near Ixworth
- FAQ
- Price Paid By Year
- Property Type Price
Frequently asked questions about Ixworth
What is the average price for a property for sale in Ixworth?
The average price for a property for sale in Ixworth is £372,963. This amount is 6% higher than the average price in Bury St Edmunds. There are 160 property listings for sale in Ixworth.
What streets have the most expensive properties for sale in Ixworth?
The streets with the most expensive properties for sale in Ixworth are St Edmund Close at an average of £655,000, Commister Lane at an average of £610,000 and Crown Lane at an average of £450,000.
What streets have the most affordable properties for sale in Ixworth?
The streets with the most affordable properties for sale in Ixworth are Park Yard at an average of £135,000, New Road at an average of £230,000 and Garrard Place at an average of £235,000.
Which train stations are available in or near Ixworth?
Some of the train stations available in or near Ixworth are Thurston, Elmswell and Bury St.Edmunds.
Property Price Paid in Ixworth by Year
The average sold property price by year was:
| Year | Average Sold Price | Price Change |
Sold Properties
|
|---|---|---|---|
| 2025 | £406,083 | 13% |
24 Properties |
| 2024 | £351,416 | -2% |
24 Properties |
| 2023 | £359,075 | -11% |
20 Properties |
| 2022 | £399,067 | -6% |
37 Properties |
| 2021 | £423,621 | 19% |
39 Properties |
| 2020 | £341,803 | 12% |
28 Properties |
| 2019 | £300,302 | -14% |
23 Properties |
| 2018 | £342,500 | 2% |
38 Properties |
| 2017 | £337,081 | 15% |
36 Properties |
| 2016 | £286,382 | 0,3% |
26 Properties |
| 2015 | £285,483 | 8% |
52 Properties |
| 2014 | £261,606 | 9% |
37 Properties |
| 2013 | £237,681 | 5% |
43 Properties |
| 2012 | £224,671 | -1% |
32 Properties |
| 2011 | £227,296 | -1% |
16 Properties |
| 2010 | £230,564 | 4% |
31 Properties |
| 2009 | £220,695 | -20% |
23 Properties |
| 2008 | £264,664 | 3% |
24 Properties |
| 2007 | £255,994 | 7% |
53 Properties |
| 2006 | £239,334 | 24% |
55 Properties |
| 2005 | £182,470 | -6% |
43 Properties |
| 2004 | £193,108 | 8% |
52 Properties |
| 2003 | £177,722 | 10% |
47 Properties |
| 2002 | £159,584 | 17% |
50 Properties |
| 2001 | £132,801 | 14% |
41 Properties |
| 2000 | £114,323 | 16% |
38 Properties |
| 1999 | £96,141 | 11% |
47 Properties |
| 1998 | £85,295 | 5% |
38 Properties |
| 1997 | £81,434 | 11% |
52 Properties |
| 1996 | £72,532 | -6% |
45 Properties |
| 1995 | £76,555 | - |
26 Properties |
Property Price per Property Type in Ixworth
Here you can find historic sold price data in order to help with your property search.
The average Property Paid Price for specific property types in the last three years are:
| Property Type | Average Sold Price | Sold Properties |
|---|---|---|
| Semi Detached House | £277,045.00 | 11 Semi Detached Houses |
| Detached House | £433,178.00 | 42 Detached Houses |
| Terraced House | £268,607.00 | 14 Terraced Houses |
| Flat | £360,000.00 | 1 Flat |

