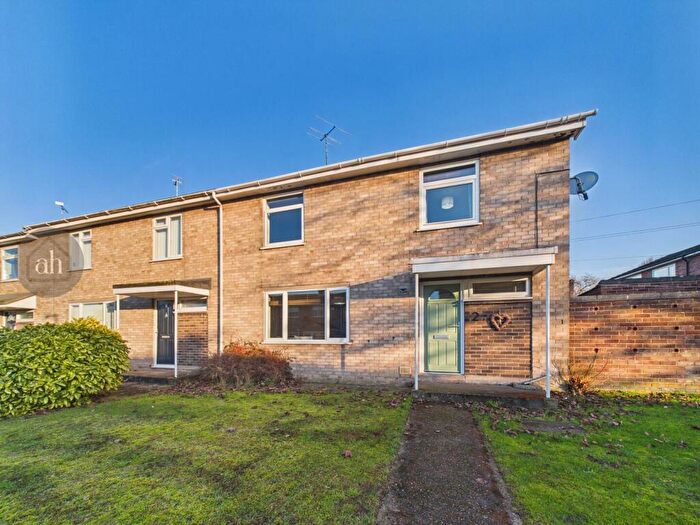
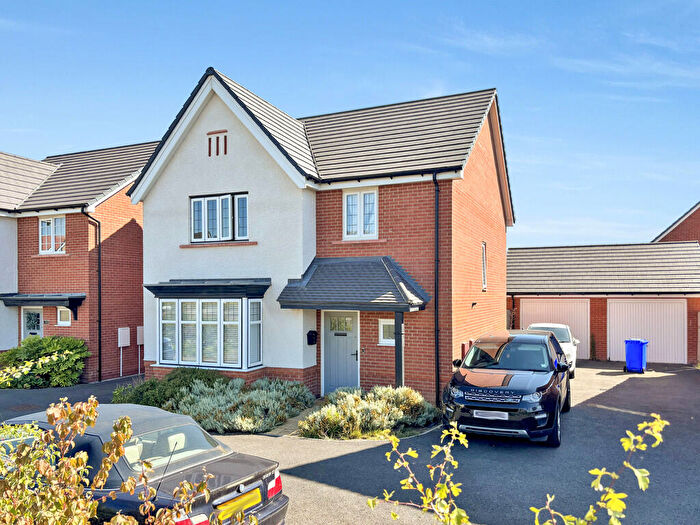
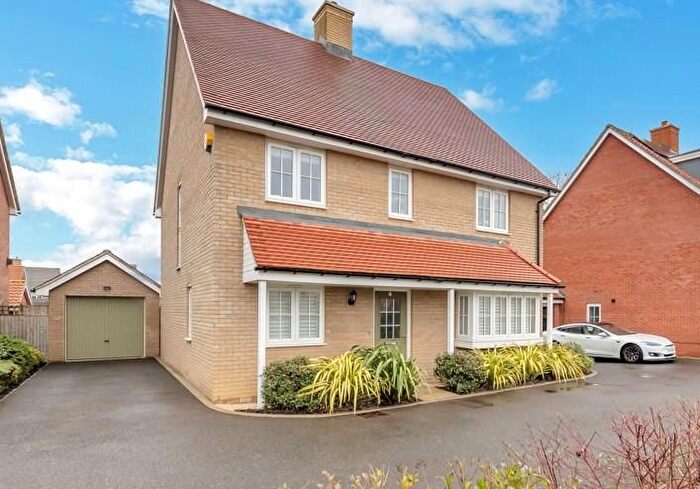
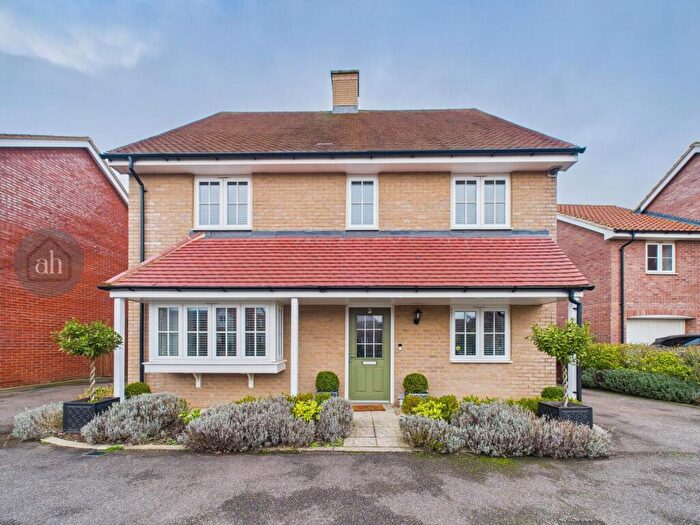
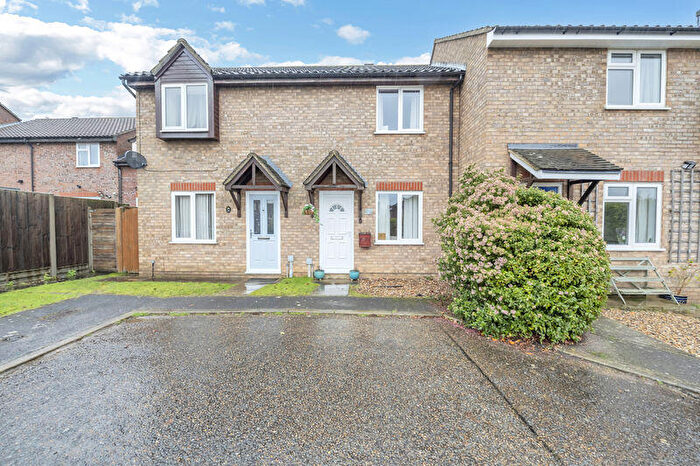
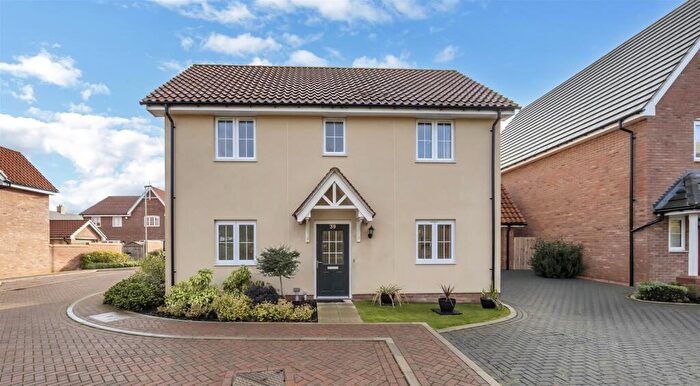
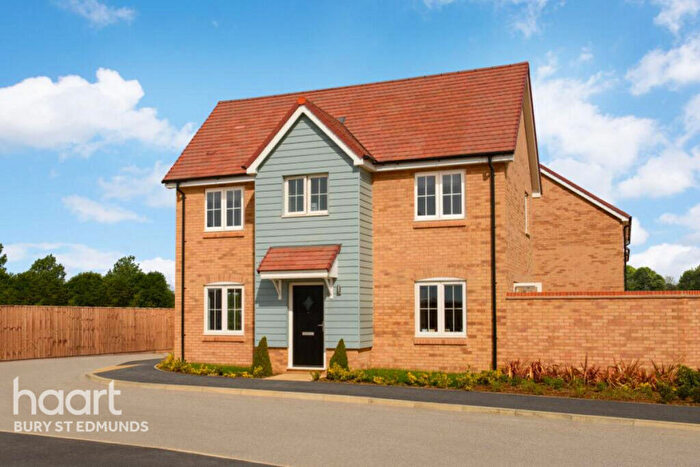
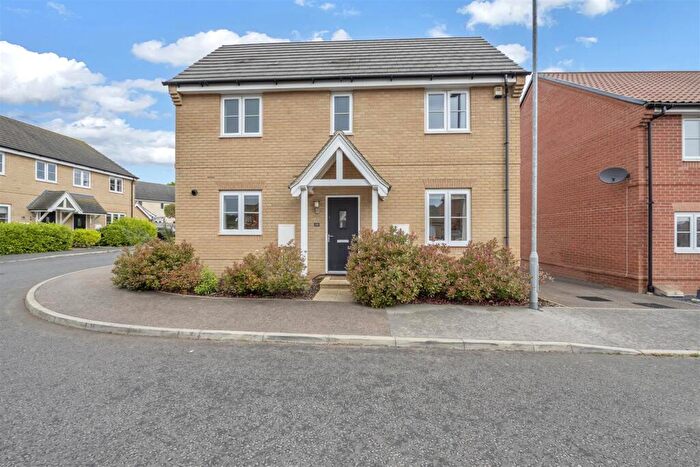
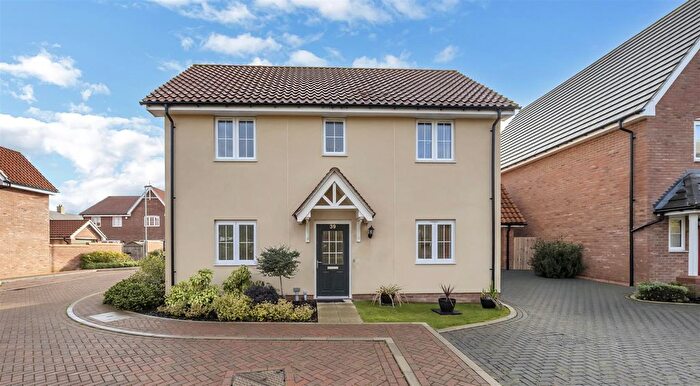
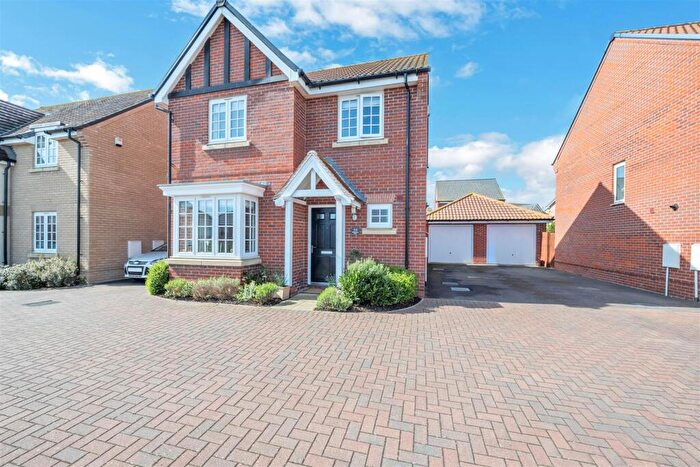
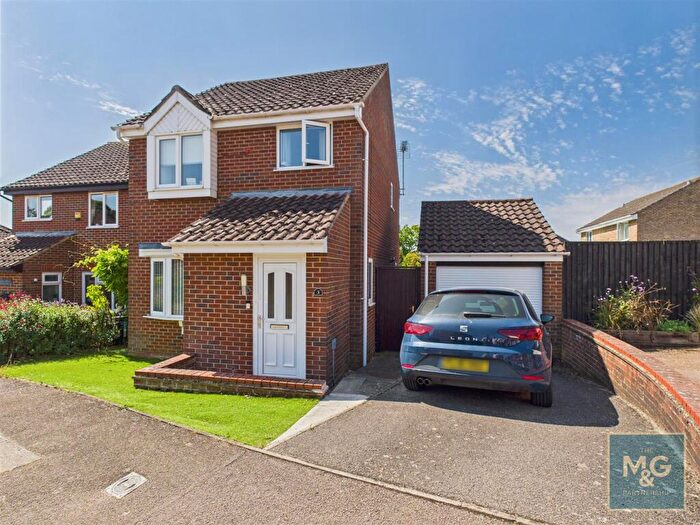
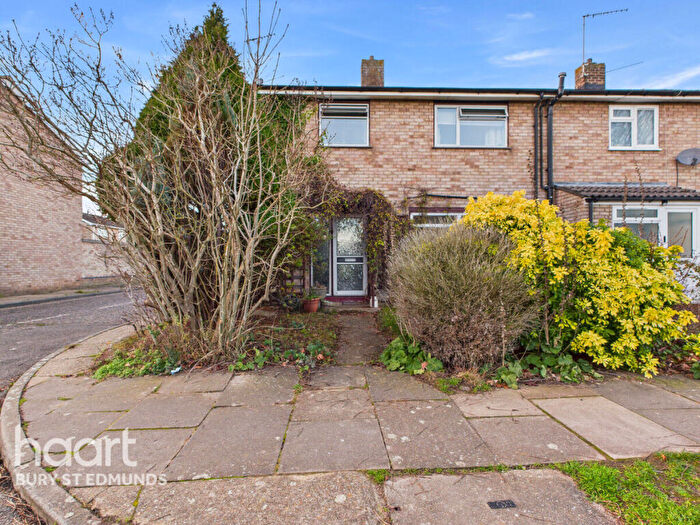
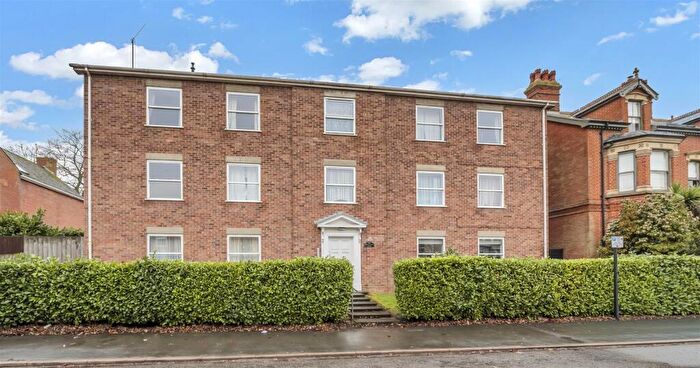
Houses for sale & to rent in St Olaves, Bury St Edmunds
House Prices in St Olaves
Properties in St Olaves have an average house price of £260,310.00 and had 178 Property Transactions within the last 3 years¹.
St Olaves is an area in Bury St Edmunds, Suffolk with 1,876 households², where the most expensive property was sold for £641,995.00.
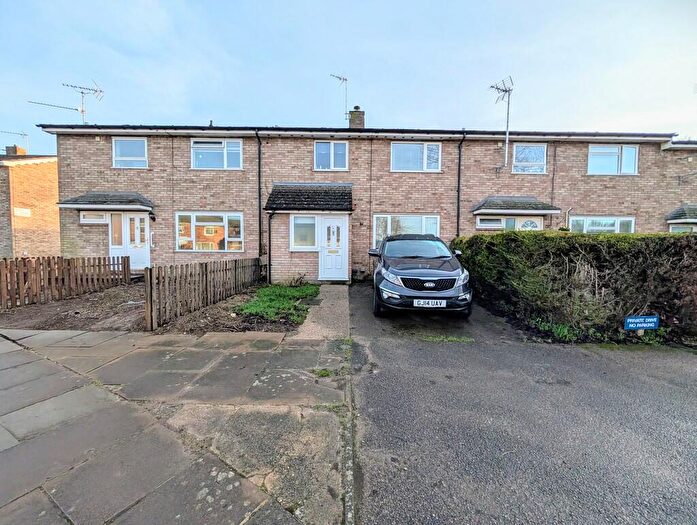
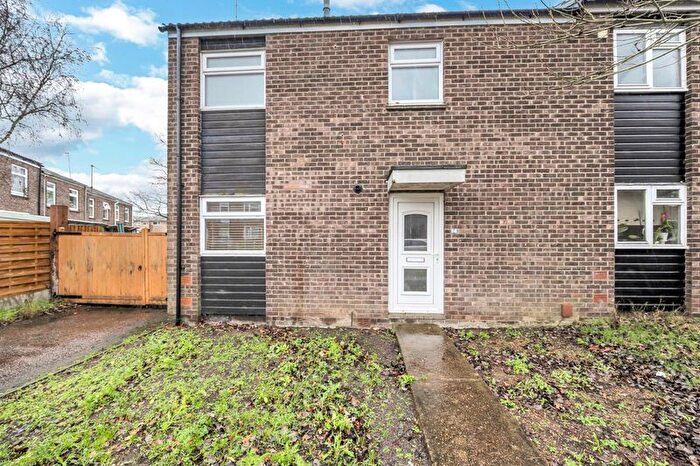
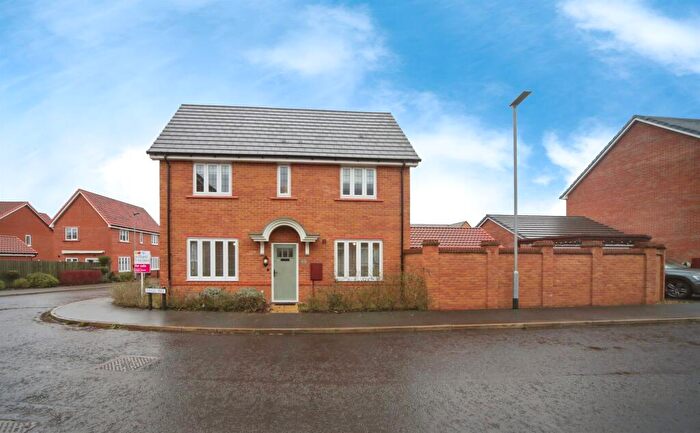
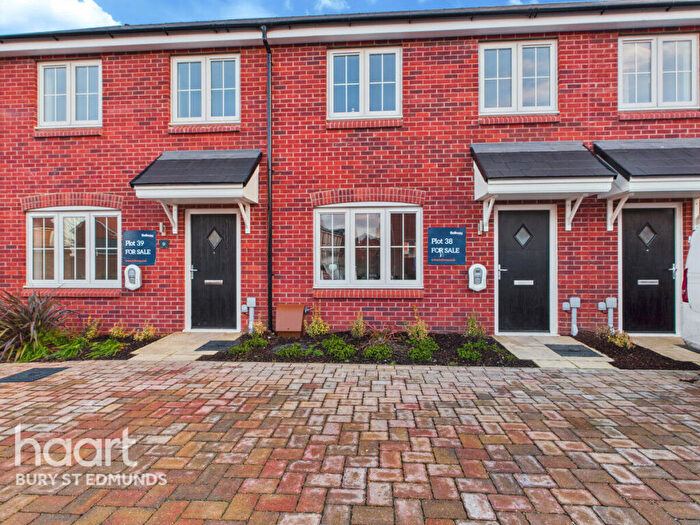
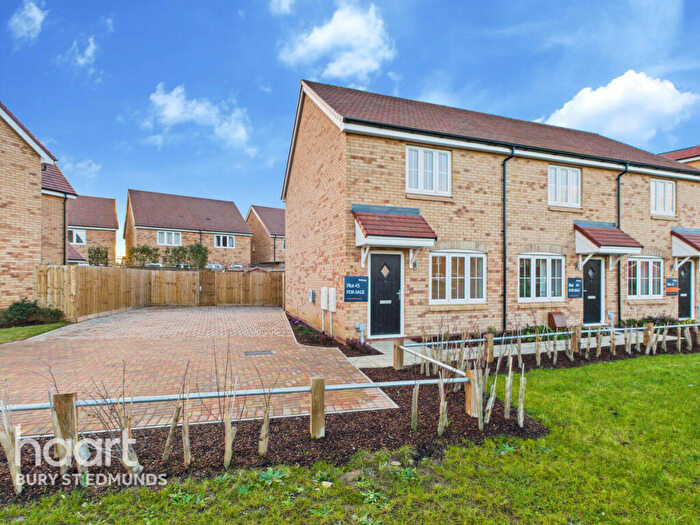
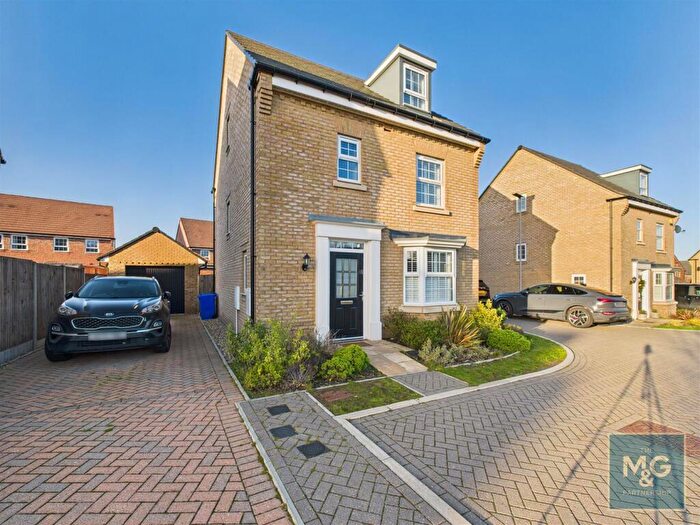
Properties for sale in St Olaves
Roads and Postcodes in St Olaves
Navigate through our locations to find the location of your next house in St Olaves, Bury St Edmunds for sale or to rent.
| Streets | Postcodes |
|---|---|
| Anderson Walk | IP32 6QH IP32 6QP |
| Andrews Walk | IP32 6SJ |
| Baldwin Avenue | IP32 6DS IP32 6DP IP32 6DW IP32 6DT |
| Beard Road | IP32 6SA |
| Bedford Road | IP32 6LT |
| Beetons Way | IP32 6RE IP32 6RQ IP32 6RB IP32 6SX |
| Blackthorn Walk | IP32 6TA |
| Boby Road | IP32 6SN IP32 6SU IP32 6ST IP32 6SZ |
| Braddock Square | IP32 6PL IP32 6QU |
| Bridgeman Walk | IP32 6PD IP32 6PE |
| Cambridge Walk | IP32 6LX |
| Cargo Lane | IP32 6FW |
| Charles Place | IP32 6TD |
| Chase Road | IP32 6NT |
| Clark Walk | IP32 6QQ |
| Clay Road | IP32 6QZ IP32 6RY IP32 6RX |
| Collis Close | IP32 6GP |
| Cornish Walk | IP32 6SE |
| Cossie Close | IP32 6TZ |
| Creed Walk | IP32 6PZ IP32 6QB |
| Cumberland Avenue | IP32 6TG |
| Curtis Road | IP32 6DR IP32 6DY |
| Davoren Walk | IP32 6QA |
| Deck Walk | IP32 6PG IP32 6PQ |
| Devon Close | IP32 6LU |
| Dunnell Way | IP32 6TJ IP32 6TQ IP32 6UB |
| Durham Close | IP32 6TH |
| Eagle Walk | IP32 6RJ |
| Everard Close | IP32 6RU |
| Felton Walk | IP32 6QR |
| Firtree Close | IP32 6QN |
| Flemish Avenue | IP32 6GD |
| Floyd Road | IP32 6SL |
| Frances Street | IP32 6SY |
| Gloucester Road | IP32 6DL |
| Goddard Street | IP32 6FZ IP32 6GB IP32 6GE |
| Goldsmith Close | IP32 6QT |
| Gorst Close | IP32 6TL |
| Great Hall Drive | IP32 6FL |
| Hawthorn Close | IP32 6TB |
| Hertford Close | IP32 6LY |
| Hodson Close | IP32 6RS |
| Hopwoods Road | IP32 6GJ |
| Howard Road | IP32 6SS |
| Hunter Road | IP32 6SH IP32 6SW |
| Ion Road | IP32 6RZ |
| Kenmare Close | IP32 6TT |
| Lamdin Road | IP32 6NU |
| Lancaster Avenue | IP32 6LW |
| Le Grice Walk | IP32 6RD |
| Leech Walk | IP32 6RG |
| Lynn Way | IP32 6GG |
| Mannock Drive | IP32 6TU |
| Mansfield Road | IP32 6GL |
| Martin Reed Walk | IP32 6FG |
| Mcintyre Walk | IP32 6PB IP32 6PF IP32 6PJ |
| Merchant Avenue | IP32 6FB IP32 6FD |
| Myrtlewood Road | IP32 6TR IP32 6TS |
| Northern Way | IP32 6NH IP32 6NN IP32 6NW |
| Northumberland Avenue | IP32 6LR IP32 6LP IP32 6LS IP32 6NA IP32 6ND |
| Nunn Square | IP32 6SG IP32 6SQ |
| Oakes Close | IP32 6QE |
| Oakes Road | IP32 6PA IP32 6PW IP32 6PX IP32 6QF IP32 6QS IP32 6PH IP32 6PU IP32 6QD |
| Osbourne Way | IP32 6GY |
| Parkington Walk | IP32 6QY IP32 6QG IP32 6QJ IP32 6QX |
| Pettits Drive | IP32 6GT |
| Pretty Close | IP32 6GX |
| Prigg Walk | IP32 6PP |
| Purdys Close | IP32 6GQ |
| Redwood Drive | IP32 6TN |
| Rendell Crescent | IP32 6FP |
| Robinson Walk | IP32 6PY |
| Salmon Walk | IP32 6PS |
| Sam Weller Walk | IP32 6FH |
| Severn Road | IP32 6NE |
| Shearing Street | IP32 6FE |
| Silk Close | IP32 6FT |
| Simcoe Road | IP32 6FR |
| Simpson Way | IP32 6GN |
| Spinning Lane | IP32 6FF |
| St Olaves Road | IP32 6RL IP32 6RR IP32 6RT IP32 6RN IP32 6RP IP32 6GA IP32 6RW |
| Suffolk Road | IP32 6LZ |
| Summers Road | IP32 6SB IP32 6SD IP32 6SF |
| Sussex Road | IP32 6TE |
| The Lark Valley Trade Park | IP32 6LJ |
| Thompson Walk | IP32 6PT IP32 6PR |
| Tollcott Drive | IP32 6GF |
| Tollgate Lane | IP32 6DE |
| Trevethan Close | IP32 6PN |
| Trigg Way | IP32 6UA |
| Tudor Road | IP32 6FJ |
| Verna Street | IP32 6FU |
| Waits Close | IP32 6GZ |
| Warwick Drive | IP32 6TF |
| Weavers Lane | IP32 6FX |
| Westhorpe Avenue | IP32 6UD |
| Weston Drive | IP32 6TX |
| Wexford Way | IP32 6FN |
| Windell Drive | IP32 6TY |
| Wollaston Close | IP32 6QL |
| Woodburn Drive | IP32 6FY |
| Wool Road | IP32 6FS |
| Yarn Walk | IP32 6FA |
| IP32 6FQ IP32 6SP IP32 6TW |
Transport near St Olaves
- FAQ
- Price Paid By Year
- Property Type Price
Frequently asked questions about St Olaves
What is the average price for a property for sale in St Olaves?
The average price for a property for sale in St Olaves is £260,310. This amount is 26% lower than the average price in Bury St Edmunds. There are 534 property listings for sale in St Olaves.
What streets have the most expensive properties for sale in St Olaves?
The streets with the most expensive properties for sale in St Olaves are Great Hall Drive at an average of £542,330, Shearing Street at an average of £477,500 and Martin Reed Walk at an average of £435,000.
What streets have the most affordable properties for sale in St Olaves?
The streets with the most affordable properties for sale in St Olaves are Wollaston Close at an average of £101,000, Firtree Close at an average of £125,000 and Beetons Way at an average of £188,050.
Which train stations are available in or near St Olaves?
Some of the train stations available in or near St Olaves are Bury St.Edmunds, Thurston and Kennett.
Property Price Paid in St Olaves by Year
The average sold property price by year was:
| Year | Average Sold Price | Price Change |
Sold Properties
|
|---|---|---|---|
| 2025 | £274,405 | 4% |
58 Properties |
| 2024 | £264,001 | 7% |
54 Properties |
| 2023 | £244,905 | -27% |
66 Properties |
| 2022 | £312,102 | -5% |
78 Properties |
| 2021 | £328,604 | 3% |
119 Properties |
| 2020 | £317,873 | 0,1% |
103 Properties |
| 2019 | £317,594 | -2% |
146 Properties |
| 2018 | £323,914 | 37% |
124 Properties |
| 2017 | £202,447 | 7% |
50 Properties |
| 2016 | £188,053 | 13% |
47 Properties |
| 2015 | £163,685 | 5% |
56 Properties |
| 2014 | £155,003 | 10% |
49 Properties |
| 2013 | £139,165 | 5% |
49 Properties |
| 2012 | £132,640 | 3% |
41 Properties |
| 2011 | £128,625 | 3% |
38 Properties |
| 2010 | £124,936 | - |
46 Properties |
| 2009 | £124,904 | -8% |
43 Properties |
| 2008 | £134,897 | -8% |
40 Properties |
| 2007 | £145,265 | 6% |
74 Properties |
| 2006 | £137,068 | 8% |
83 Properties |
| 2005 | £125,995 | 10% |
61 Properties |
| 2004 | £113,015 | 14% |
66 Properties |
| 2003 | £97,248 | 20% |
81 Properties |
| 2002 | £77,774 | 11% |
82 Properties |
| 2001 | £68,983 | 19% |
91 Properties |
| 2000 | £55,657 | 4% |
71 Properties |
| 1999 | £53,472 | 11% |
78 Properties |
| 1998 | £47,704 | 7% |
64 Properties |
| 1997 | £44,516 | 5% |
71 Properties |
| 1996 | £42,268 | 0,3% |
52 Properties |
| 1995 | £42,151 | - |
38 Properties |
Property Price per Property Type in St Olaves
Here you can find historic sold price data in order to help with your property search.
The average Property Paid Price for specific property types in the last three years are:
| Property Type | Average Sold Price | Sold Properties |
|---|---|---|
| Semi Detached House | £261,758.00 | 51 Semi Detached Houses |
| Detached House | £424,110.00 | 32 Detached Houses |
| Terraced House | £215,179.00 | 84 Terraced Houses |
| Flat | £121,727.00 | 11 Flats |

