
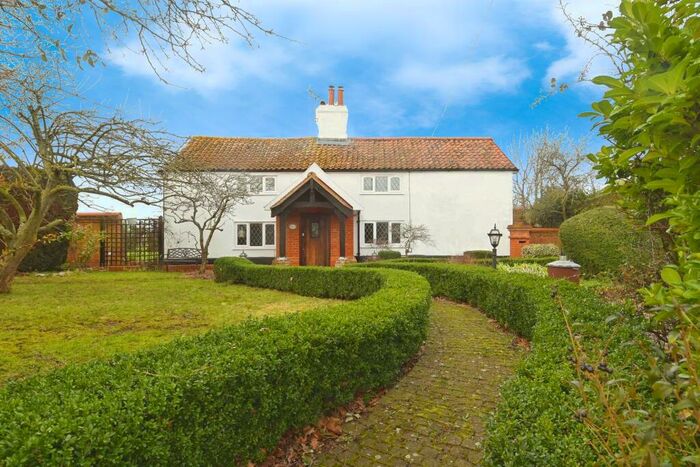
Houses for sale in Worlingworth, Eye
House Prices in Worlingworth
Properties in Worlingworth have an average house price of £499k and had 13 Property Transactions within the last 3 years¹.
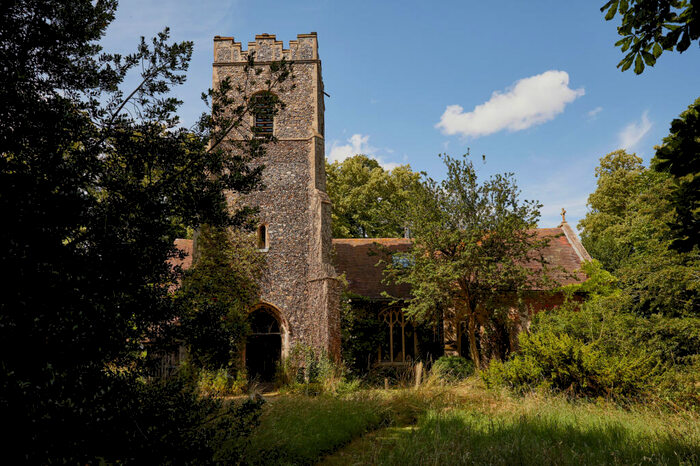
Worlingworth is an area in Eye, Suffolk with 153 households², where the most expensive property was sold for £880k.
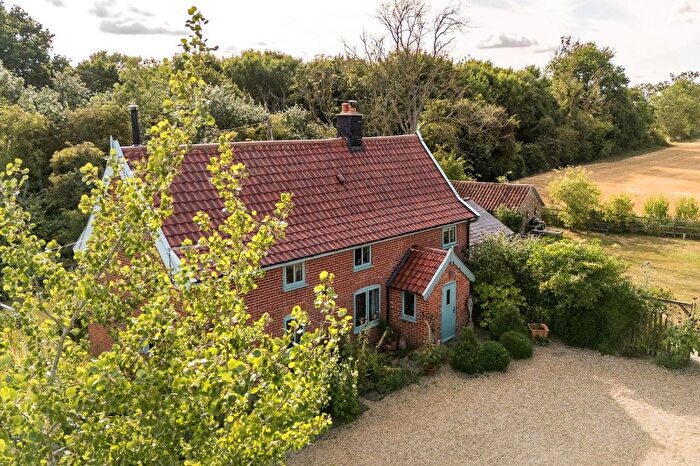
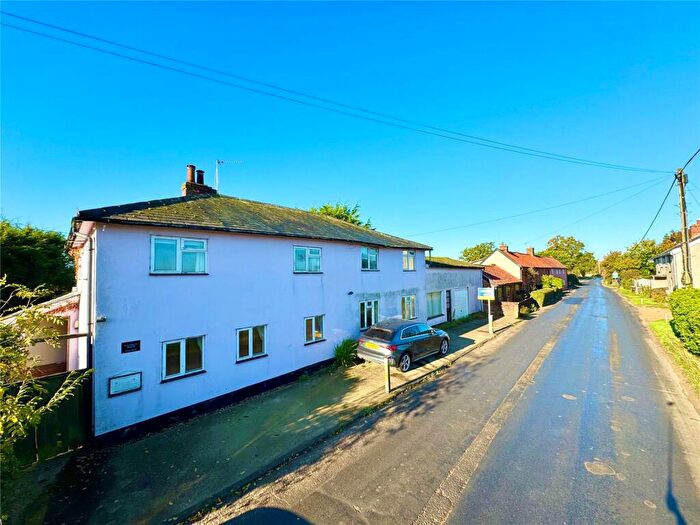
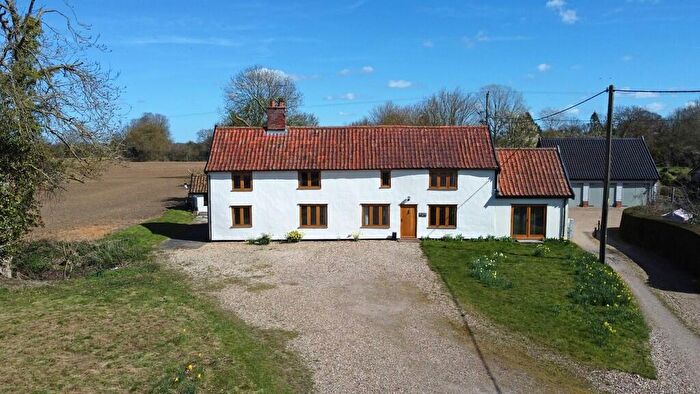
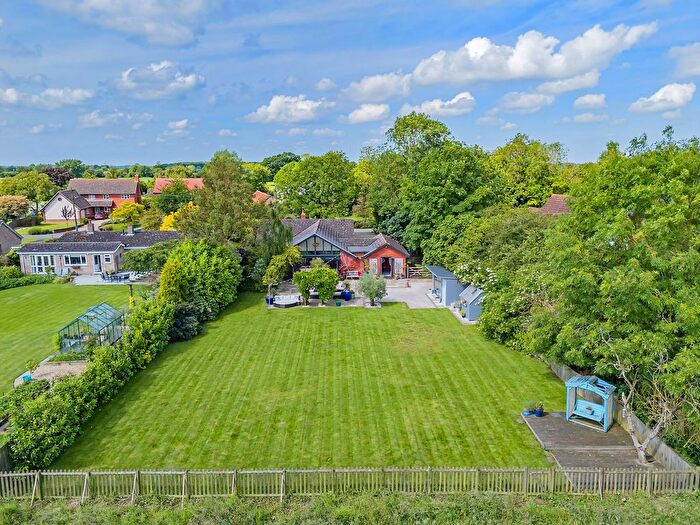
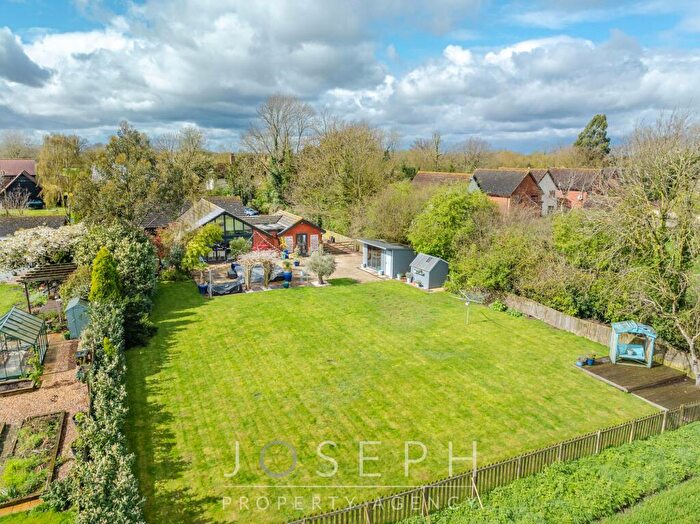
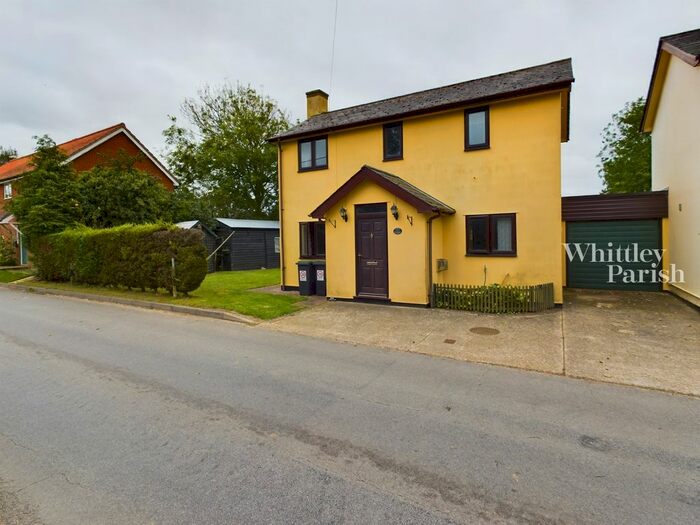
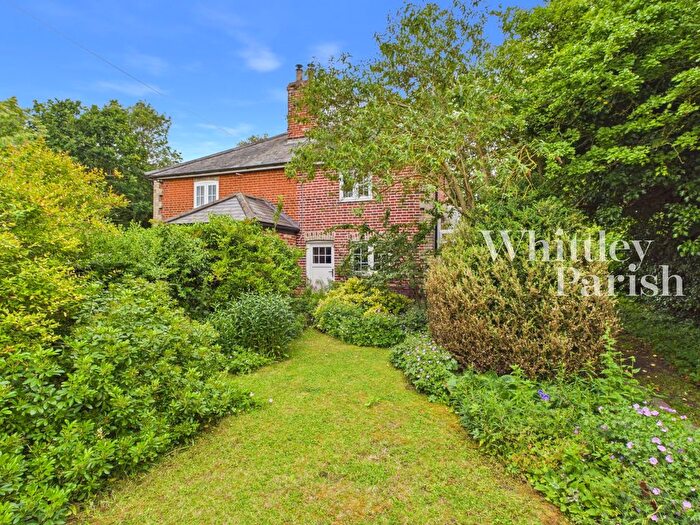
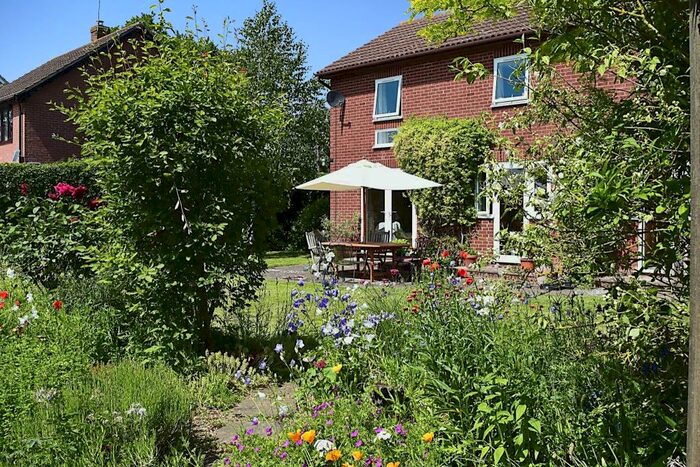
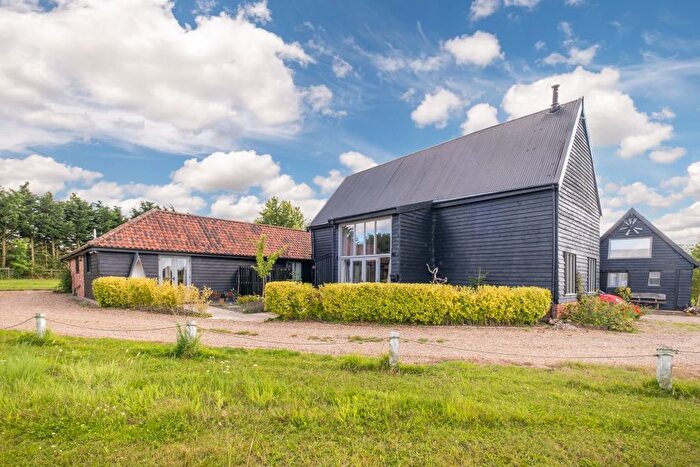
Properties for sale in Worlingworth
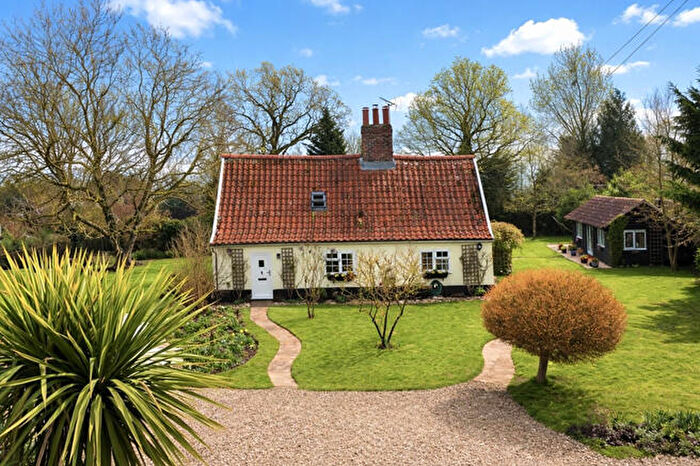
Previously listed properties in Worlingworth
![]()
If you are looking to sell your house, let it out, or receive a property valuation, an expert can help you.
Click the button below to get started.


Roads and Postcodes in Worlingworth
Navigate through our locations to find the location of your next house in Worlingworth, Eye for sale or to rent.
| Streets | Postcodes |
|---|---|
| Bedingfield Road | IP23 7JY |
| Bucks Green | IP23 7LG IP23 7LL |
| Church Corner | IP23 7QG |
| Dublin Road | IP23 7QB |
| Eye Road | IP23 7JX IP23 7JZ IP23 7LN |
| Hall Road | IP23 7LJ IP23 7QE IP23 7QF |
| Kenton Road | IP23 7LH |
| Park Road | IP23 7QW |
| Plash Road | IP23 7QD |
| The Street | IP23 7LQ IP23 7QJ |
| IP23 7QL |
Property price trends in Worlingworth
According to the latest Land Registry data, the average home in Worlingworth sold for £645,448 in 2026. That figure comes from 153 sales logged over the past 31 years.
Prices have continued to climb over the last three years. Compared with 2023, when the typical sale came in around £518,125, that's a rise of roughly 24.6%.
Looking back five years, average prices are up about 65.7% since 2021, a gain of around £255,865 in cash terms.
Zoom out to the past decade for the fuller picture. Back in 2016, homes here averaged £394,000, so the typical sold price has climbed about 63.8% since then, roughly 5.1% a year. Stretch the view to fifteen years and that annual pace edges up closer to 6.3%.
Frequently asked questions about Worlingworth
What is the average price for a property for sale in Worlingworth?
The average price for a property for sale in Worlingworth is £499,438. This amount is 24% higher than the average price in Eye. There are 38 property listings for sale in Worlingworth.
What streets have the most expensive properties for sale in Worlingworth?
The streets with the most expensive properties for sale in Worlingworth are Kenton Road at an average of £880,000, Eye Road at an average of £740,000 and Plash Road at an average of £575,000.
What streets have the most affordable properties for sale in Worlingworth?
The streets with the most affordable properties for sale in Worlingworth are Bucks Green at an average of £375,500, The Street at an average of £395,339 and Church Corner at an average of £480,000.
Which train stations are available in or near Worlingworth?
Some of the train stations available in or near Worlingworth are Diss, Stowmarket and Needham Market.
Property Price Paid in Worlingworth by Year
The average sold property price by year was:
| Year | Average Sold Price | Price Change |
Sold Properties
|
|---|---|---|---|
| 2026 | £645,448 | 24% |
1 Property |
| 2025 | £490,857 | 7% |
7 Properties |
| 2024 | £458,333 | -13% |
3 Properties |
| 2023 | £518,125 | 46% |
2 Properties |
| 2022 | £277,603 | -40% |
3 Properties |
| 2021 | £389,583 | 0,5% |
6 Properties |
| 2020 | £387,666 | 2% |
6 Properties |
| 2019 | £381,600 | 17% |
5 Properties |
| 2018 | £317,500 | -207% |
6 Properties |
| 2017 | £975,576 | 60% |
4 Properties |
Property Price per Property Type in Worlingworth
Here you can find historic sold price data in order to help with your property search.
The average Property Paid Price for specific property types in the last three years are:
| Property Type | Average Sold Price | Sold Properties |
|---|---|---|
| Terraced House | £295,000.00 | 3 Terraced Houses |
| Semi Detached House | £366,000.00 | 1 Semi Detached House |
| Detached House | £582,410.00 | 9 Detached Houses |
