Houses for sale & to rent in Worlingworth, Woodbridge
House Prices in Worlingworth
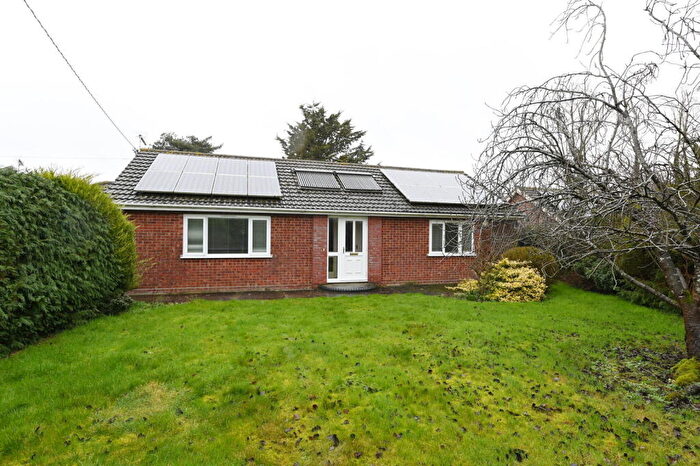
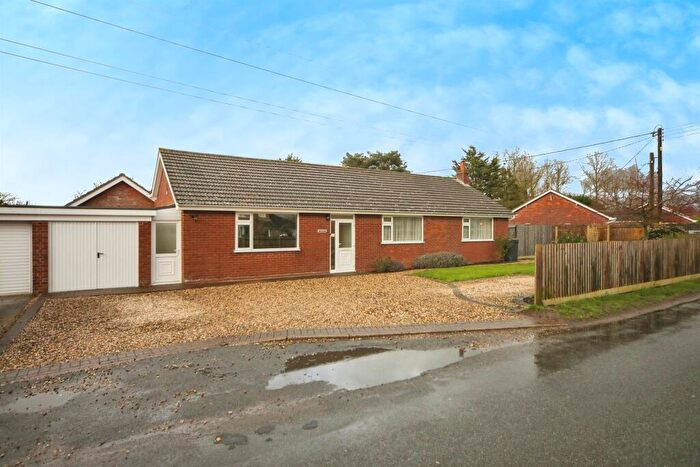
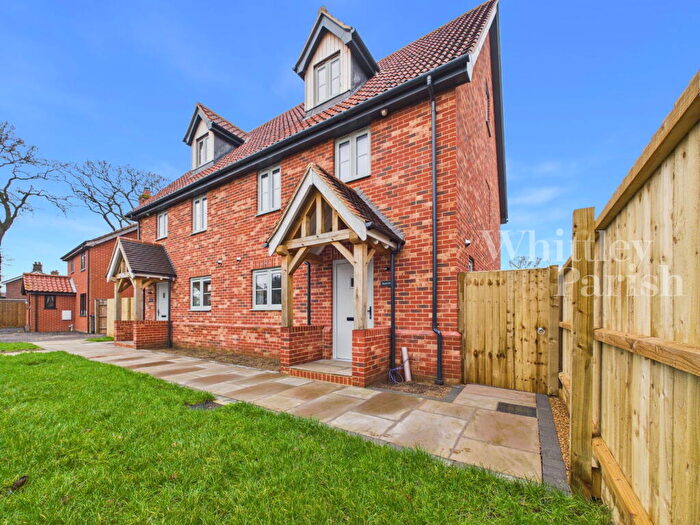
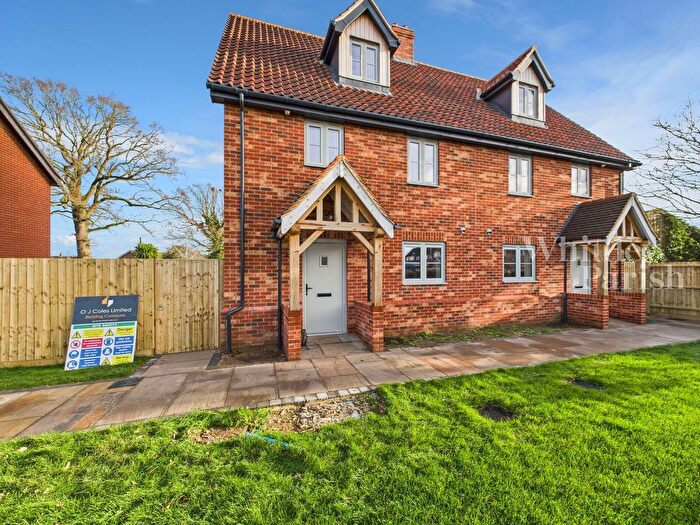
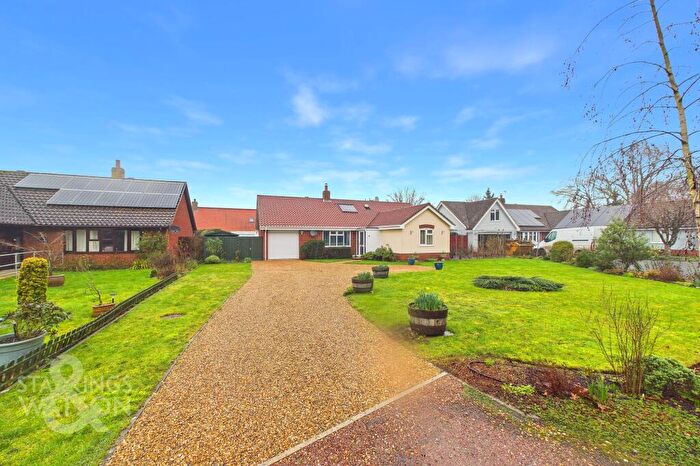
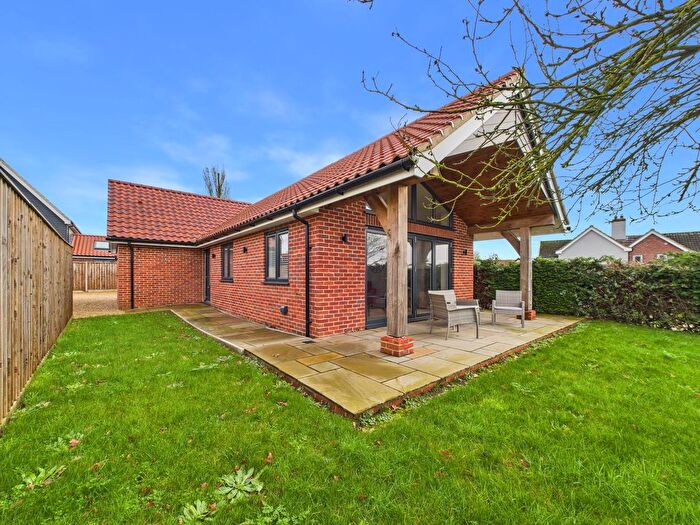
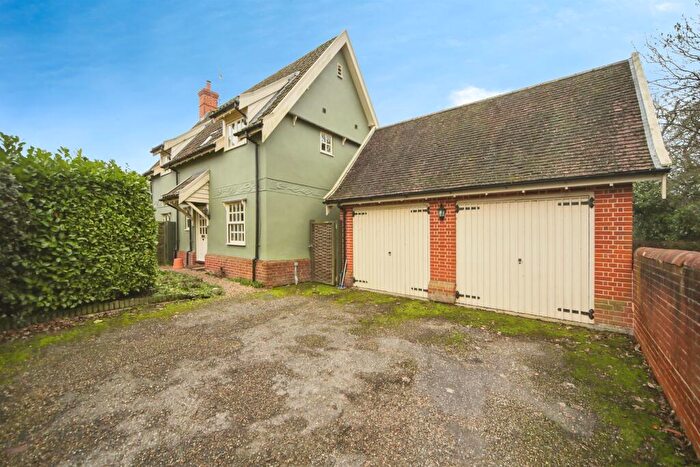
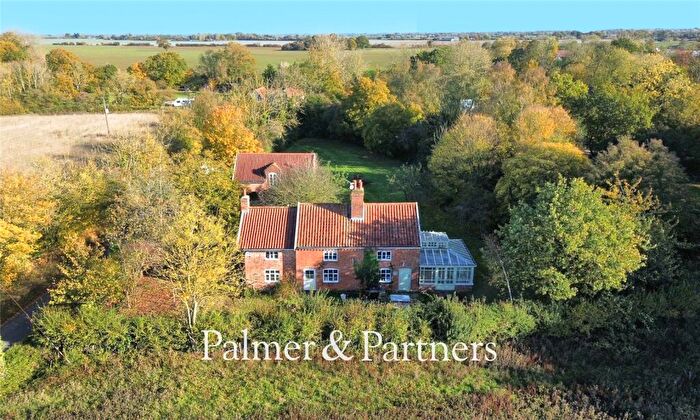
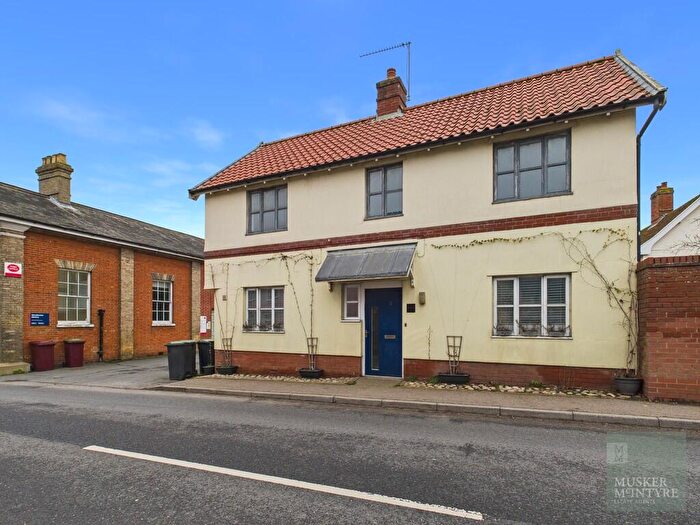
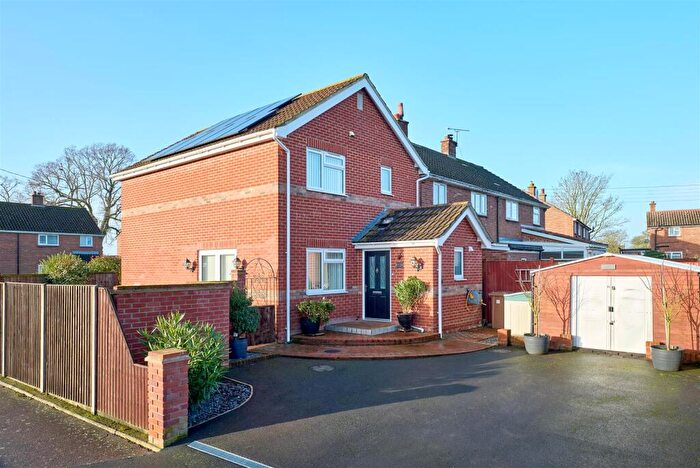
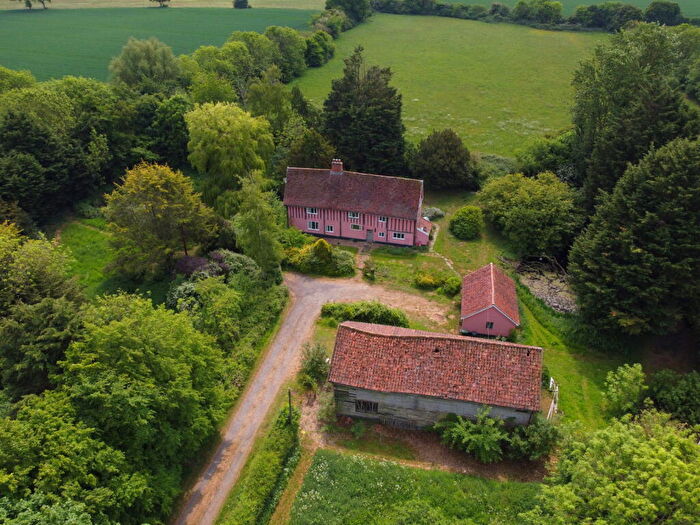
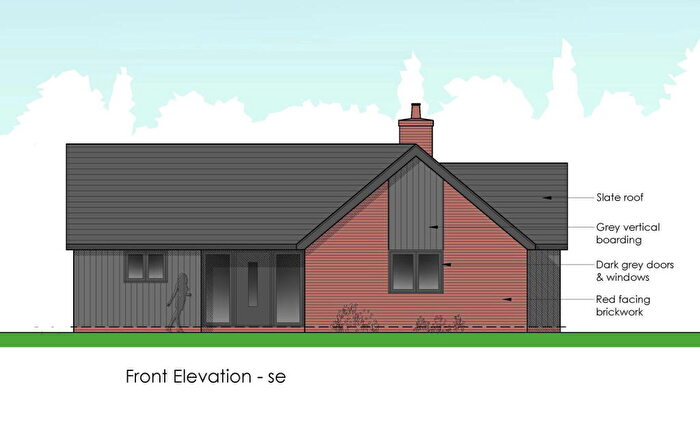
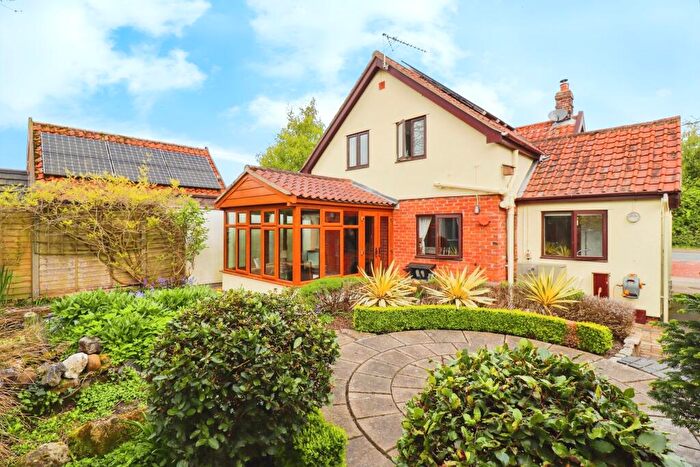
Properties in Worlingworth have an average house price of £455,059.00 and had 52 Property Transactions within the last 3 years¹.
Worlingworth is an area in Woodbridge, Suffolk with 561 households², where the most expensive property was sold for £1,400,000.00.
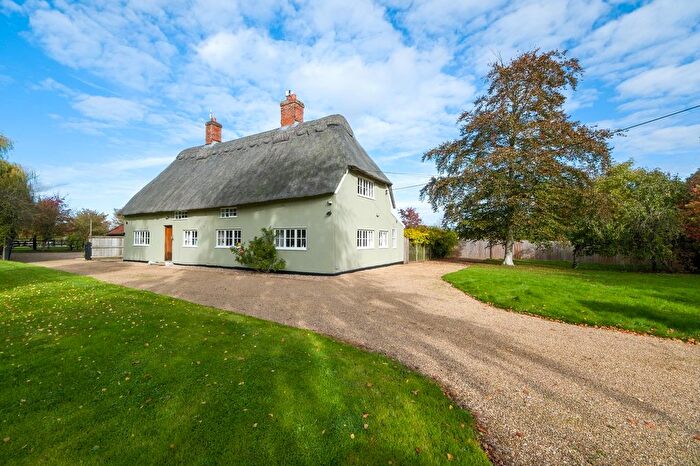
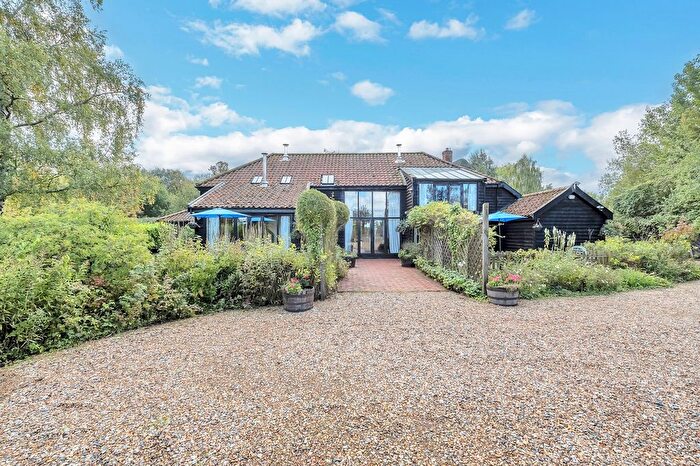
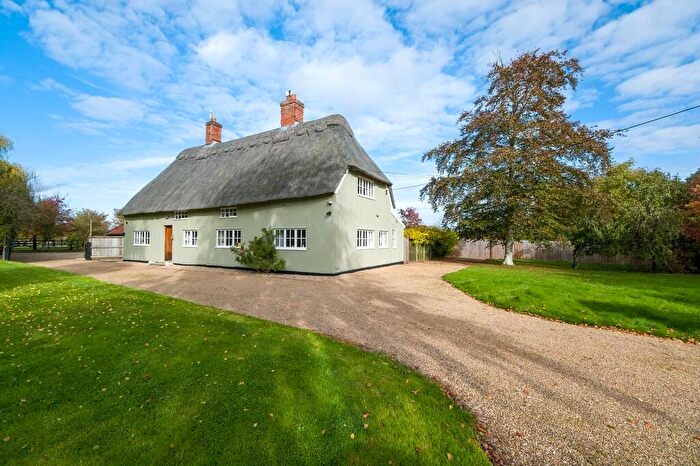
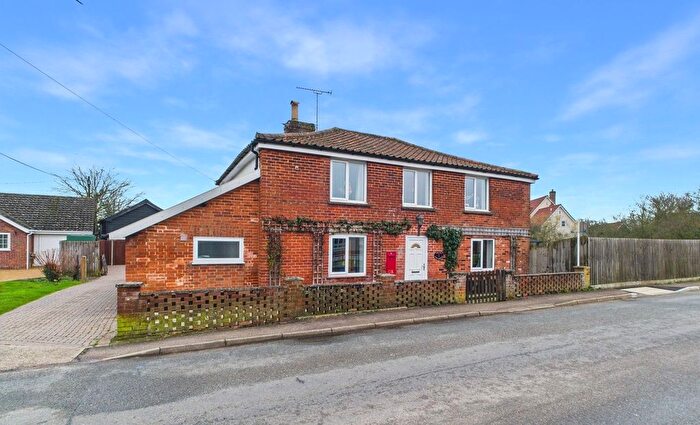
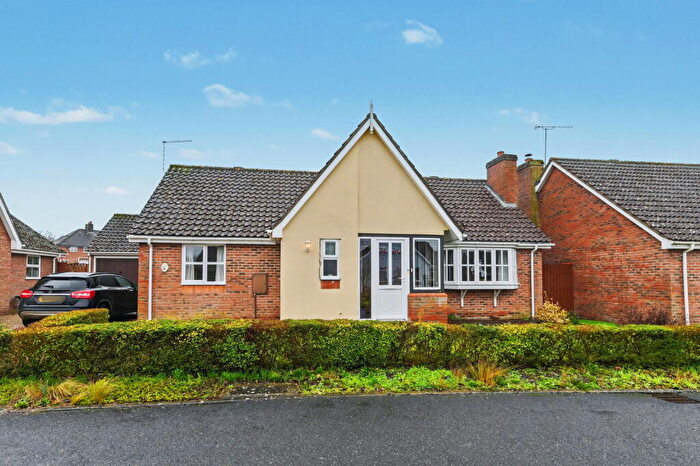
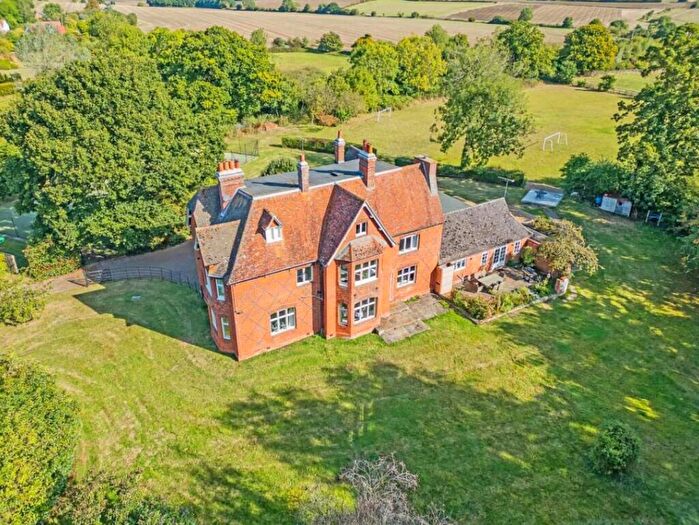
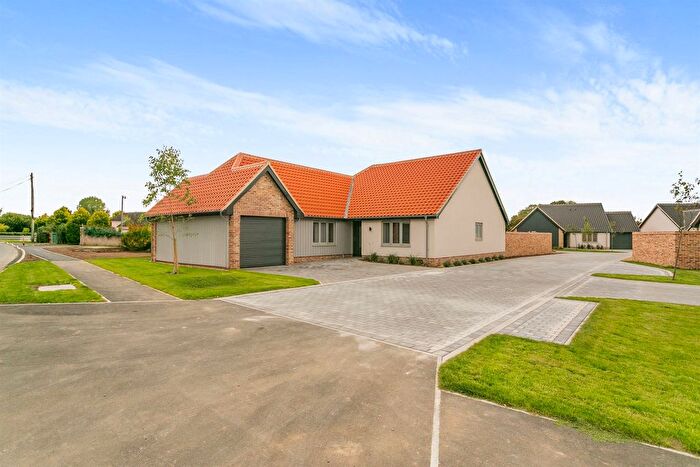
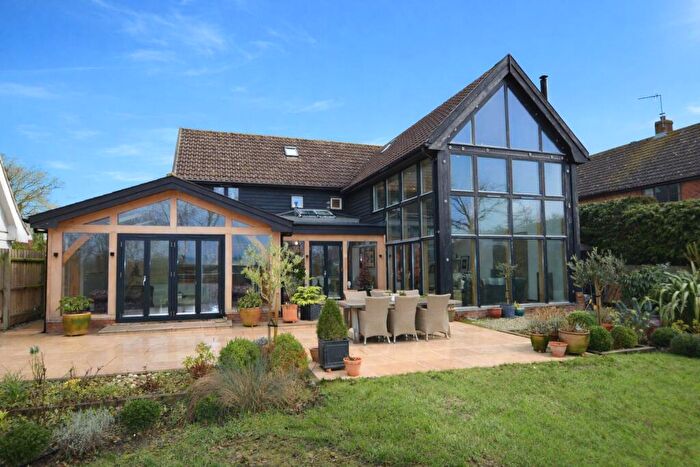
Properties for sale in Worlingworth
Roads and Postcodes in Worlingworth
Navigate through our locations to find the location of your next house in Worlingworth, Woodbridge for sale or to rent.
| Streets | Postcodes |
|---|---|
| Bedfield Road | IP13 7EJ |
| Chantry Cottages | IP13 8AZ |
| Church Lane | IP13 8BA |
| Church Road | IP13 7JJ IP13 7NU |
| Church Street | IP13 7NS IP13 7NT |
| Crown Corner | IP13 8BD |
| Earl Soham Road | IP13 7EE IP13 7EF |
| Fingal Street | IP13 7PD |
| Honeysuckle Cottages | IP13 7EA |
| Ivy Close | IP13 7PF |
| Jessop Close | IP13 7GX |
| Kenton Road | IP13 7HA |
| Laburnham Close | IP13 7HF |
| Long Green | IP13 7JD IP13 7JE IP13 7JF IP13 7JH IP13 7JQ |
| Low Road | IP13 7EP IP13 7ER |
| Maisies Meadow | IP13 7JL |
| Mill Road | IP13 7HN IP13 7HP |
| New Road | IP13 7PA |
| New Town | IP13 7HR |
| Oakfields | IP13 7EY |
| Old Stores Close | IP13 7JW |
| Park View | IP13 7HG |
| Pipers Meadow | IP13 7PG |
| School Road | IP13 7EN |
| Shop Street | IP13 7HT IP13 7HX IP13 7HY IP13 7JN |
| Southolt Road | IP13 7HH IP13 7HW |
| Stradbroke Road | IP13 8BG |
| Swan Road | IP13 7HZ |
| Tannington Long Road | IP13 8BE |
| Tannington Road | IP13 7JB |
| The Green | IP13 7ET IP13 7EX IP13 7EZ |
| The Street | IP13 8BL IP13 8BN IP13 8BP |
| The Thorofare | IP13 8BB |
| Tyes Corner | IP13 7PQ |
| Willow Farm Meadow | IP13 7RQ |
| Willow Green | IP13 7LP |
| IP13 7EB IP13 7EH IP13 7EL IP13 7EW IP13 7HB IP13 7LU IP13 7NF IP13 7NG IP13 7NN IP13 7NQ IP13 7PE IP13 8AY IP13 8BH IP13 8DA |
Transport near Worlingworth
-
Wickham Market Station
-
Diss Station
-
Saxmundham Station
-
Darsham Station
-
Melton Station
-
Halesworth Station
-
Needham Market Station
-
Woodbridge Station
-
Stowmarket Station
-
Westerfield Station
- FAQ
- Price Paid By Year
- Property Type Price
Frequently asked questions about Worlingworth
What is the average price for a property for sale in Worlingworth?
The average price for a property for sale in Worlingworth is £455,059. This amount is 8% higher than the average price in Woodbridge. There are 507 property listings for sale in Worlingworth.
What streets have the most expensive properties for sale in Worlingworth?
The streets with the most expensive properties for sale in Worlingworth are The Green at an average of £677,000, The Thorofare at an average of £625,000 and Church Street at an average of £600,000.
What streets have the most affordable properties for sale in Worlingworth?
The streets with the most affordable properties for sale in Worlingworth are Willow Green at an average of £207,000, Willow Farm Meadow at an average of £216,000 and Old Stores Close at an average of £220,000.
Which train stations are available in or near Worlingworth?
Some of the train stations available in or near Worlingworth are Wickham Market, Diss and Saxmundham.
Property Price Paid in Worlingworth by Year
The average sold property price by year was:
| Year | Average Sold Price | Price Change |
Sold Properties
|
|---|---|---|---|
| 2025 | £392,200 | -13% |
15 Properties |
| 2024 | £443,077 | -14% |
14 Properties |
| 2023 | £503,347 | 7% |
23 Properties |
| 2022 | £470,190 | 18% |
20 Properties |
| 2021 | £386,018 | -15% |
25 Properties |
| 2020 | £442,638 | 1% |
23 Properties |
| 2019 | £437,923 | 31% |
13 Properties |
| 2018 | £303,218 | -12% |
25 Properties |
| 2017 | £340,841 | 5% |
22 Properties |
| 2016 | £323,222 | 28% |
29 Properties |
| 2015 | £234,132 | -38% |
28 Properties |
| 2014 | £323,826 | 3% |
23 Properties |
| 2013 | £314,210 | 36% |
19 Properties |
| 2012 | £202,400 | -28% |
17 Properties |
| 2011 | £259,425 | -8% |
14 Properties |
| 2010 | £278,934 | -12% |
23 Properties |
| 2009 | £311,565 | 11% |
26 Properties |
| 2008 | £278,564 | -25% |
7 Properties |
| 2007 | £347,249 | 28% |
18 Properties |
| 2006 | £249,640 | -3% |
46 Properties |
| 2005 | £257,497 | 7% |
21 Properties |
| 2004 | £238,844 | 1% |
18 Properties |
| 2003 | £237,499 | 41% |
25 Properties |
| 2002 | £139,127 | -2% |
24 Properties |
| 2001 | £141,954 | -0,1% |
24 Properties |
| 2000 | £142,112 | 19% |
26 Properties |
| 1999 | £114,423 | 8% |
33 Properties |
| 1998 | £104,989 | 18% |
30 Properties |
| 1997 | £85,969 | -3% |
32 Properties |
| 1996 | £88,598 | 14% |
29 Properties |
| 1995 | £76,593 | - |
22 Properties |
Property Price per Property Type in Worlingworth
Here you can find historic sold price data in order to help with your property search.
The average Property Paid Price for specific property types in the last three years are:
| Property Type | Average Sold Price | Sold Properties |
|---|---|---|
| Semi Detached House | £259,350.00 | 13 Semi Detached Houses |
| Detached House | £553,757.00 | 35 Detached Houses |
| Terraced House | £227,500.00 | 4 Terraced Houses |

