
Houses for sale & to rent in Hoxne & Worlingworth, Woodbridge
House Prices in Hoxne & Worlingworth
Properties in Hoxne & Worlingworth have an average house price of £390k and had 7 Property Transactions within the last 3 years¹.
Hoxne & Worlingworth is an area in Woodbridge, Suffolk with 48 households², where the most expensive property was sold for £765k.
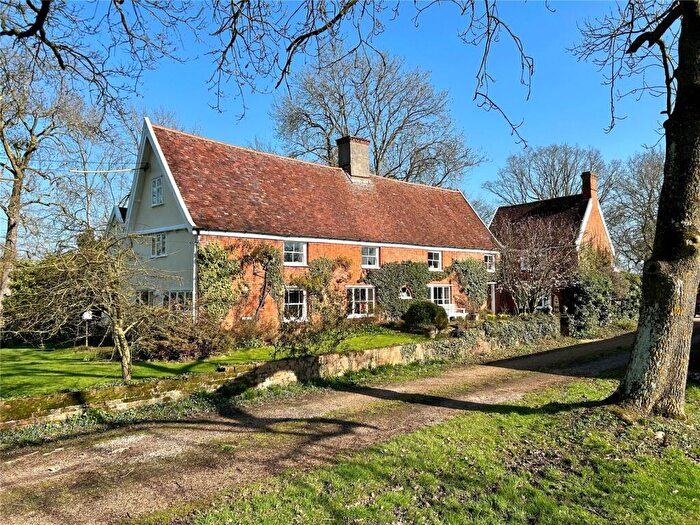
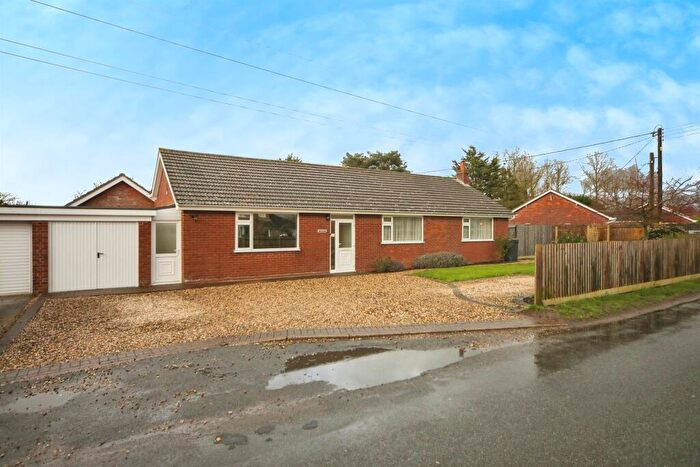
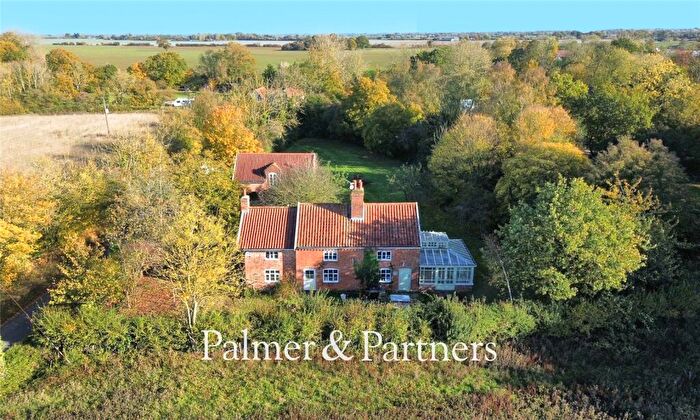
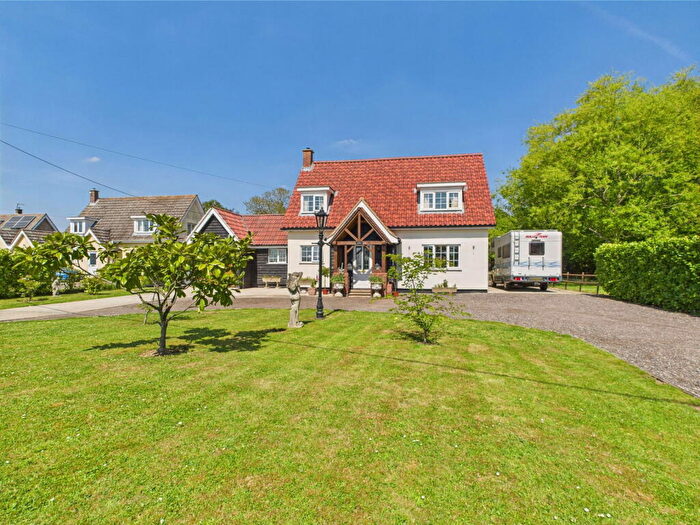
Properties for sale in Hoxne & Worlingworth
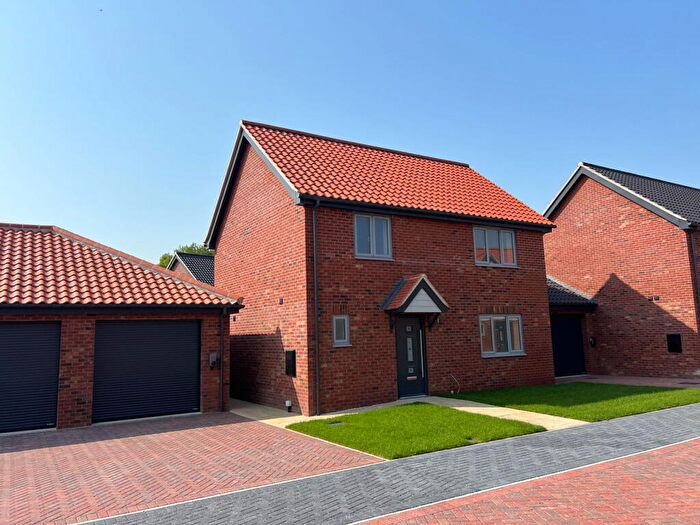
![]()
If you are looking to sell your house, let it out, or receive a property valuation, an expert can help you.
Click the button below to get started.


Previously listed properties in Hoxne & Worlingworth
Roads and Postcodes in Hoxne & Worlingworth
Navigate through our locations to find the location of your next house in Hoxne & Worlingworth, Woodbridge for sale or to rent.
| Streets | Postcodes |
|---|---|
| Chambers Close | IP13 7ST |
| Chimers Lane | IP13 7FE |
| Dog Lane | IP13 7EQ |
| Mill Road | IP13 7HL |
| New Road | IP13 7NX IP13 7PB |
| Old Mill Close | IP13 7BF |
| School Road | IP13 7FD |
| Shop Street | IP13 7HU IP13 7PH |
| Smiths Close | IP13 7JG |
| Stanway Green | IP13 7NY IP13 7NZ |
| The Cross | IP13 7JA |
| The Green | IP13 7ES IP13 7EU |
| IP13 7ED IP13 7EG IP13 7HD IP13 7HE IP13 7HJ IP13 7HS IP13 7LR IP13 7LS IP13 7LT |
Transport near Hoxne & Worlingworth
-
 Diss Station
 -
Wickham Market Station
-
Saxmundham Station
-
Darsham Station
-
Needham Market Station
-
Melton Station
-
Stowmarket Station
-
Halesworth Station
-
Woodbridge Station
-
Westerfield Station
- FAQ
- Price Paid By Year
- Property Type Price
Frequently asked questions about Hoxne & Worlingworth
What is the average price for a property for sale in Hoxne & Worlingworth?
The average price for a property for sale in Hoxne & Worlingworth is £389,642. This amount is 8% lower than the average price in Woodbridge. There are 160 property listings for sale in Hoxne & Worlingworth.
What streets have the most expensive properties for sale in Hoxne & Worlingworth?
The street with the most expensive properties for sale in Hoxne & Worlingworth is Shop Street at an average of £350,000.
What streets have the most affordable properties for sale in Hoxne & Worlingworth?
The street with the most affordable properties for sale in Hoxne & Worlingworth is Stanway Green at an average of £322,500.
Which train stations are available in or near Hoxne & Worlingworth?
Some of the train stations available in or near Hoxne & Worlingworth are Diss, Wickham Market and Saxmundham.
Property Price Paid in Hoxne & Worlingworth by Year
The average sold property price by year was:
| Year | Average Sold Price | Price Change |
Sold Properties
|
|---|---|---|---|
| 2025 | £350,000 | 10% |
1 Property |
| 2024 | £316,250 | -38% |
2 Properties |
| 2023 | £436,250 | -13% |
4 Properties |
| 2022 | £493,333 | 48% |
3 Properties |
| 2021 | £257,500 | -46% |
2 Properties |
| 2020 | £376,150 | 12% |
6 Properties |
| 2019 | £330,408 | -44% |
6 Properties |
| 2018 | £474,166 | -3% |
3 Properties |
| 2017 | £490,000 | 44% |
2 Properties |
| 2016 | £272,708 | -3% |
6 Properties |
| 2015 | £279,600 | 24% |
5 Properties |
| 2013 | £212,500 | 59% |
1 Property |
| 1996 | £87,500 | - |
1 Property |
Property Price per Property Type in Hoxne & Worlingworth
Here you can find historic sold price data in order to help with your property search.
The average Property Paid Price for specific property types in the last three years are:
| Property Type | Average Sold Price | Sold Properties |
|---|---|---|
| Detached House | £396,250.00 | 6 Detached Houses |
| Semi Detached House | £350,000.00 | 1 Semi Detached House |