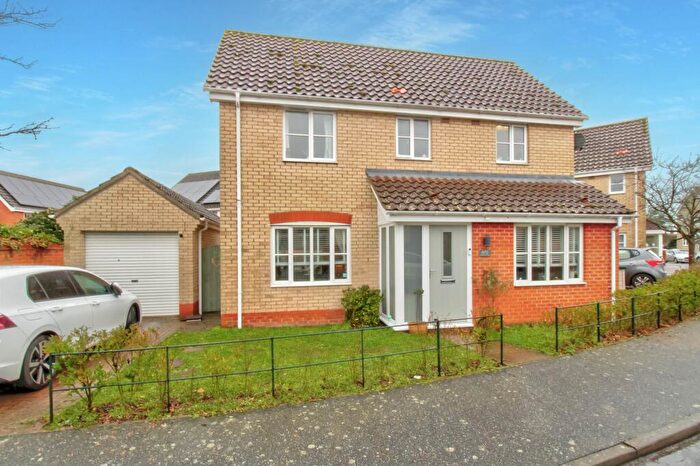
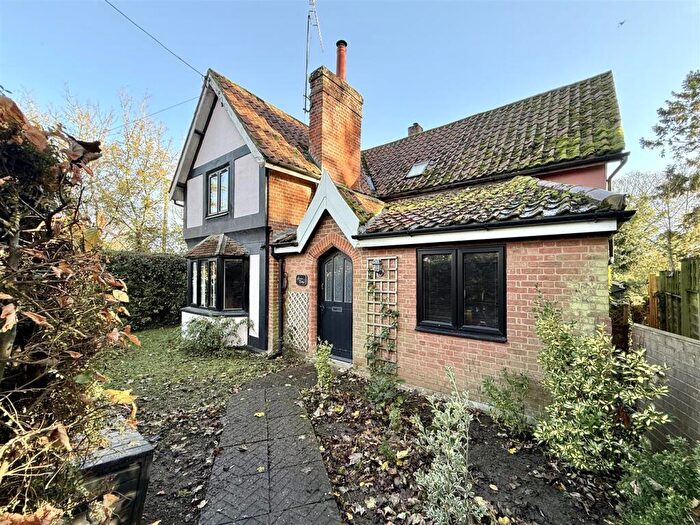
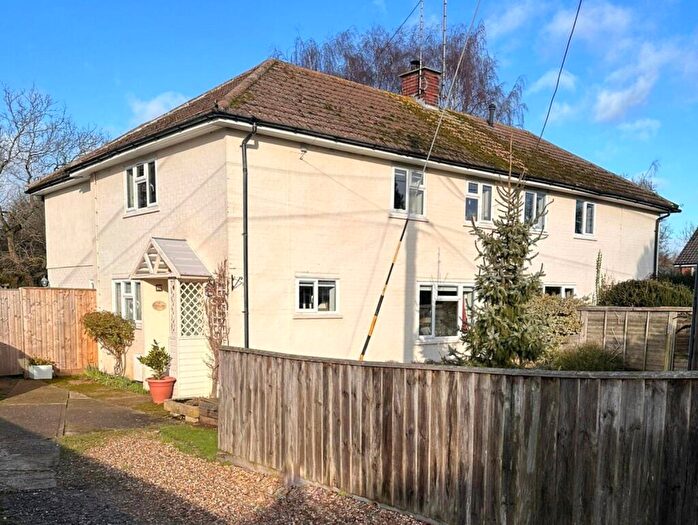
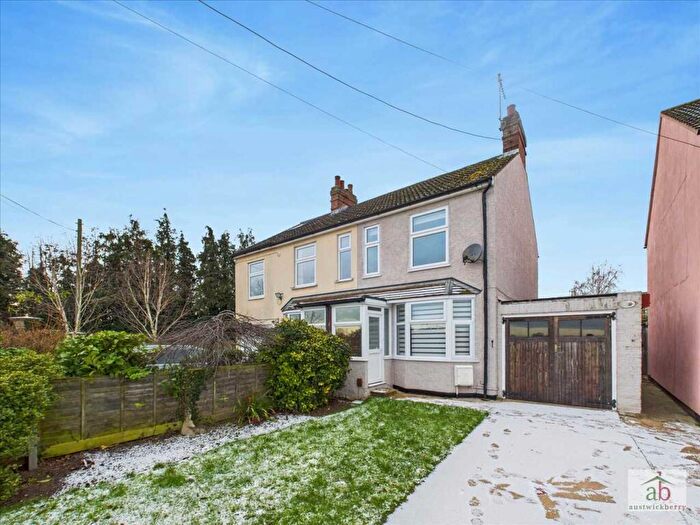
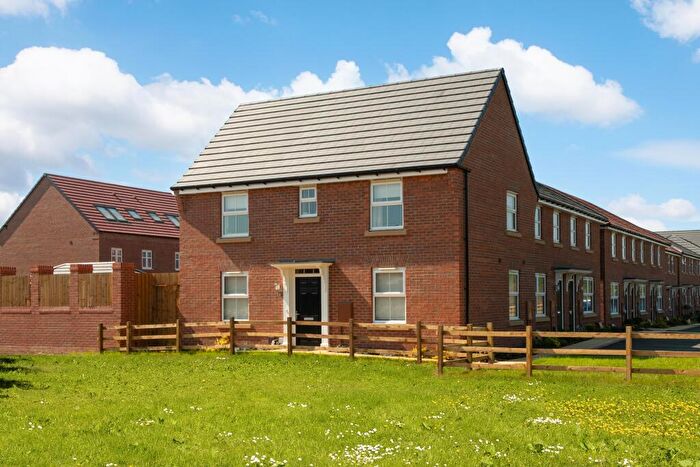
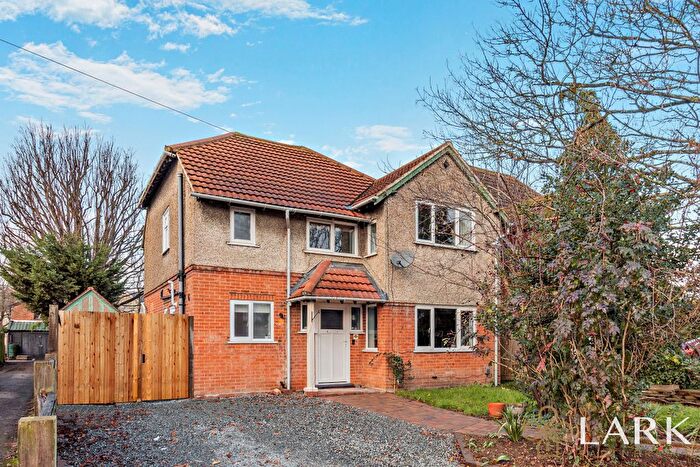
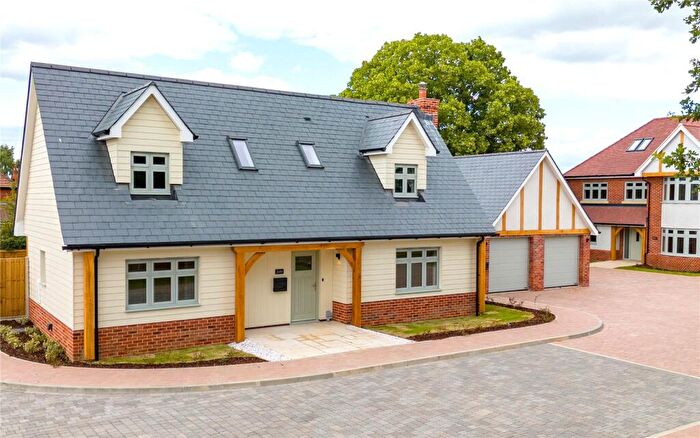
Houses for sale & to rent in Carlford & Fynn Valley, Ipswich
House Prices in Carlford & Fynn Valley
Properties in Carlford & Fynn Valley have an average house price of £399,110.00 and had 5 Property Transactions within the last 3 years¹.
Carlford & Fynn Valley is an area in Ipswich, Suffolk with 64 households², where the most expensive property was sold for £625,000.00.
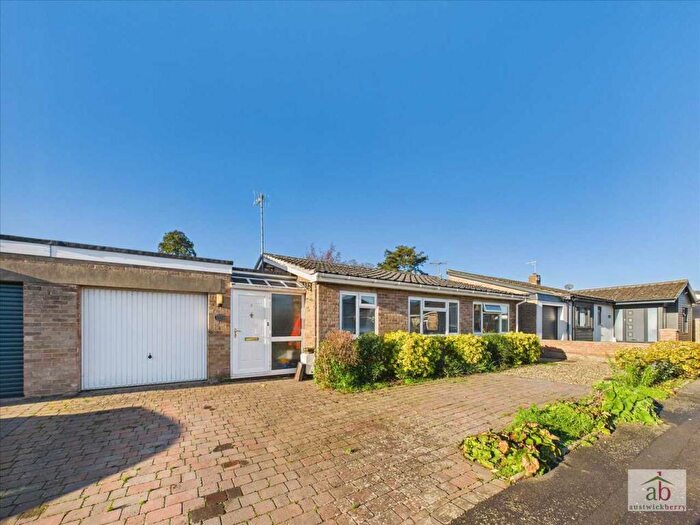
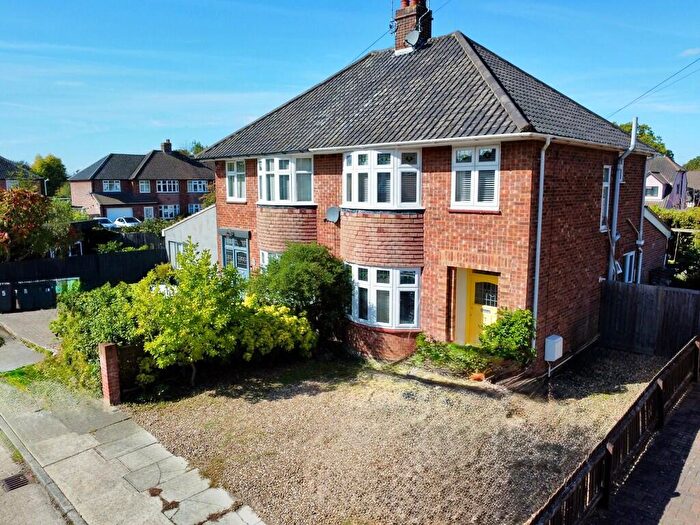
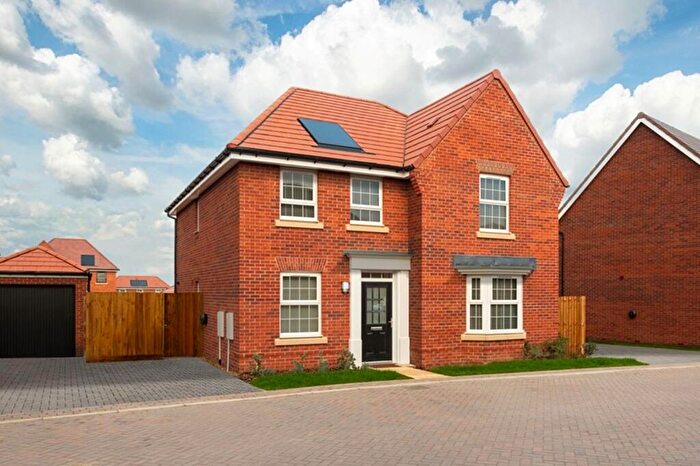
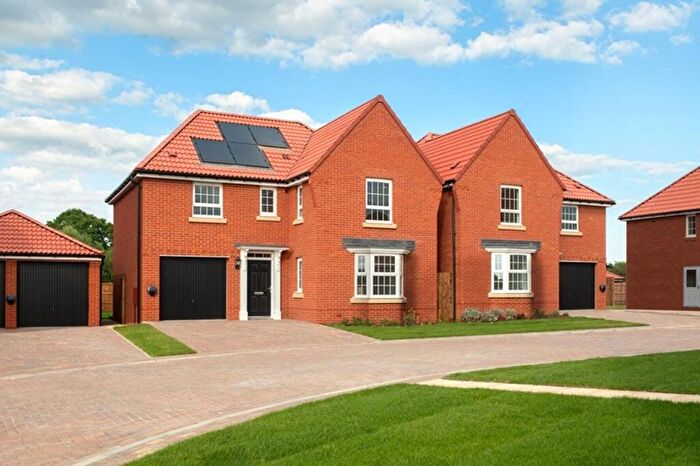
Properties for sale in Carlford & Fynn Valley
Roads and Postcodes in Carlford & Fynn Valley
Navigate through our locations to find the location of your next house in Carlford & Fynn Valley, Ipswich for sale or to rent.
| Streets | Postcodes |
|---|---|
| Ashbocking Road | IP6 9BF IP6 9LN |
| Brook Lane | IP6 9DZ |
| Charity Lane | IP6 9EY |
| Chestnut Rise | IP6 9HQ |
| Church Lane | IP6 9NJ |
| Clopton Road | IP6 9LX |
| Fieldfare Way | IP6 9FB |
| Humber Doucy Lane | IP4 3PB IP4 3PG IP4 3PZ |
| Jacks Field | IP6 9FA |
| Lower Road | IP6 9AT |
| Main Road | IP6 9AB |
| Millers Way | IP6 9HF |
| Playford Corner | IP6 9DL |
| Playford Lane | IP5 1DP |
| Rose Hill | IP6 9HU |
| St Marys View | IP6 9HE |
| Swilland | IP6 9FD IP6 9LB IP6 9LS IP6 9LY IP6 9LZ |
| Swilland Road | IP6 9NF |
| The Street | IP5 1DL |
| Thomsons Lane | IP6 9JF |
| Tuddenham Lane | IP6 9BG |
| Upper Street | IP6 9ER |
| Wash Lane | IP6 9FW |
| Westerfield Road | IP6 9AF |
| IP5 1BJ IP5 1DB IP6 9DW IP6 9EA IP6 9EE IP6 9EG IP6 9JA IP6 9JE IP6 9LA IP6 9ND |
Transport near Carlford & Fynn Valley
- FAQ
- Price Paid By Year
- Property Type Price
Frequently asked questions about Carlford & Fynn Valley
What is the average price for a property for sale in Carlford & Fynn Valley?
The average price for a property for sale in Carlford & Fynn Valley is £399,110. This amount is 37% higher than the average price in Ipswich. There are 4,241 property listings for sale in Carlford & Fynn Valley.
What streets have the most expensive properties for sale in Carlford & Fynn Valley?
The street with the most expensive properties for sale in Carlford & Fynn Valley is Chestnut Rise at an average of £355,000.
What streets have the most affordable properties for sale in Carlford & Fynn Valley?
The street with the most affordable properties for sale in Carlford & Fynn Valley is Upper Street at an average of £220,000.
Which train stations are available in or near Carlford & Fynn Valley?
Some of the train stations available in or near Carlford & Fynn Valley are Westerfield, Derby Road and Ipswich.
Property Price Paid in Carlford & Fynn Valley by Year
The average sold property price by year was:
| Year | Average Sold Price | Price Change |
Sold Properties
|
|---|---|---|---|
| 2025 | £220,000 | -61% |
1 Property |
| 2024 | £355,000 | -42% |
1 Property |
| 2023 | £505,550 | 10% |
1 Property |
| 2022 | £457,500 | -27% |
2 Properties |
| 2021 | £581,429 | 18% |
6 Properties |
| 2020 | £474,725 | 3% |
6 Properties |
| 2019 | £462,192 | 57% |
7 Properties |
| 2018 | £196,666 | -181% |
3 Properties |
| 2017 | £553,416 | 19% |
6 Properties |
| 2016 | £446,666 | 70% |
6 Properties |
| 2015 | £134,000 | -180% |
1 Property |
| 2007 | £375,000 | 85% |
1 Property |
| 1999 | £55,000 | - |
1 Property |
Property Price per Property Type in Carlford & Fynn Valley
Here you can find historic sold price data in order to help with your property search.
The average Property Paid Price for specific property types in the last three years are:
| Property Type | Average Sold Price | Sold Properties |
|---|---|---|
| Semi Detached House | £383,516.00 | 3 Semi Detached Houses |
| Terraced House | £220,000.00 | 1 Terraced House |
| Detached House | £625,000.00 | 1 Detached House |

