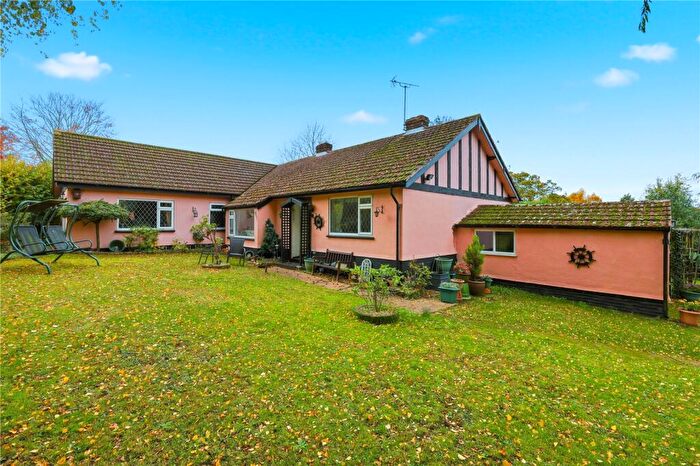
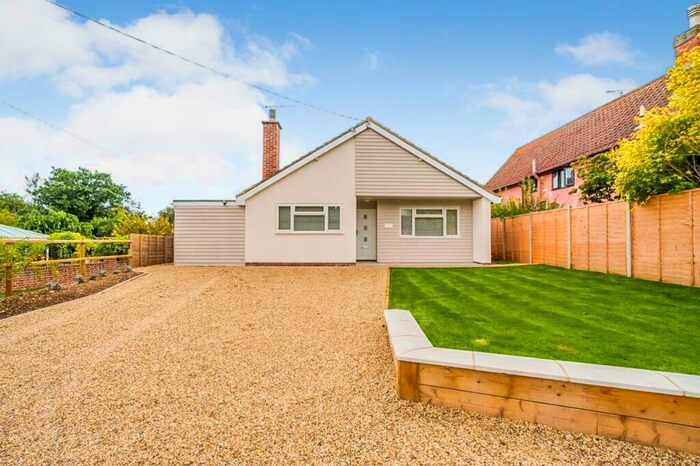
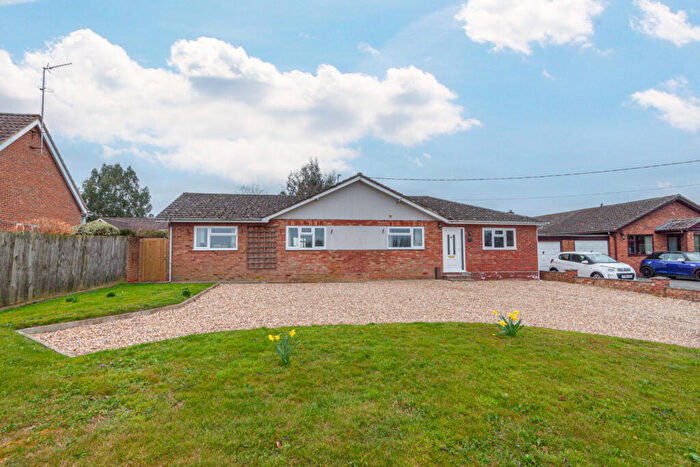
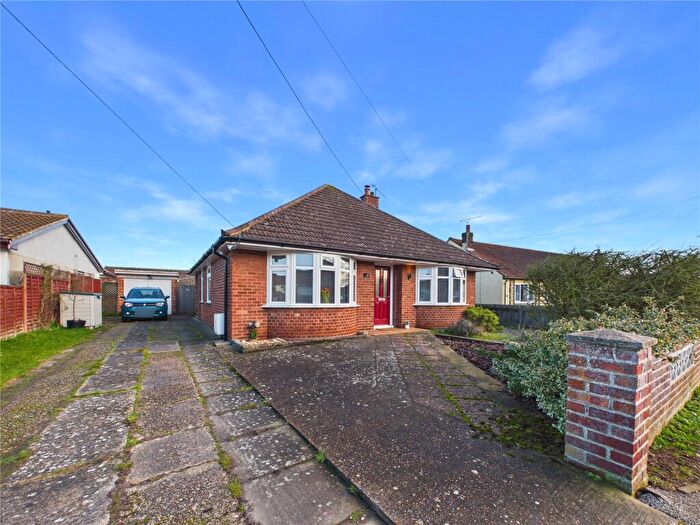
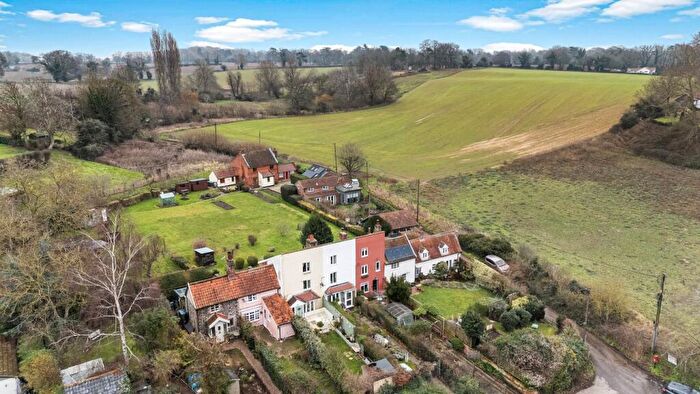
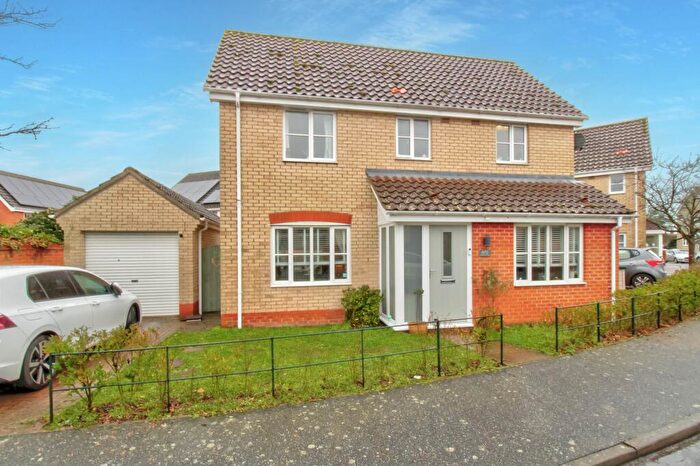
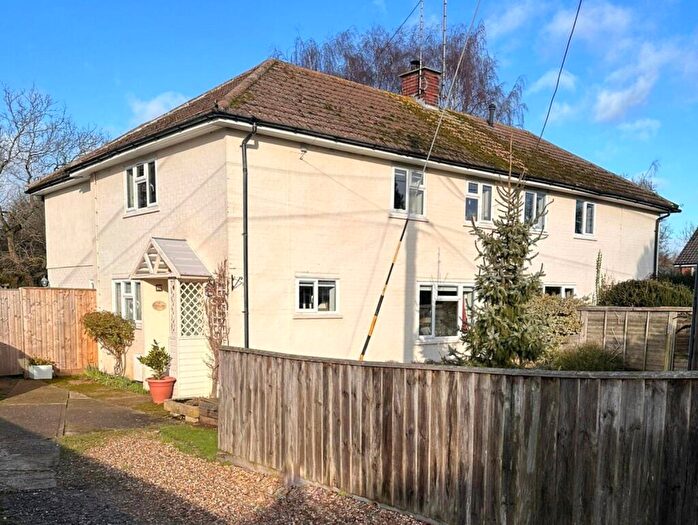
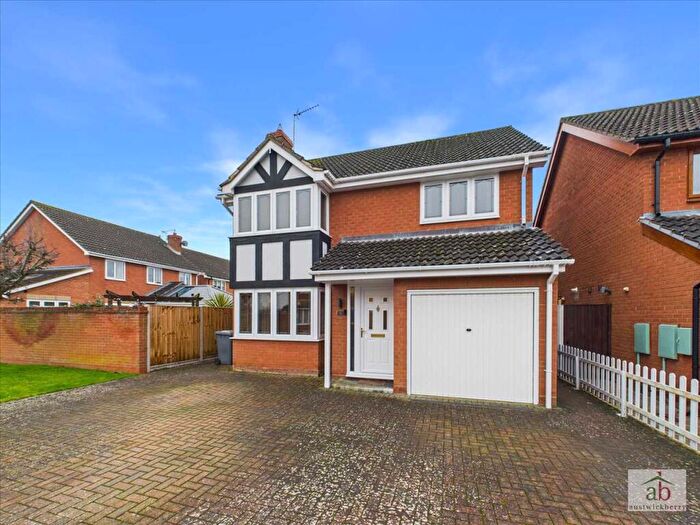
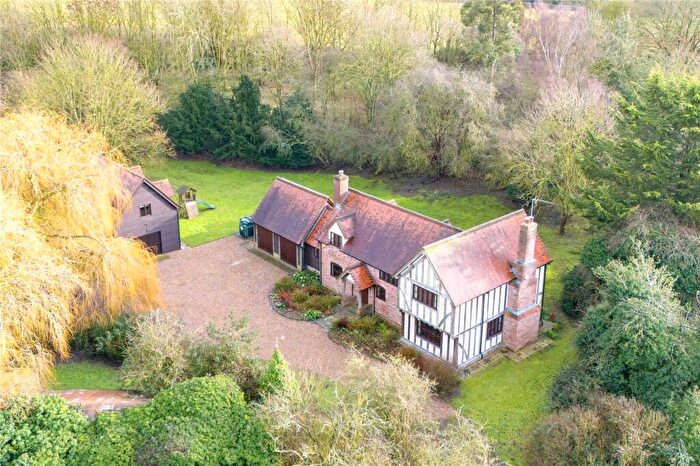
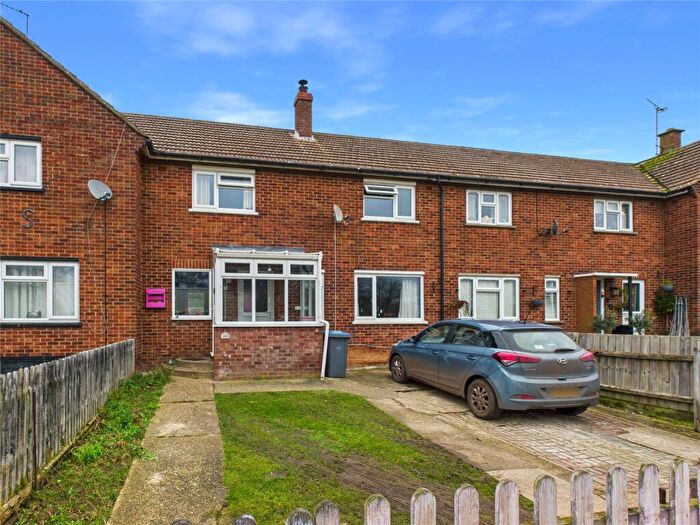
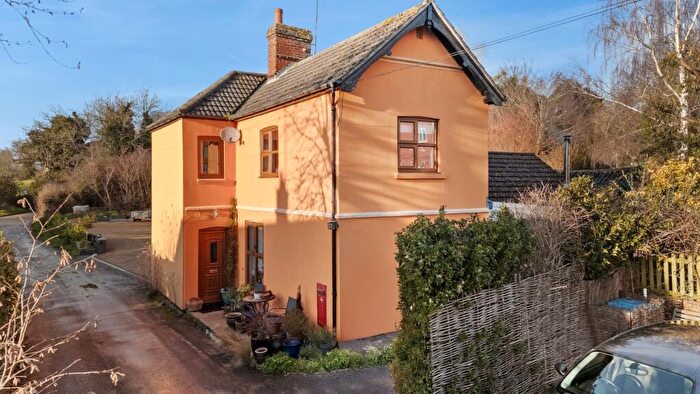
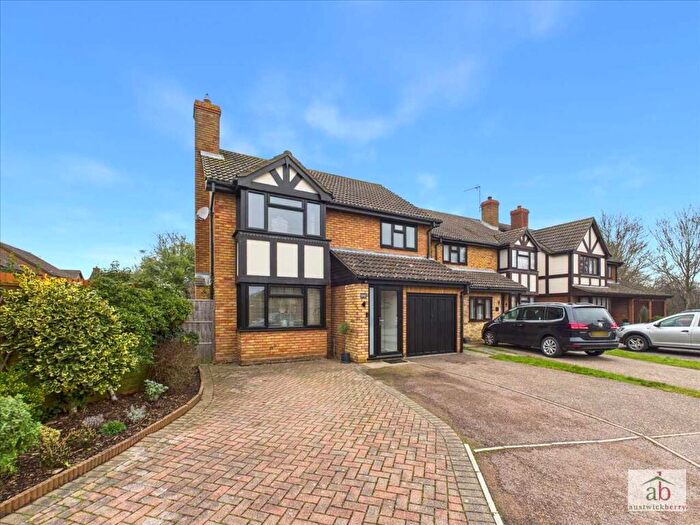
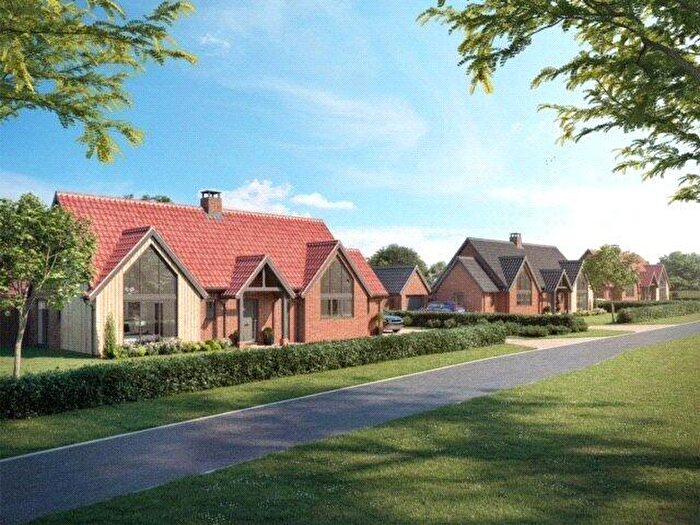
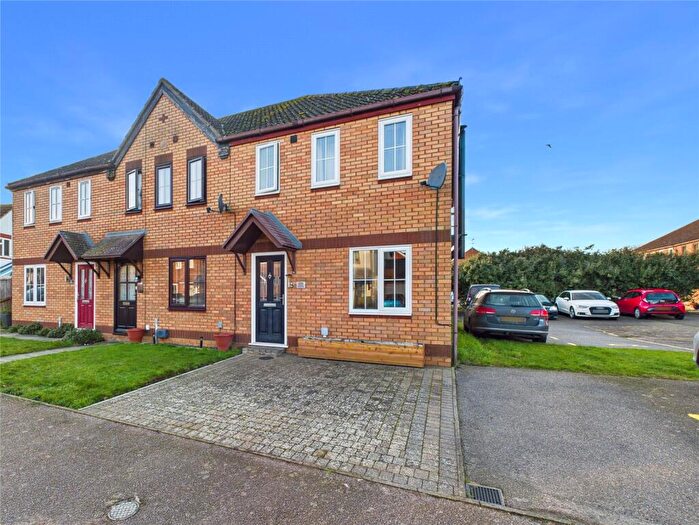
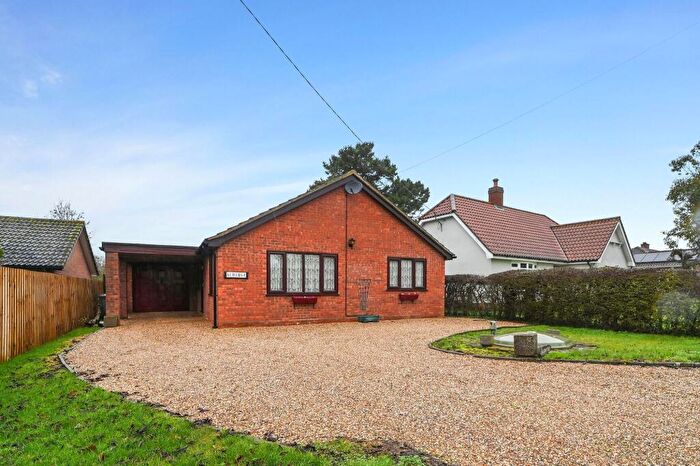
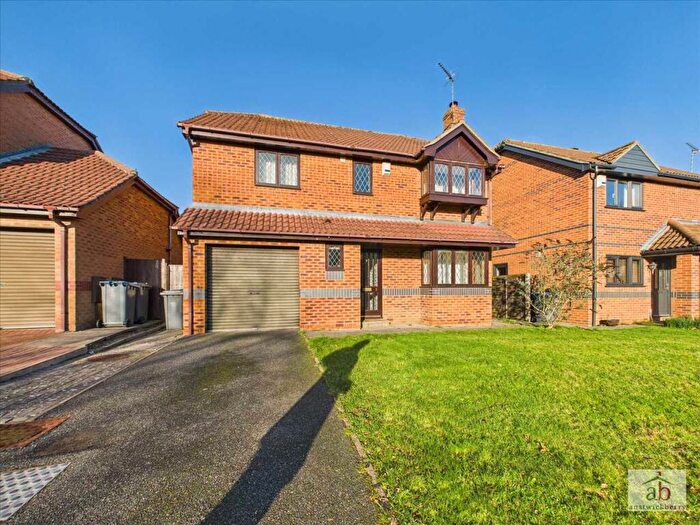
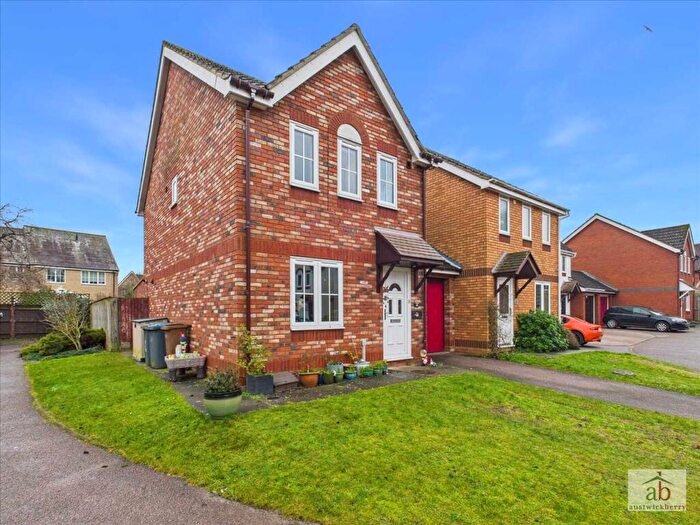
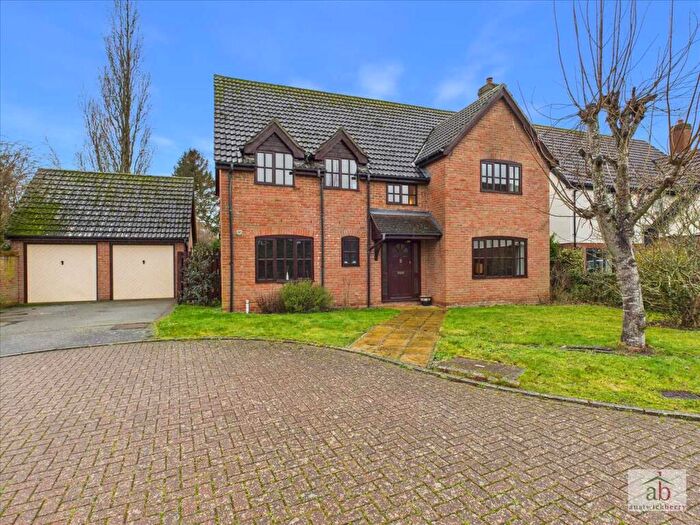
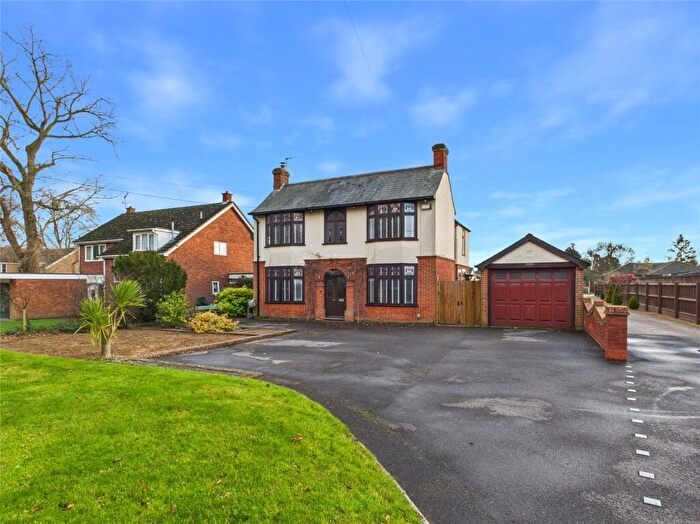
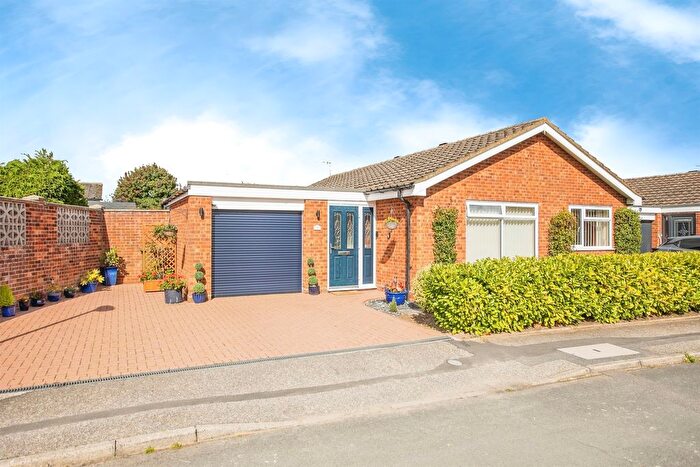
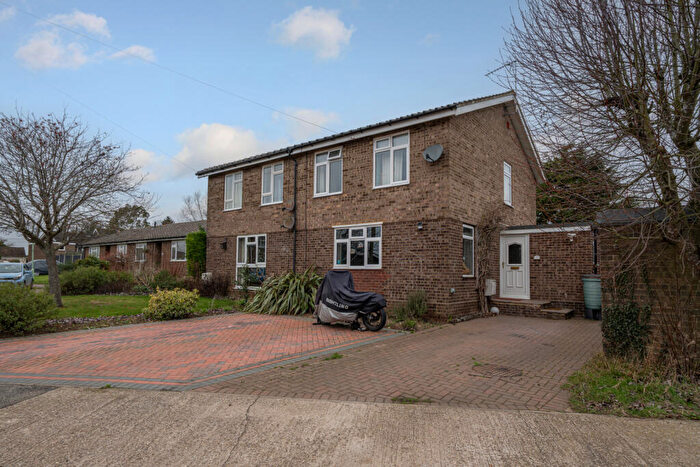
Houses for sale & to rent in Grundisburgh, Woodbridge
House Prices in Grundisburgh
Properties in Grundisburgh have an average house price of £549,664.00 and had 65 Property Transactions within the last 3 years¹.
Grundisburgh is an area in Woodbridge, Suffolk with 859 households², where the most expensive property was sold for £2,300,000.00.
Properties for sale in Grundisburgh
Roads and Postcodes in Grundisburgh
Navigate through our locations to find the location of your next house in Grundisburgh, Woodbridge for sale or to rent.
| Streets | Postcodes |
|---|---|
| Ablitt's Meadow | IP13 6SJ |
| Alice Driver Road | IP13 6XH |
| Beacon House Cottages | IP13 6NB |
| Beacon Lane | IP13 6LZ |
| Bonds Corner | IP13 6RT IP13 6RU IP13 6SA |
| Boot Street | IP13 6PB IP13 6PQ |
| Chapel Lane | IP13 6UW |
| Chapel Road | IP13 6XL |
| Charles Avenue | IP13 6TH |
| Cranworth Close | IP13 6SZ |
| Grundisburgh Road | IP13 6PE IP13 6PG |
| Gurdon Road | IP13 6XA |
| Half Moon Lane | IP13 6TU IP13 6UE |
| Hall Farm Road | IP13 6NY |
| Hasketon Road | IP13 6PA |
| Holly Close | IP13 6PL |
| Holly Lane | IP13 6PN IP13 6PP IP13 6PW |
| Ipswich Road | IP13 6TJ |
| Jacqueline Close | IP13 6UZ |
| Kiln Lane | IP13 6NJ |
| Lower Road | IP13 6UH IP13 6UJ IP13 6UN IP13 6UQ |
| Lower Street | IP13 6NH IP13 6NL |
| Martlesham Road | IP13 6LU IP13 6LX |
| Meeting Lane | IP13 6TT IP13 6TX IP13 6TY IP13 6TZ IP13 6UB |
| Michaels Mount | IP13 6LS |
| Orchard End | IP13 6UA |
| Orchard Lane | IP13 6NN |
| Otley Road | IP13 6RY IP13 6RZ |
| Pine Grove | IP13 6UL |
| Playford Road | IP13 6ND |
| Post Mill Close | IP13 6UU |
| Post Mill Crescent | IP13 6UX |
| Post Mill Gardens | IP13 6UP IP13 6UR |
| Post Mill Orchard | IP13 6UT |
| Pound Corner | IP13 6TN |
| Red Barn Piece | IP13 6XD |
| Richards Drive | IP13 6LR |
| Rose Hill | IP13 6TF IP13 6TG IP13 6TQ |
| Salters Gardens | IP13 6XE |
| Sandy Lane | IP13 6LP IP13 6LW |
| Stoney Road | IP13 6RA IP13 6RD IP13 6RE IP13 6RG IP13 6RJ IP13 6RQ |
| The Green | IP13 6TA |
| The Street | IP13 6LJ IP13 6LN IP13 6LT IP13 6TD |
| Thomas Walls Close | IP13 6XB |
| Thompson Close | IP13 6XJ |
| Wood Farm Road | IP13 6RP |
| Woodbridge Road | IP13 6UD IP13 6UF |
| IP13 6LH IP13 6LL IP13 6NW IP13 6NZ IP13 6TB |
Transport near Grundisburgh
- FAQ
- Price Paid By Year
- Property Type Price
Frequently asked questions about Grundisburgh
What is the average price for a property for sale in Grundisburgh?
The average price for a property for sale in Grundisburgh is £549,664. This amount is 30% higher than the average price in Woodbridge. There are 980 property listings for sale in Grundisburgh.
What streets have the most expensive properties for sale in Grundisburgh?
The streets with the most expensive properties for sale in Grundisburgh are Martlesham Road at an average of £1,409,375, Beacon Lane at an average of £875,000 and Chapel Road at an average of £867,500.
What streets have the most affordable properties for sale in Grundisburgh?
The streets with the most affordable properties for sale in Grundisburgh are Rose Hill at an average of £232,236, Post Mill Orchard at an average of £250,000 and Post Mill Crescent at an average of £288,000.
Which train stations are available in or near Grundisburgh?
Some of the train stations available in or near Grundisburgh are Woodbridge, Westerfield and Melton.
Property Price Paid in Grundisburgh by Year
The average sold property price by year was:
| Year | Average Sold Price | Price Change |
Sold Properties
|
|---|---|---|---|
| 2025 | £531,166 | -24% |
18 Properties |
| 2024 | £657,370 | 36% |
27 Properties |
| 2023 | £420,910 | -21% |
20 Properties |
| 2022 | £509,928 | 13% |
32 Properties |
| 2021 | £441,163 | 11% |
26 Properties |
| 2020 | £392,329 | 17% |
28 Properties |
| 2019 | £324,960 | -13% |
27 Properties |
| 2018 | £367,770 | -25% |
24 Properties |
| 2017 | £460,843 | 13% |
29 Properties |
| 2016 | £402,169 | -12% |
32 Properties |
| 2015 | £449,082 | 41% |
42 Properties |
| 2014 | £264,430 | -18% |
35 Properties |
| 2013 | £313,288 | 1% |
26 Properties |
| 2012 | £308,944 | 3% |
27 Properties |
| 2011 | £299,172 | 8% |
29 Properties |
| 2010 | £275,249 | 3% |
32 Properties |
| 2009 | £268,065 | -36% |
23 Properties |
| 2008 | £365,340 | 28% |
16 Properties |
| 2007 | £262,697 | -22% |
35 Properties |
| 2006 | £319,490 | 20% |
35 Properties |
| 2005 | £255,833 | 5% |
44 Properties |
| 2004 | £241,776 | -17% |
37 Properties |
| 2003 | £283,101 | 27% |
29 Properties |
| 2002 | £207,594 | 26% |
45 Properties |
| 2001 | £154,166 | 17% |
34 Properties |
| 2000 | £127,492 | 14% |
44 Properties |
| 1999 | £110,110 | 4% |
49 Properties |
| 1998 | £106,019 | -0,2% |
54 Properties |
| 1997 | £106,245 | 11% |
34 Properties |
| 1996 | £94,170 | -8% |
32 Properties |
| 1995 | £101,726 | - |
32 Properties |
Property Price per Property Type in Grundisburgh
Here you can find historic sold price data in order to help with your property search.
The average Property Paid Price for specific property types in the last three years are:
| Property Type | Average Sold Price | Sold Properties |
|---|---|---|
| Semi Detached House | £303,583.00 | 18 Semi Detached Houses |
| Detached House | £705,274.00 | 40 Detached Houses |
| Terraced House | £293,244.00 | 7 Terraced Houses |

