
Houses for sale in Witnesham, Ipswich
House Prices in Witnesham
Properties in Witnesham have an average house price of £430k and had 79 Property Transactions within the last 3 years¹.
Witnesham is an area in Ipswich, Suffolk with 818 households², where the most expensive property was sold for £1.37M.
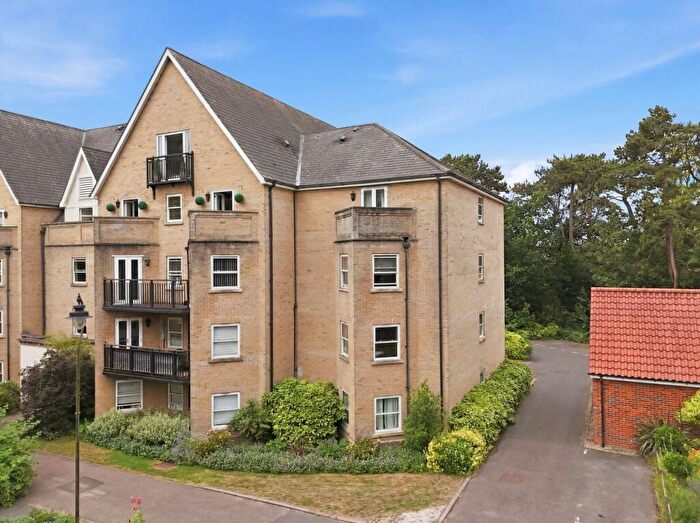
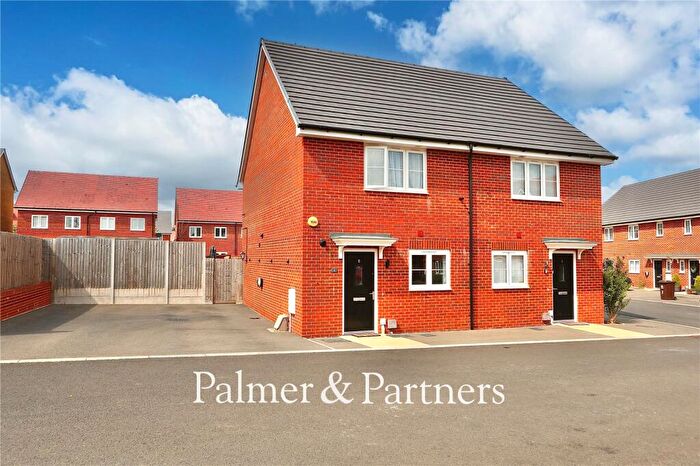
Properties for sale in Witnesham
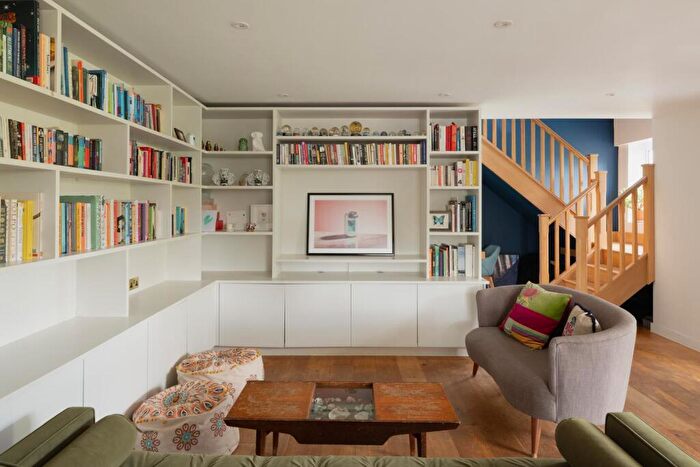
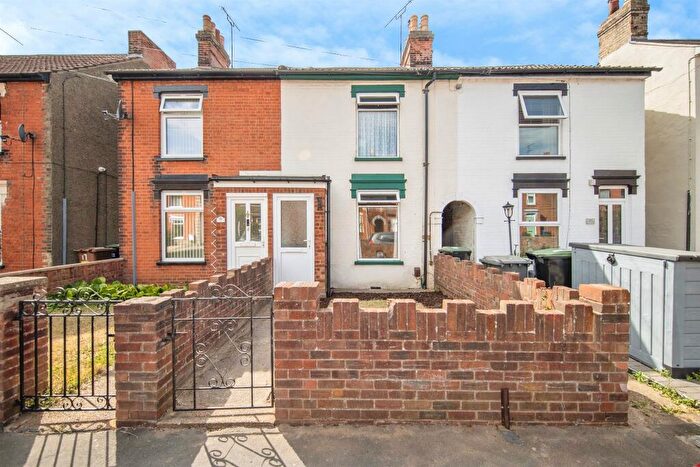
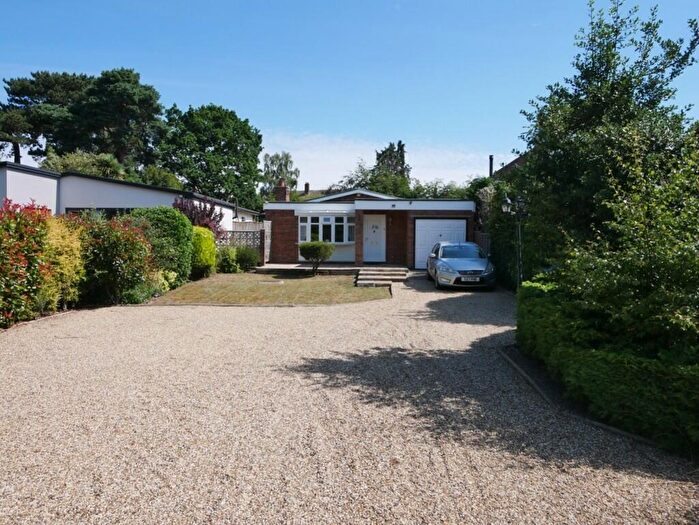
![]()
If you are looking to sell your house, let it out, or receive a property valuation, an expert can help you.
Click the button below to get started.


Roads and Postcodes in Witnesham
Navigate through our locations to find the location of your next house in Witnesham, Ipswich for sale or to rent.
| Streets | Postcodes |
|---|---|
| Acre Close | IP6 9EU |
| America Hill Cottages | IP6 9EJ |
| Ashbocking Road | IP6 9LH IP6 9LJ |
| Berghersh Drive | IP6 9EZ |
| Brook Lane | IP6 9DY |
| Burwash | IP6 9EL |
| Butts Road | IP6 9DP |
| Church Lane | IP6 9BE IP6 9JD |
| Clopton Road | IP6 9BY |
| Cockfield Hall Lane | IP6 9AN IP6 9JB |
| Coopers Close | IP6 9ES |
| Council Houses | IP6 9DS |
| Fullers Field | IP6 9AX |
| Fynn Lane | IP6 9DB |
| Giles Way | IP6 9HB |
| Hall Lane | IP6 9HN |
| High Road | IP6 9EX IP6 9LP IP6 9LR IP6 9LW |
| High Street | IP6 9BN |
| Hill Farm Road | IP6 9DT IP6 9DU |
| Hillside Cottages | IP6 9DD |
| Ipswich Road | IP6 9HT |
| Jubys Hill | IP6 9EN |
| Keightley Way | IP6 9BJ |
| Lower Road | IP6 9AR IP6 9AS IP6 9AU |
| Main Road | IP6 9BZ |
| Mill Lane | IP6 9HP IP6 9HR |
| Oak View | IP6 9BA |
| Park Corner | IP6 9DE |
| Pipps Lane | IP6 9AP |
| Playford Road | IP5 1DA |
| Rose Hill | IP6 9HX IP6 9HY |
| Spring Meadow | IP6 9ED |
| St Marys Drive | IP6 9EB |
| St Marys Way | IP6 9BQ |
| Strugglers Lane | IP6 9HS |
| Swan Lane | IP6 9AH |
| Swilland | IP6 9LT IP6 9LU |
| The Courts | IP6 9DR |
| The Granaries | IP6 9BW |
| The Hill | IP6 9BL |
| The Paddocks | IP6 9BD |
| The Street | IP6 9BP IP6 9BS IP6 9BT IP6 9BU IP6 9BX IP6 9HG IP6 9HH IP6 9HJ |
| Tuddenham Lane | IP6 9HL |
| Upper Street | IP6 9EW |
| Westerfield Lane | IP6 9BH |
| Westerfield Road | IP6 9AA IP6 9AD IP6 9AE IP6 9AG IP6 9AJ IP6 9AL IP6 9AQ |
| Weyland Road | IP6 9ET |
| IP6 9DA IP6 9DN IP6 9DX IP6 9EH IP6 9HZ |
Property price trends in Witnesham
According to the latest Land Registry data, the average home in Witnesham sold for £468,500 in 2026. That figure comes from 914 sales logged over the past 31 years.
Prices have continued to climb over the last three years. Compared with 2023, when the typical sale came in around £398,244, that's a rise of roughly 17.6%.
Looking back five years, average prices are down about 6.2% since 2021, a drop of around £30,770 in cash terms.
Zoom out to the past decade for the fuller picture. Back in 2016, homes here averaged £391,207, so the typical sold price has climbed about 19.8% since then, roughly 1.8% a year. Stretch the view to fifteen years and that annual pace eases back to about 1.4%.
Frequently asked questions about Witnesham
What is the average price for a property for sale in Witnesham?
The average price for a property for sale in Witnesham is £429,624. This amount is 49% higher than the average price in Ipswich. There are 6,960 property listings for sale in Witnesham.
What streets have the most expensive properties for sale in Witnesham?
The streets with the most expensive properties for sale in Witnesham are Clopton Road at an average of £887,500, Spring Meadow at an average of £760,000 and Council Houses at an average of £677,500.
What streets have the most affordable properties for sale in Witnesham?
The streets with the most affordable properties for sale in Witnesham are The Hill at an average of £162,000, Westerfield Lane at an average of £170,000 and High Street at an average of £178,666.
Which train stations are available in or near Witnesham?
Some of the train stations available in or near Witnesham are Westerfield, Derby Road and Ipswich.
Property Price Paid in Witnesham by Year
The average sold property price by year was:
| Year | Average Sold Price | Price Change |
Sold Properties
|
|---|---|---|---|
| 2026 | £468,500 | 2% |
2 Properties |
| 2025 | £458,662 | 9% |
29 Properties |
| 2024 | £418,465 | 5% |
29 Properties |
| 2023 | £398,244 | -50% |
19 Properties |
| 2022 | £597,648 | 16% |
32 Properties |
| 2021 | £499,270 | 18% |
37 Properties |
| 2020 | £411,206 | -7% |
23 Properties |
| 2019 | £441,238 | 6% |
22 Properties |
| 2018 | £413,147 | 17% |
34 Properties |
| 2017 | £344,623 | -14% |
28 Properties |
Property Price per Property Type in Witnesham
Here you can find historic sold price data in order to help with your property search.
The average Property Paid Price for specific property types in the last three years are:
| Property Type | Average Sold Price | Sold Properties |
|---|---|---|
| Semi Detached House | £306,588.00 | 25 Semi Detached Houses |
| Detached House | £531,663.00 | 46 Detached Houses |
| Terraced House | £227,393.00 | 8 Terraced Houses |
