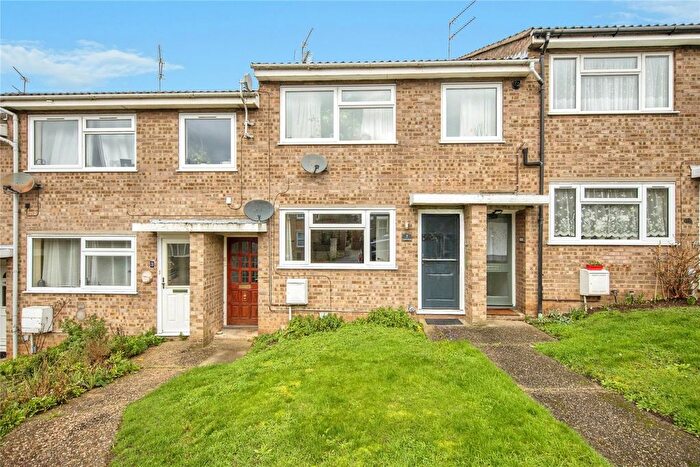
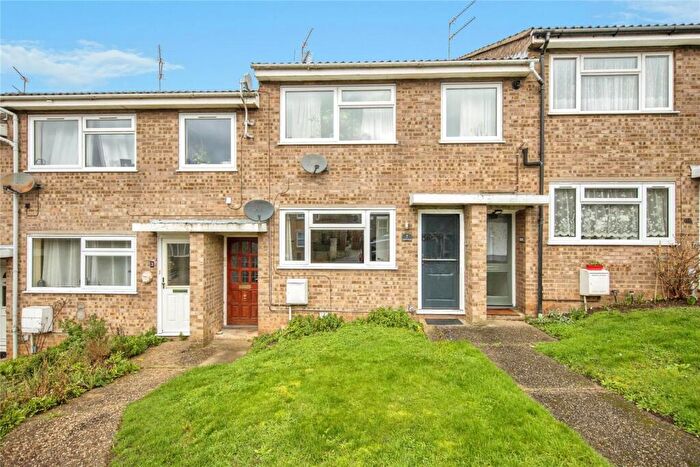
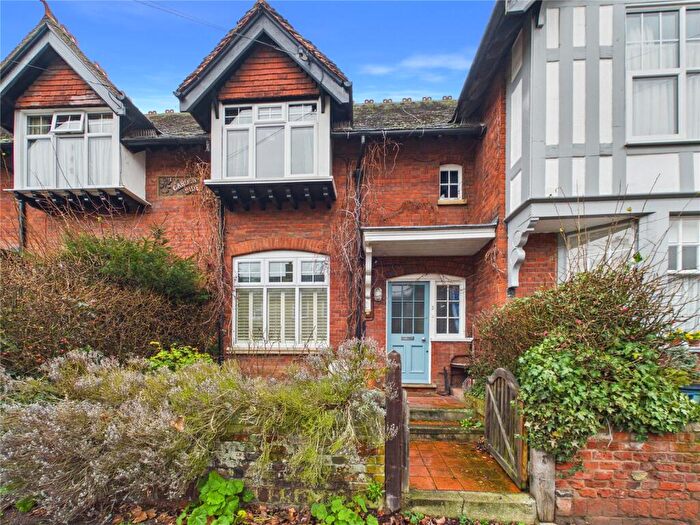
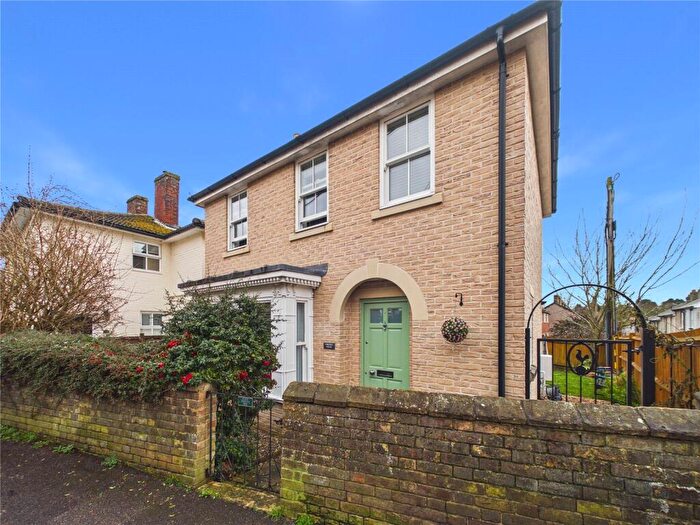
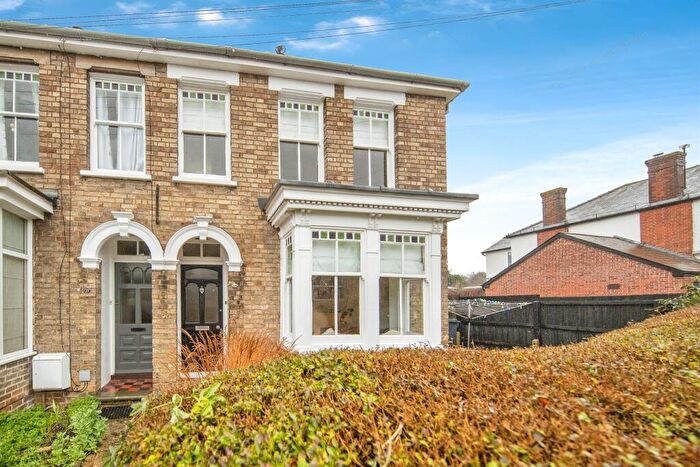
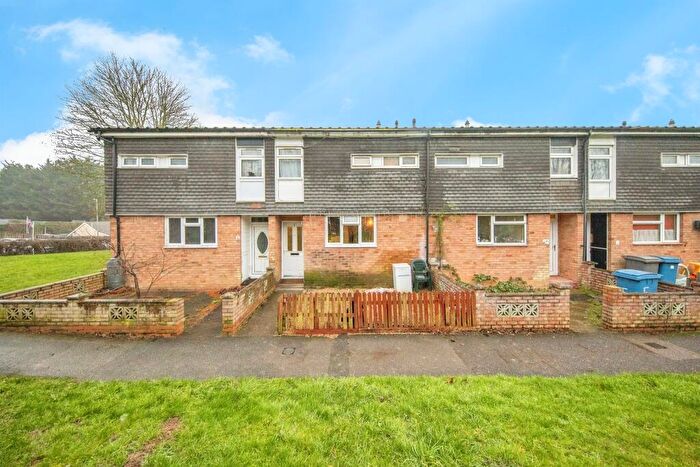
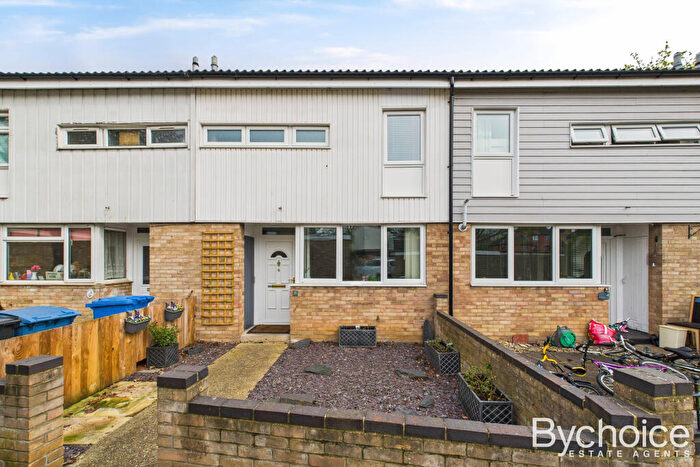
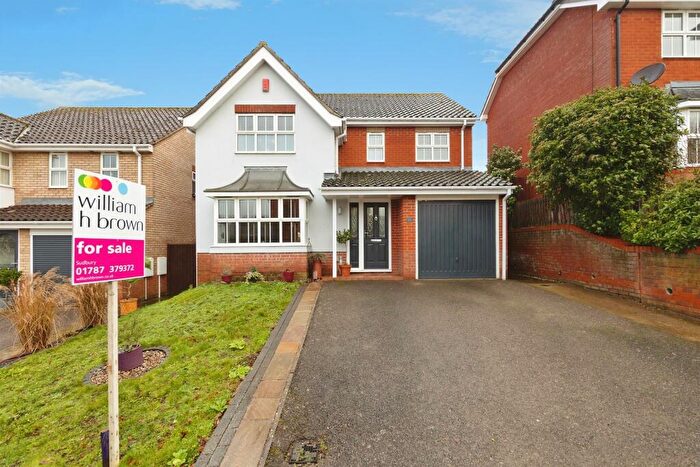
Houses for sale & to rent in Sudbury East, Sudbury
House Prices in Sudbury East
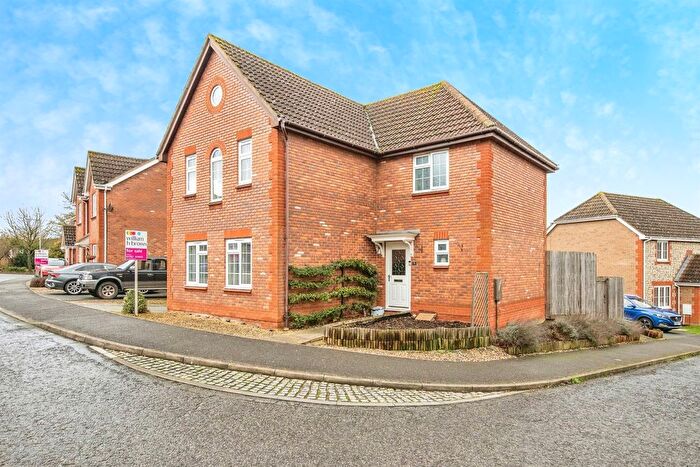
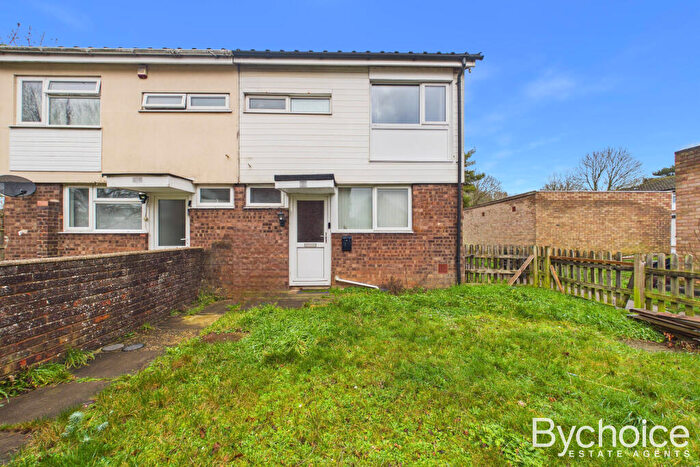
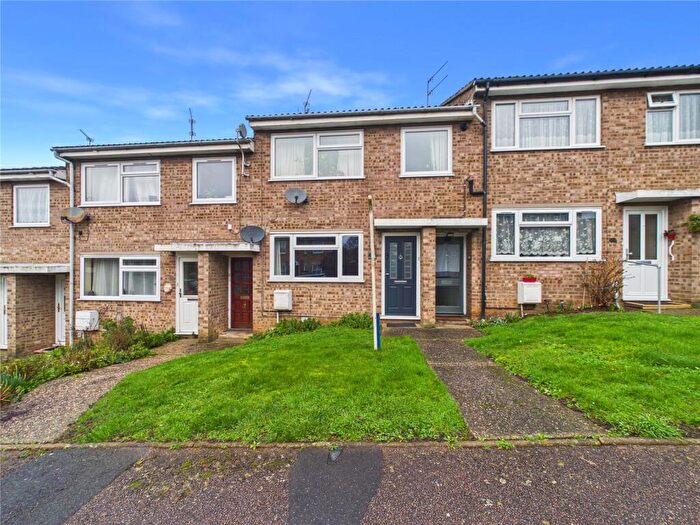
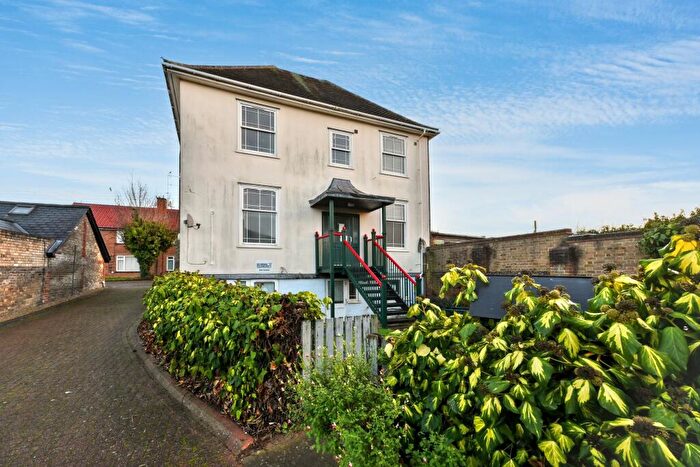
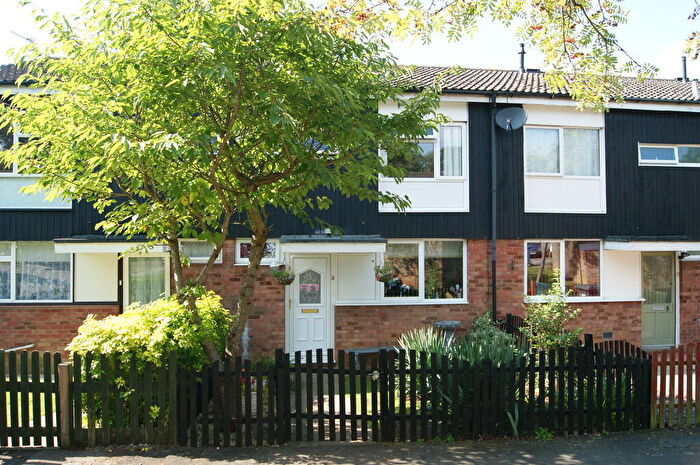
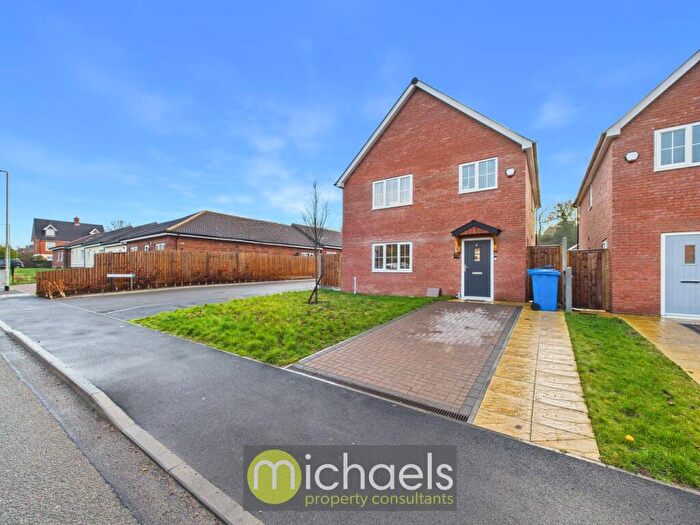
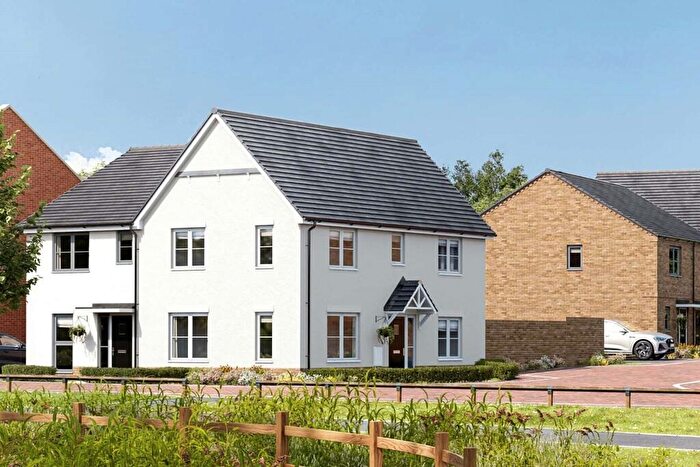
Properties in Sudbury East have an average house price of £257,958.00 and had 188 Property Transactions within the last 3 years¹.
Sudbury East is an area in Sudbury, Suffolk with 1,849 households², where the most expensive property was sold for £492,500.00.
Properties for sale in Sudbury East
Roads and Postcodes in Sudbury East
Navigate through our locations to find the location of your next house in Sudbury East, Sudbury for sale or to rent.
| Streets | Postcodes |
|---|---|
| Acton Close | CO10 1QZ |
| Acton Lane | CO10 1QN CO10 1QW |
| Addison Road | CO10 2YW |
| Alder Way | CO10 1BH |
| Alexandra Road | CO10 2RY |
| Ashmere Rise | CO10 2QE |
| Aubrey Drive | CO10 1PY |
| Banham Drive | CO10 2GN |
| Beatty Road | CO10 1PL |
| Belle Vue Road | CO10 2PP |
| Bridge Terrace | CO10 2TT |
| Burroughs Piece Road | CO10 2PR |
| Byford Road | CO10 2YG |
| Cavendish Way | CO10 2TZ |
| Chelsea Court | CO10 2HH |
| Chelsea Road | CO10 2RU |
| Chilton Industrial Estate | CO10 2XD |
| Constitution Hill | CO10 2PT |
| Deben Drive | CO10 2QH |
| Dobbs Hill | CO10 1UP |
| Drake Road | CO10 1PN |
| East Street | CO10 2TP CO10 2TR CO10 2TU |
| Essex Avenue | CO10 1WQ CO10 1YZ |
| Fields View | CO10 1BJ |
| First Avenue | CO10 1QT CO10 1QU |
| Girling Street | CO10 1LZ |
| Hares Walk | CO10 1BL |
| Harpclose Road | CO10 1QP |
| Herbert Close | CO10 1QF CO10 1QG |
| Highfield Road | CO10 2QJ |
| Jameson Place | CO10 1UR |
| Landsdown Road | CO10 2QF CO10 2QG CO10 2QQ |
| Marlborough Drive | CO10 2PS |
| Minden Road | CO10 2TX CO10 2TY |
| Nelson Road | CO10 1PW |
| Newmans Road | CO10 1UA |
| Newton Road | CO10 2RP CO10 2RS |
| Park Close | CO10 2XZ |
| Park Road | CO10 2QB |
| Prince Charles Close | CO10 1YT |
| Queens Close | CO10 1US |
| Raleigh Close | CO10 1YF |
| Raleigh Road | CO10 1YE |
| Reddells Close | CO10 2PW |
| Reynolds Way | CO10 1PS CO10 1PT CO10 1PU |
| Rimmer Close | CO10 1PX |
| Rubens Walk | CO10 1PR CO10 1QB CO10 1QD CO10 1QE |
| Second Avenue | CO10 1QX CO10 1QY |
| Springfield Terrace | CO10 2TS |
| Stanley Wood Avenue | CO10 1WA CO10 1WB |
| Talbot Road | CO10 1WD CO10 1WE CO10 1WG |
| The Close | CO10 2QA |
| The Hawthorns | CO10 1PP |
| Trafalgar Road | CO10 1FA |
| Turner Close | CO10 1QA |
| Upper East Street | CO10 1UB |
| Waldingfield Road | CO10 2PU CO10 2PX CO10 2PY CO10 2PZ CO10 2QS |
| Wheelers Close | CO10 2GB |
| Windermere Road | CO10 2QD |
Transport near Sudbury East
- FAQ
- Price Paid By Year
- Property Type Price
Frequently asked questions about Sudbury East
What is the average price for a property for sale in Sudbury East?
The average price for a property for sale in Sudbury East is £257,958. This amount is 25% lower than the average price in Sudbury. There are 782 property listings for sale in Sudbury East.
What streets have the most expensive properties for sale in Sudbury East?
The streets with the most expensive properties for sale in Sudbury East are Park Close at an average of £415,000, Prince Charles Close at an average of £390,000 and Chelsea Court at an average of £385,000.
What streets have the most affordable properties for sale in Sudbury East?
The streets with the most affordable properties for sale in Sudbury East are Cavendish Way at an average of £122,000, Minden Road at an average of £145,600 and The Hawthorns at an average of £154,250.
Which train stations are available in or near Sudbury East?
Some of the train stations available in or near Sudbury East are Sudbury, Bures and Chappel and Wakes Colne.
Property Price Paid in Sudbury East by Year
The average sold property price by year was:
| Year | Average Sold Price | Price Change |
Sold Properties
|
|---|---|---|---|
| 2025 | £254,780 | 0,1% |
57 Properties |
| 2024 | £254,529 | -4% |
67 Properties |
| 2023 | £264,377 | -8% |
64 Properties |
| 2022 | £284,804 | 10% |
74 Properties |
| 2021 | £256,882 | 16% |
98 Properties |
| 2020 | £216,973 | -4% |
66 Properties |
| 2019 | £226,198 | -5% |
63 Properties |
| 2018 | £237,269 | -3% |
68 Properties |
| 2017 | £245,404 | 16% |
90 Properties |
| 2016 | £206,503 | 15% |
97 Properties |
| 2015 | £175,931 | -1% |
75 Properties |
| 2014 | £176,908 | 3% |
95 Properties |
| 2013 | £171,470 | -1% |
74 Properties |
| 2012 | £173,533 | 9% |
72 Properties |
| 2011 | £158,058 | 1% |
65 Properties |
| 2010 | £155,707 | 7% |
56 Properties |
| 2009 | £145,244 | -12% |
67 Properties |
| 2008 | £162,470 | -6% |
85 Properties |
| 2007 | £171,410 | 5% |
134 Properties |
| 2006 | £162,182 | 9% |
115 Properties |
| 2005 | £147,831 | 2% |
100 Properties |
| 2004 | £144,387 | 5% |
110 Properties |
| 2003 | £137,884 | 21% |
151 Properties |
| 2002 | £109,600 | 24% |
138 Properties |
| 2001 | £83,652 | 11% |
132 Properties |
| 2000 | £74,505 | 20% |
127 Properties |
| 1999 | £59,631 | 15% |
109 Properties |
| 1998 | £50,891 | -2% |
84 Properties |
| 1997 | £52,042 | 12% |
101 Properties |
| 1996 | £45,598 | 4% |
107 Properties |
| 1995 | £43,711 | - |
80 Properties |
Property Price per Property Type in Sudbury East
Here you can find historic sold price data in order to help with your property search.
The average Property Paid Price for specific property types in the last three years are:
| Property Type | Average Sold Price | Sold Properties |
|---|---|---|
| Semi Detached House | £259,578.00 | 46 Semi Detached Houses |
| Detached House | £353,108.00 | 46 Detached Houses |
| Terraced House | £217,185.00 | 89 Terraced Houses |
| Flat | £140,428.00 | 7 Flats |

