Houses for sale & to rent in Sudbury North, Sudbury
House Prices in Sudbury North
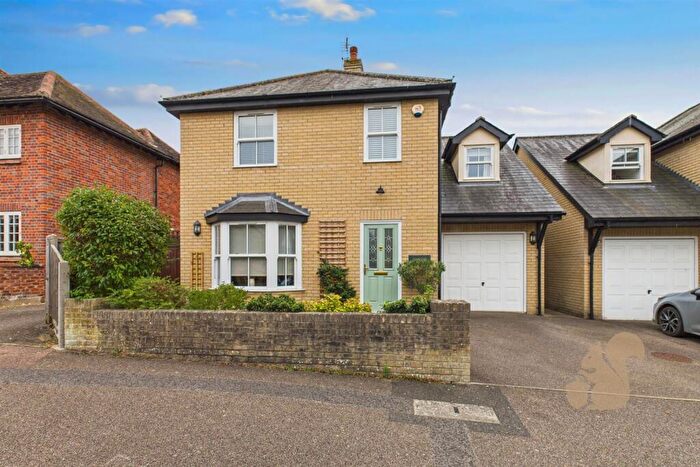
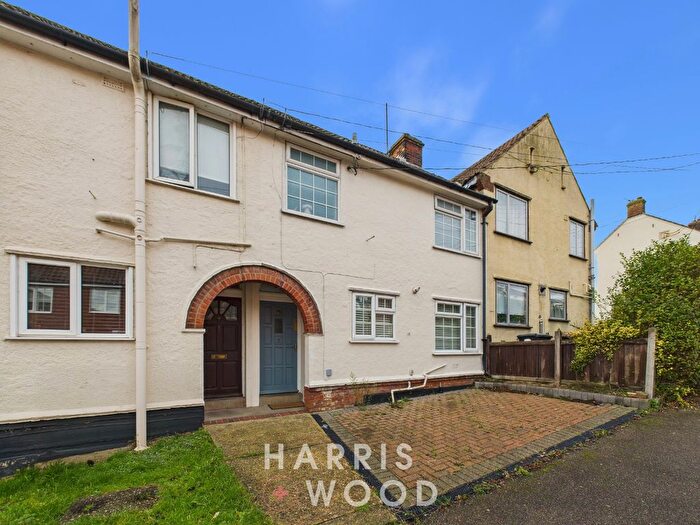
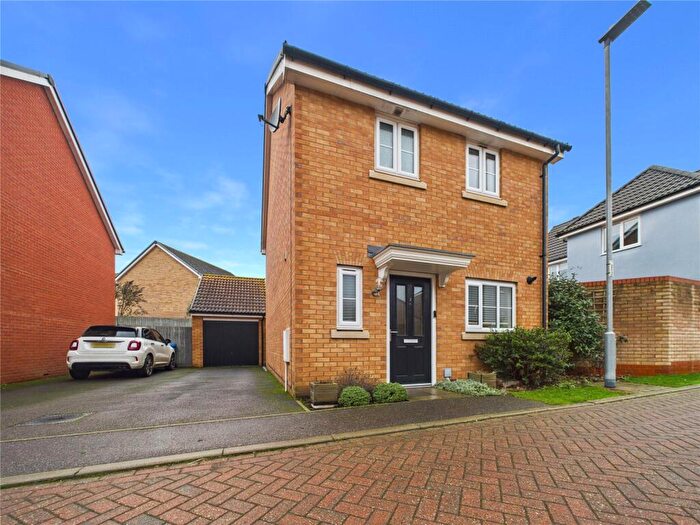
Properties in Sudbury North have an average house price of £313,501.00 and had 157 Property Transactions within the last 3 years¹.
Sudbury North is an area in Sudbury, Suffolk with 1,727 households², where the most expensive property was sold for £615,000.00.
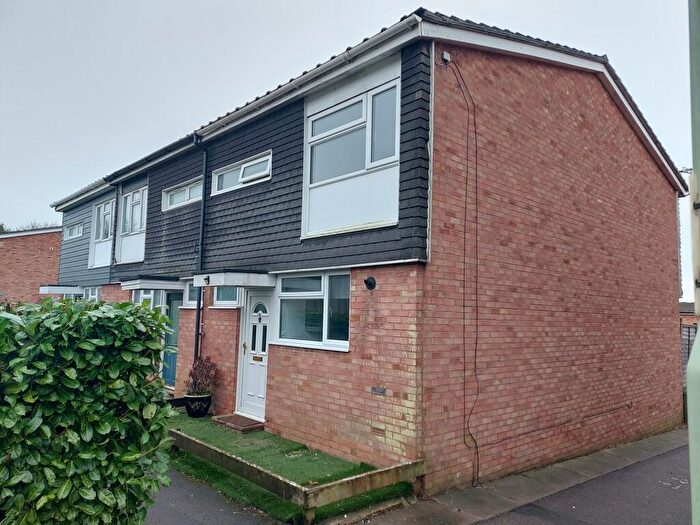
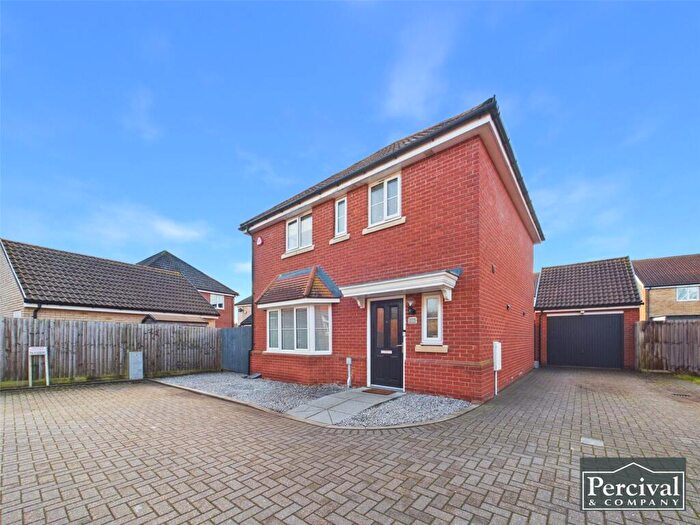
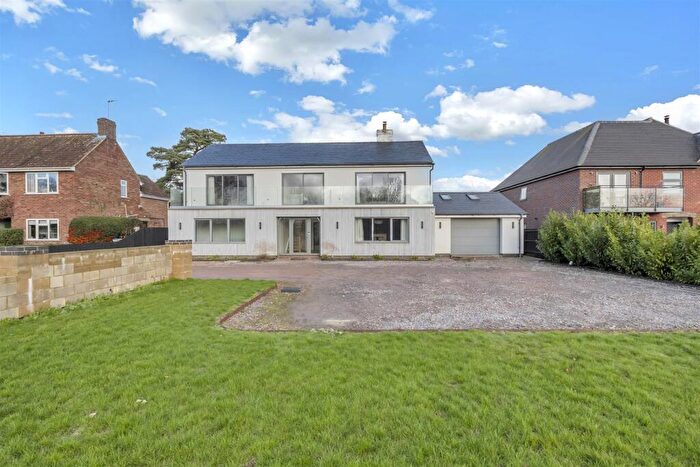
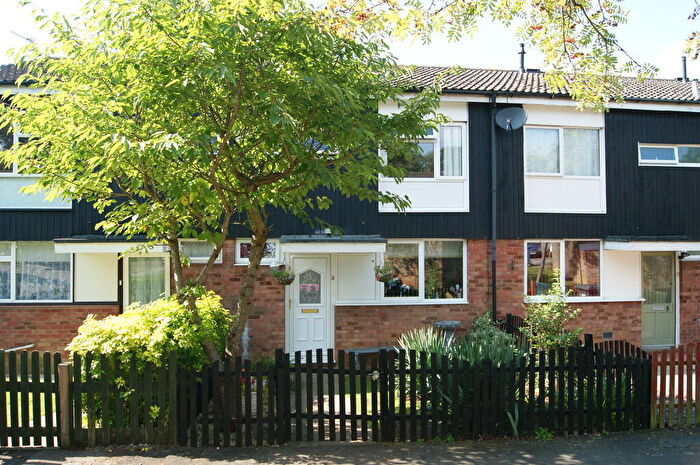
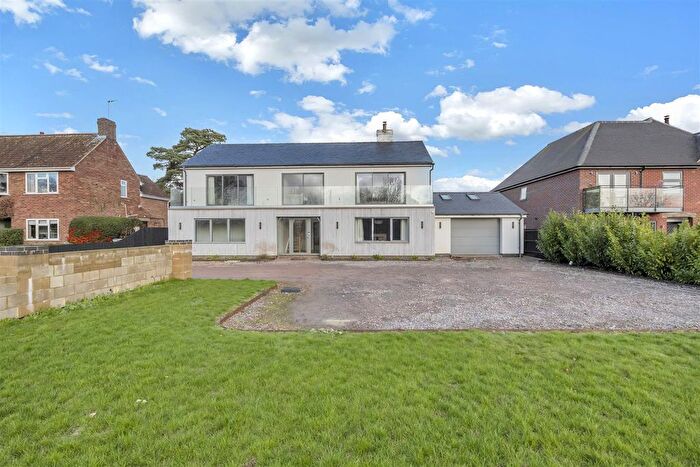
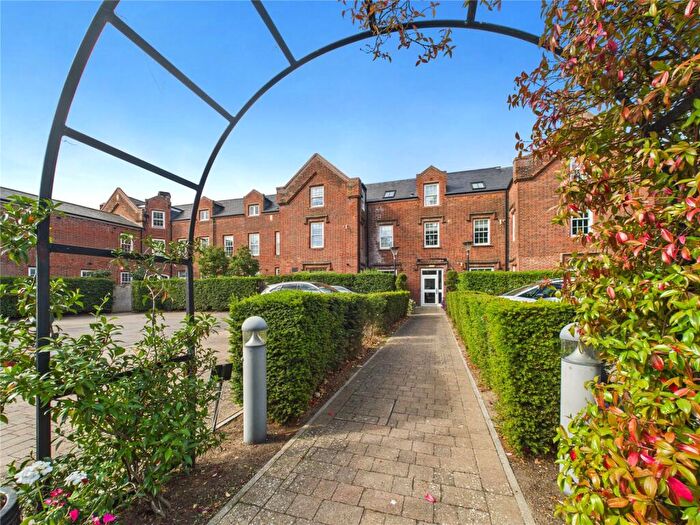
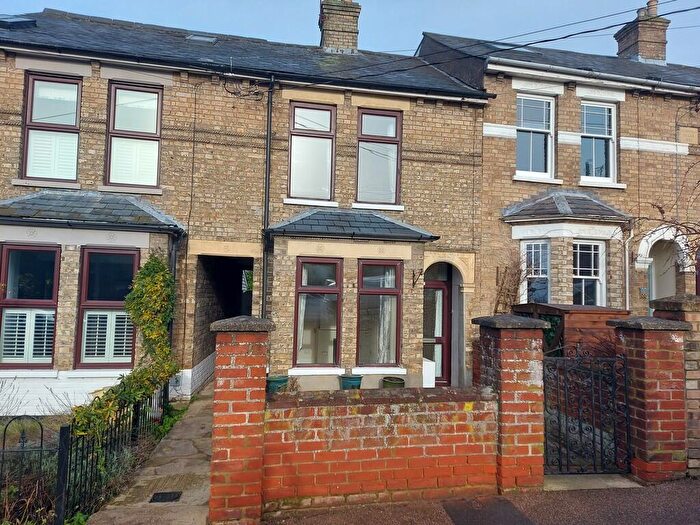
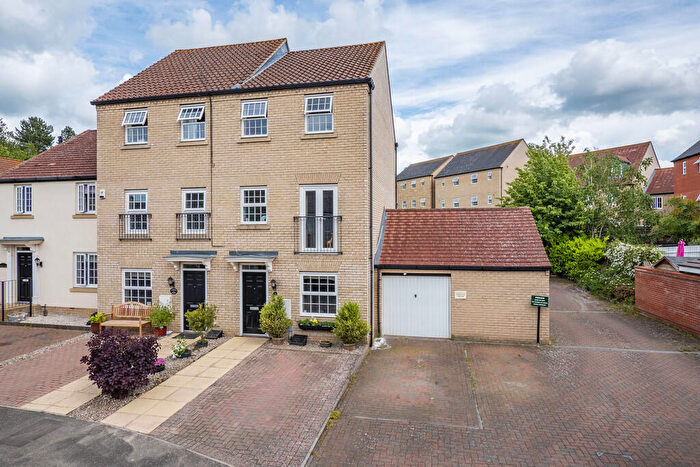
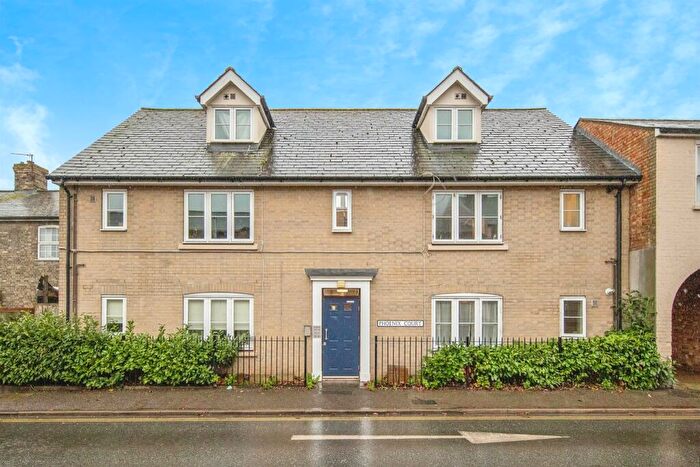
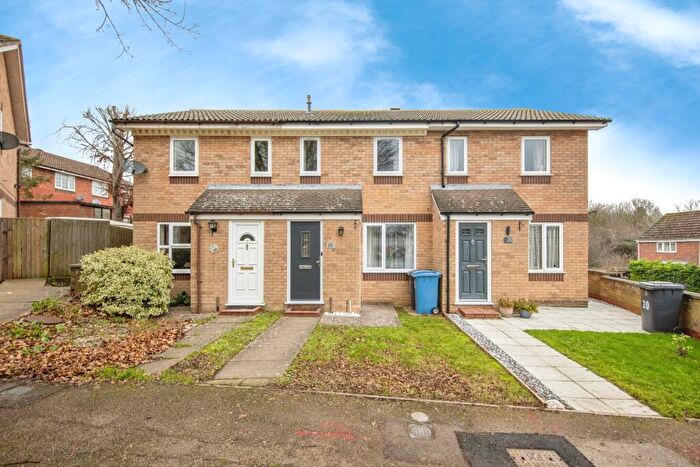
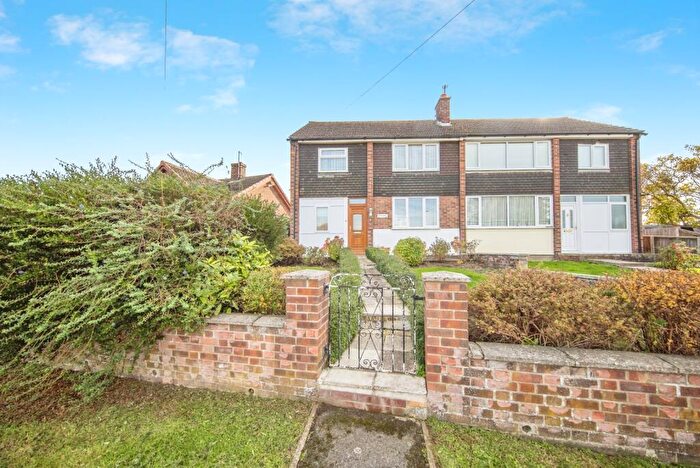
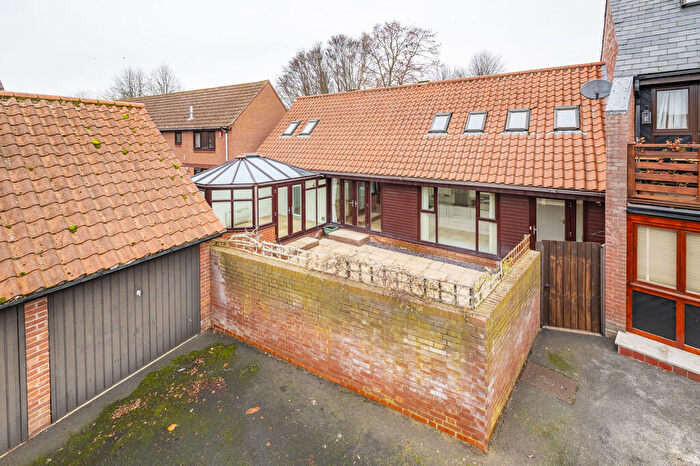
Properties for sale in Sudbury North
Roads and Postcodes in Sudbury North
Navigate through our locations to find the location of your next house in Sudbury North, Sudbury for sale or to rent.
| Streets | Postcodes |
|---|---|
| Abbey Road | CO10 1LA |
| Beaconsfield Close | CO10 1JR |
| Bishops Close | CO10 1GU |
| Cann Close | CO10 1YA |
| Canterbury Road | CO10 1LJ CO10 1LL |
| Chantry Close | CO10 1GA |
| Chaucer Road | CO10 1LN CO10 1LU CO10 1YS |
| Churchill Drive | CO10 1LE CO10 1NZ |
| Clarence Road | CO10 1NJ |
| Clermont Avenue | CO10 1AE CO10 1ZJ CO10 1ZN |
| Colneys Close | CO10 1LH |
| Constable Road | CO10 1UG CO10 1UQ |
| Courtenay Close | CO10 1YR |
| Deanery Close | CO10 1GE |
| Gloucester Way | CO10 1LW |
| Grosvenor Road | CO10 1FE CO10 1GD |
| Hawkins Road | CO10 1YD |
| Head Way | CO10 1YB |
| Highview Close | CO10 1LY |
| Hillcrest Road | CO10 1PA |
| Hitchcock Place | CO10 1NN |
| Hoxter Way | CO10 1WN |
| Humphry Road | CO10 1UD |
| Jubilee Road | CO10 1UE |
| Lancaster Road | CO10 1LR |
| Lombardy Road | CO10 1LQ |
| Manor Road | CO10 1PB |
| Melford Road | CO10 1JS CO10 1JT CO10 1JU CO10 1JX CO10 1JY CO10 1JZ CO10 1LS CO10 1LT CO10 1XT CO10 1XU |
| Moulton Close | CO10 1UY |
| Mountbatten Close | CO10 1YX |
| Mountbatten Road | CO10 1YY |
| New Queens Road | CO10 1PJ |
| Parker Place | CO10 1YG |
| Parkwood Drive | CO10 1LX |
| Pembroke Place | CO10 1JW |
| Priory Road | CO10 1LB |
| Queens Road | CO10 1PG CO10 1PQ |
| Richard Burn Way | CO10 1SW CO10 1SY |
| Rochester Way | CO10 1LP |
| Springfield Road | CO10 1PH |
| St Bartholomews Lane | CO10 1LG CO10 1XP |
| St Benedicts Close | CO10 1AF |
| Stanley Road | CO10 1NH |
| Suffolk Road | CO10 1UW |
| Suffolk Square | CO10 1UJ |
| Tudor Close | CO10 1LF |
| Tudor Green | CO10 1YP |
| Tudor Road | CO10 1LD CO10 1NP CO10 1NR CO10 1NS CO10 1NT |
| Uplands Crescent | CO10 1NU |
| Uplands Road | CO10 1NX CO10 1NY |
| Woodhall Close | CO10 1PD |
| Woodhall Road | CO10 1PE CO10 1PF CO10 1SR |
| York Close | CO10 1NQ |
| York Road | CO10 1NE CO10 1NF CO10 1QH |
Transport near Sudbury North
- FAQ
- Price Paid By Year
- Property Type Price
Frequently asked questions about Sudbury North
What is the average price for a property for sale in Sudbury North?
The average price for a property for sale in Sudbury North is £313,501. This amount is 8% lower than the average price in Sudbury. There are 658 property listings for sale in Sudbury North.
What streets have the most expensive properties for sale in Sudbury North?
The streets with the most expensive properties for sale in Sudbury North are Grosvenor Road at an average of £550,000, Cann Close at an average of £460,000 and Rochester Way at an average of £453,571.
What streets have the most affordable properties for sale in Sudbury North?
The streets with the most affordable properties for sale in Sudbury North are Suffolk Square at an average of £75,166, Hawkins Road at an average of £173,199 and Hitchcock Place at an average of £192,000.
Which train stations are available in or near Sudbury North?
Some of the train stations available in or near Sudbury North are Sudbury, Bures and Chappel and Wakes Colne.
Property Price Paid in Sudbury North by Year
The average sold property price by year was:
| Year | Average Sold Price | Price Change |
Sold Properties
|
|---|---|---|---|
| 2025 | £313,663 | 4% |
58 Properties |
| 2024 | £301,277 | -9% |
55 Properties |
| 2023 | £328,568 | -3% |
44 Properties |
| 2022 | £339,171 | 6% |
60 Properties |
| 2021 | £320,455 | 14% |
86 Properties |
| 2020 | £274,512 | 0,3% |
53 Properties |
| 2019 | £273,595 | 3% |
73 Properties |
| 2018 | £265,555 | -3% |
58 Properties |
| 2017 | £272,999 | 8% |
59 Properties |
| 2016 | £250,272 | 0,4% |
77 Properties |
| 2015 | £249,390 | 18% |
83 Properties |
| 2014 | £205,417 | 5% |
76 Properties |
| 2013 | £194,157 | -1% |
76 Properties |
| 2012 | £195,342 | 1% |
66 Properties |
| 2011 | £194,304 | 11% |
59 Properties |
| 2010 | £172,515 | 2% |
69 Properties |
| 2009 | £168,729 | 4% |
67 Properties |
| 2008 | £161,772 | -27% |
71 Properties |
| 2007 | £205,150 | -8% |
115 Properties |
| 2006 | £222,549 | 24% |
101 Properties |
| 2005 | £169,634 | -5% |
65 Properties |
| 2004 | £178,737 | 19% |
78 Properties |
| 2003 | £143,895 | 1% |
70 Properties |
| 2002 | £142,291 | 28% |
78 Properties |
| 2001 | £101,781 | 12% |
90 Properties |
| 2000 | £89,925 | 13% |
61 Properties |
| 1999 | £77,995 | 5% |
95 Properties |
| 1998 | £74,042 | 11% |
76 Properties |
| 1997 | £65,574 | -2% |
92 Properties |
| 1996 | £66,918 | 8% |
95 Properties |
| 1995 | £61,340 | - |
48 Properties |
Property Price per Property Type in Sudbury North
Here you can find historic sold price data in order to help with your property search.
The average Property Paid Price for specific property types in the last three years are:
| Property Type | Average Sold Price | Sold Properties |
|---|---|---|
| Semi Detached House | £299,133.00 | 58 Semi Detached Houses |
| Detached House | £411,570.00 | 50 Detached Houses |
| Terraced House | £252,255.00 | 41 Terraced Houses |
| Flat | £118,625.00 | 8 Flats |

