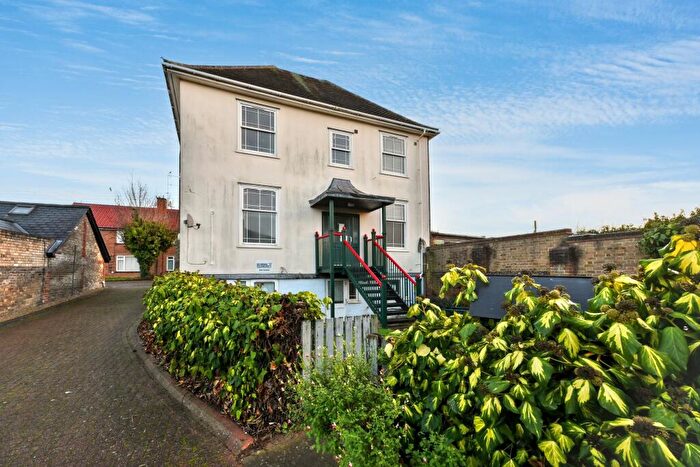
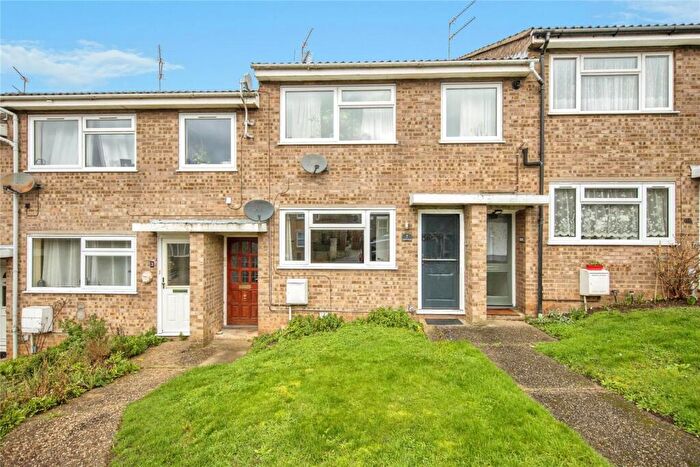
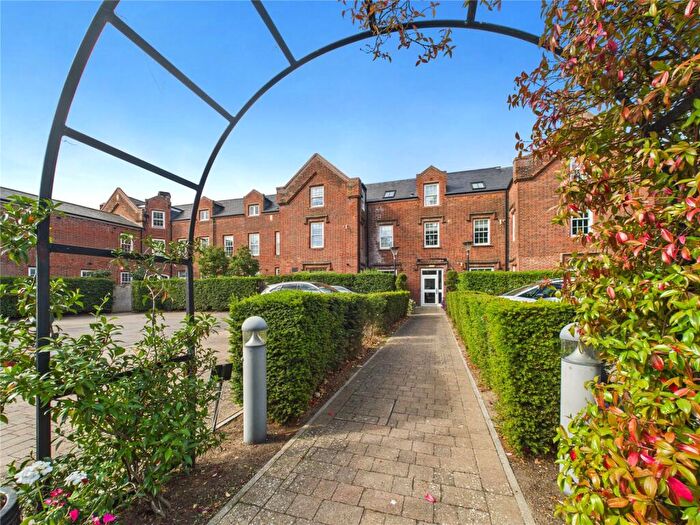
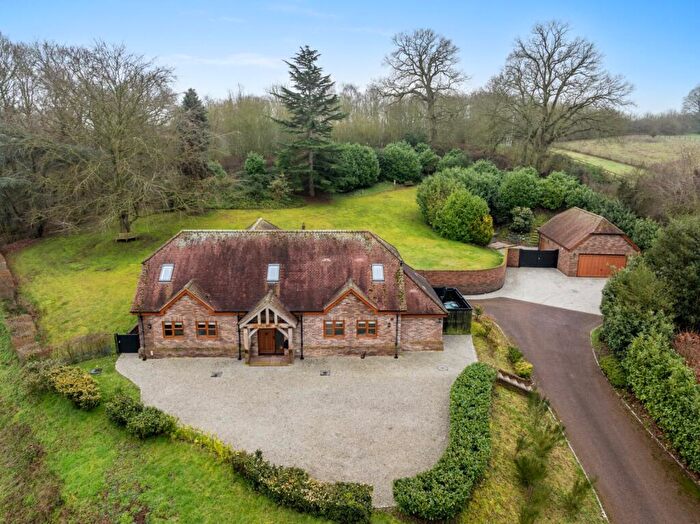
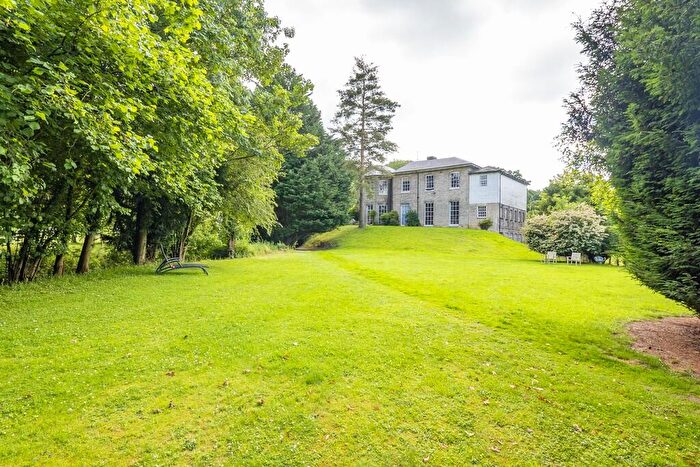
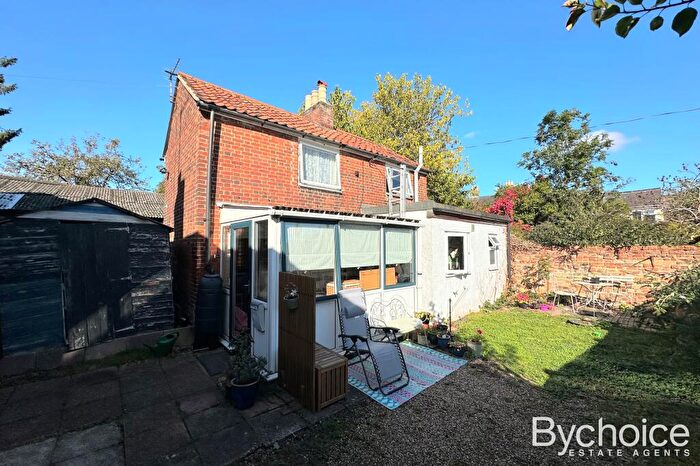
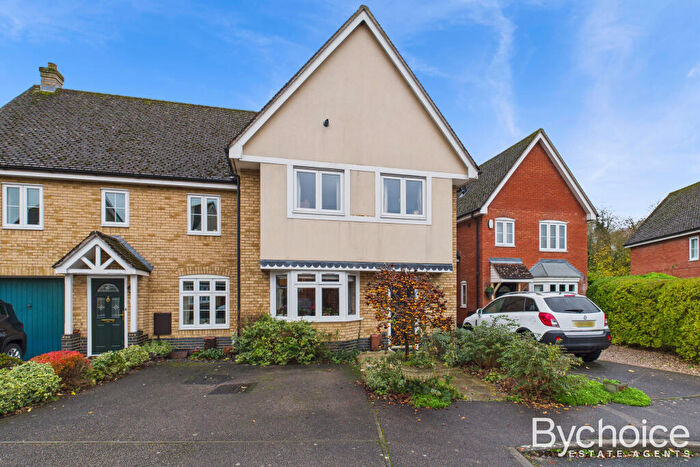
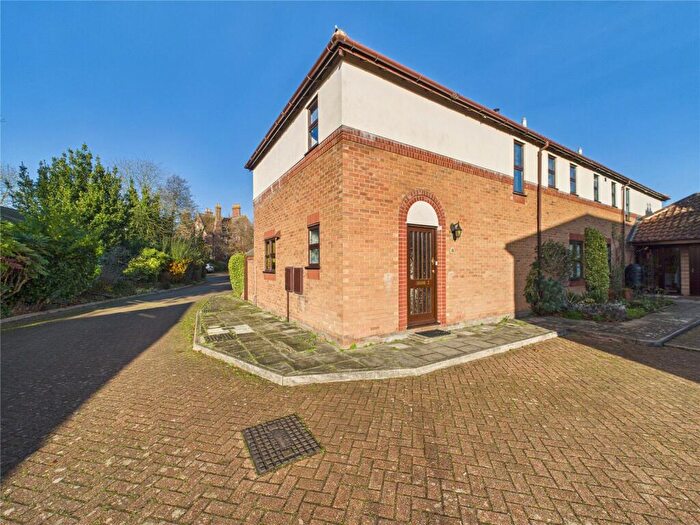
Houses for sale & to rent in Sudbury South West, Sudbury
House Prices in Sudbury South West
Properties in Sudbury South West have an average house price of £213,045.00 and had 11 Property Transactions within the last 3 years¹.
Sudbury South West is an area in Sudbury, Suffolk with 71 households², where the most expensive property was sold for £300,000.00.
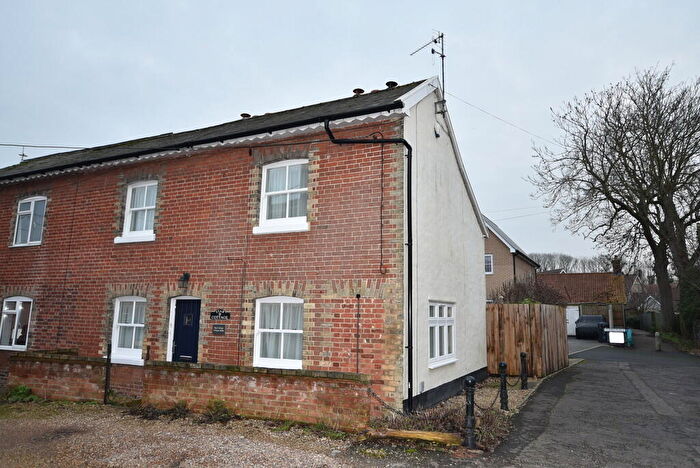
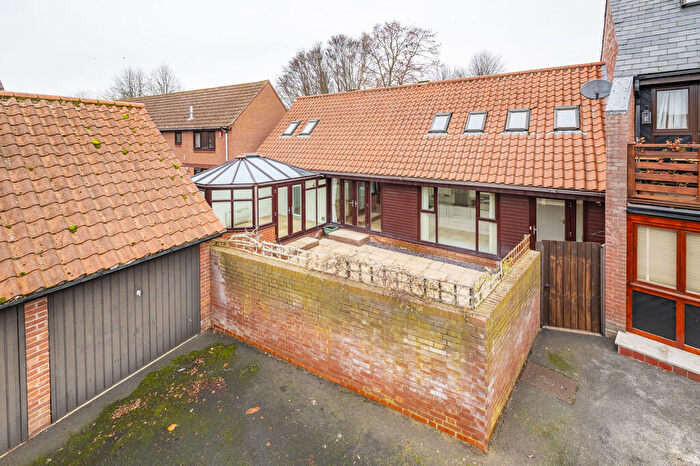
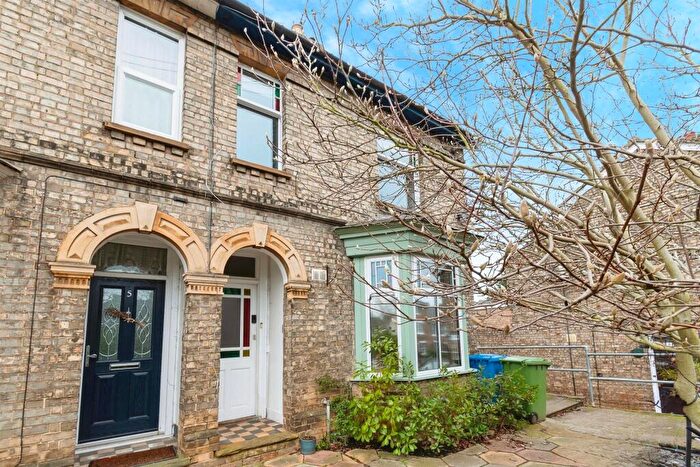
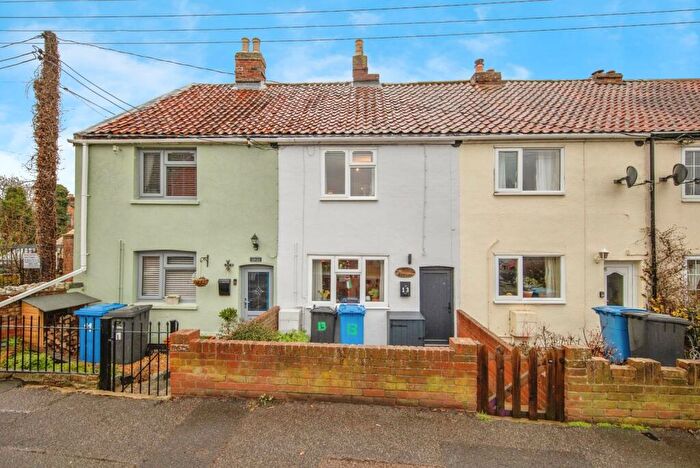
Properties for sale in Sudbury South West
Roads and Postcodes in Sudbury South West
Navigate through our locations to find the location of your next house in Sudbury South West, Sudbury for sale or to rent.
| Streets | Postcodes |
|---|---|
| Ballingdon Hill | CO10 7LH |
| Ballingdon Street | CO10 2BZ CO10 2DY |
| Borhamgate Precinct | CO10 2EE |
| Braybrooke Mews | CO10 2DE |
| Brundon Lane | CO10 7FQ CO10 7GB |
| Bulmer Road | CO10 7FP |
| Bulmer Terrace | CO10 7SR |
| Cross Street | CO10 2DS |
| Friars Street | CO10 2AD |
| Gainsborough Yard | CO10 7GY |
| Great Eastern Road | CO10 2TJ |
| Hamilton Road | CO10 2UU |
| Hanover Court | CO10 2TE |
| Ingrams Well Road | CO10 2XJ |
| King Charles Court | CO10 2FG |
| King Street | CO10 2EH |
| Market Hill | CO10 2EL CO10 2EP CO10 2ER CO10 2ES |
| Middleton Road | CO10 2GS |
| Priory Walk | CO10 2FE |
| Robert Darry Close | CO10 7FS |
| Sandy Lane | CO10 7HL |
| School Street | CO10 2AW |
| St Leonards Drive | CO10 2RQ |
| Station Road | CO10 2SU |
| Thomas West Court | CO10 7FR |
| CO10 2ED CO10 2FA |
Transport near Sudbury South West
- FAQ
- Price Paid By Year
- Property Type Price
Frequently asked questions about Sudbury South West
What is the average price for a property for sale in Sudbury South West?
The average price for a property for sale in Sudbury South West is £213,045. This amount is 38% lower than the average price in Sudbury. There are 551 property listings for sale in Sudbury South West.
What streets have the most expensive properties for sale in Sudbury South West?
The street with the most expensive properties for sale in Sudbury South West is Bulmer Road at an average of £280,000.
What streets have the most affordable properties for sale in Sudbury South West?
The street with the most affordable properties for sale in Sudbury South West is Robert Darry Close at an average of £277,500.
Which train stations are available in or near Sudbury South West?
Some of the train stations available in or near Sudbury South West are Sudbury, Bures and Chappel and Wakes Colne.
Property Price Paid in Sudbury South West by Year
The average sold property price by year was:
| Year | Average Sold Price | Price Change |
Sold Properties
|
|---|---|---|---|
| 2025 | £228,750 | 15% |
4 Properties |
| 2024 | £195,100 | -16% |
5 Properties |
| 2023 | £226,500 | -11% |
2 Properties |
| 2022 | £251,583 | 22% |
6 Properties |
| 2021 | £196,666 | -29% |
9 Properties |
| 2020 | £253,615 | -10% |
13 Properties |
| 2019 | £278,329 | -36% |
41 Properties |
| 2018 | £378,333 | 62% |
3 Properties |
| 2014 | £143,333 | -162% |
3 Properties |
| 2006 | £375,000 | 31% |
1 Property |
| 2005 | £260,000 | - |
1 Property |
Property Price per Property Type in Sudbury South West
Here you can find historic sold price data in order to help with your property search.
The average Property Paid Price for specific property types in the last three years are:
| Property Type | Average Sold Price | Sold Properties |
|---|---|---|
| Terraced House | £279,000.00 | 5 Terraced Houses |
| Flat | £158,083.00 | 6 Flats |

