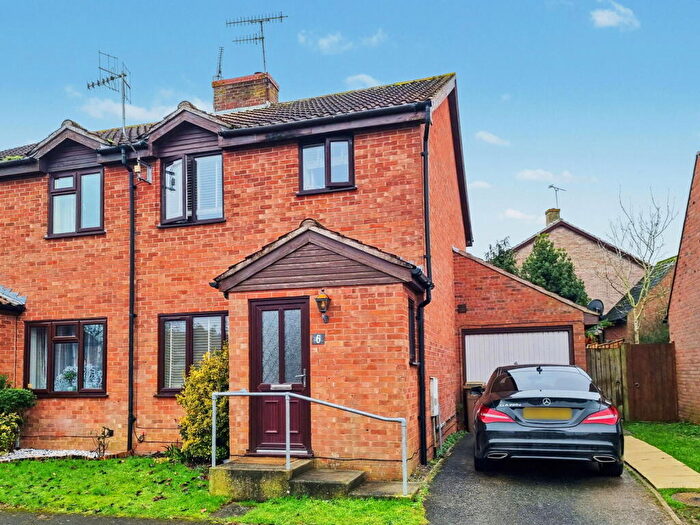
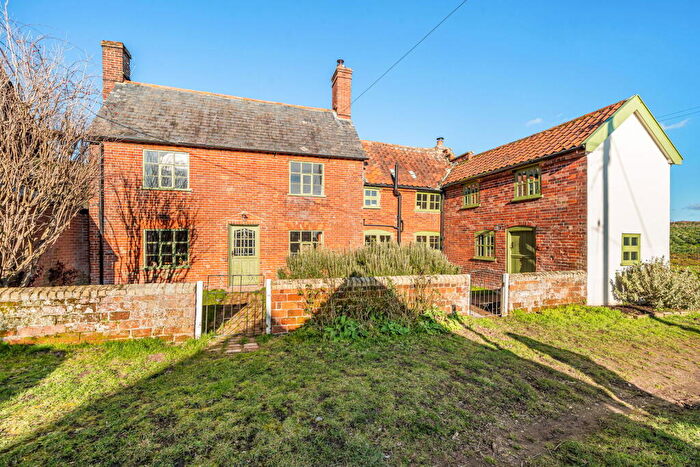
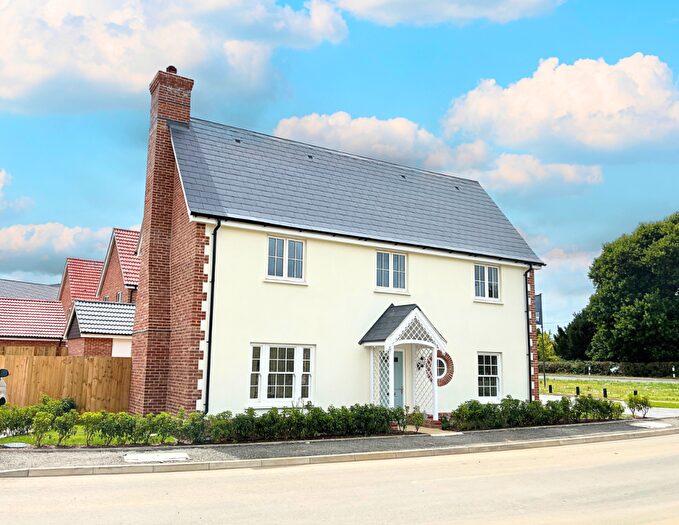
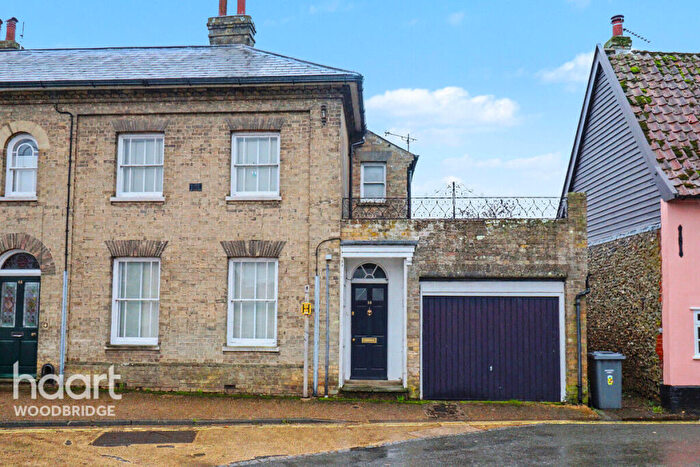
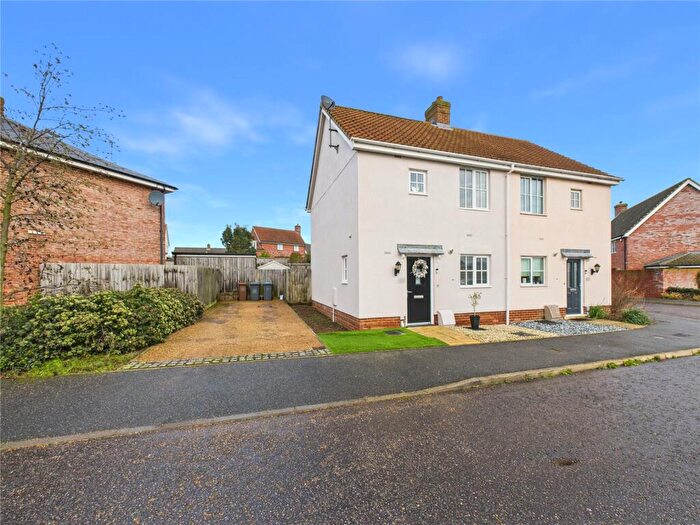
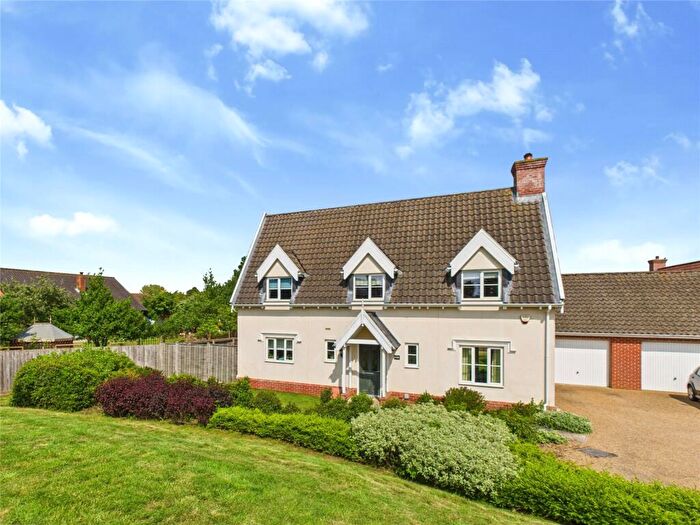
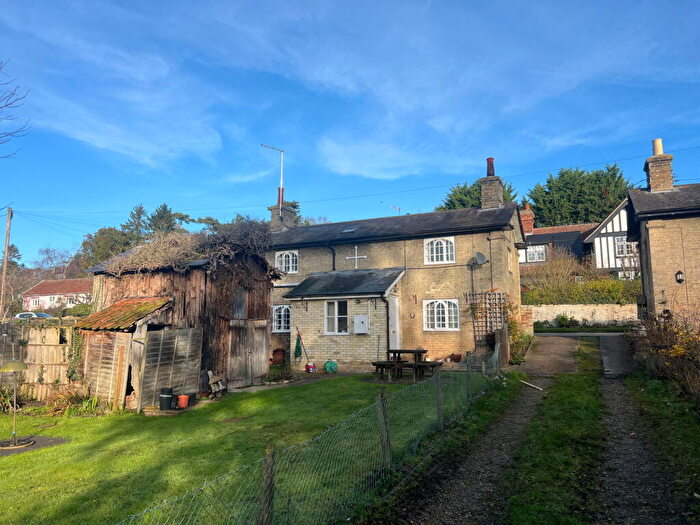
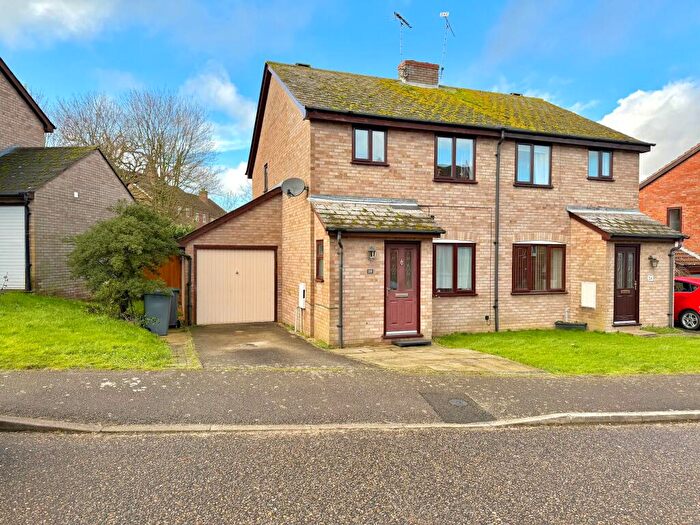
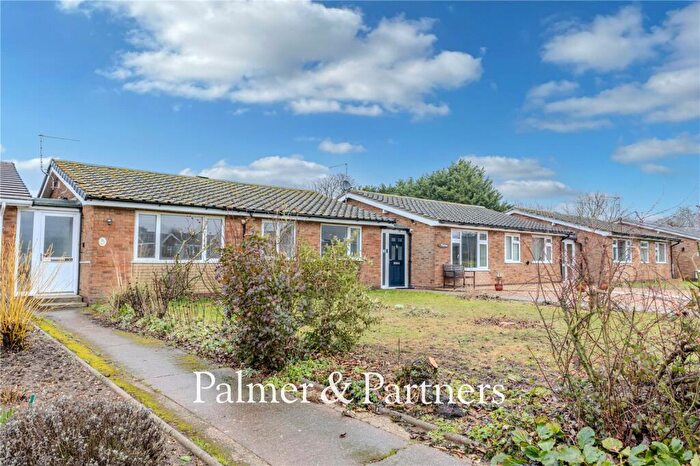
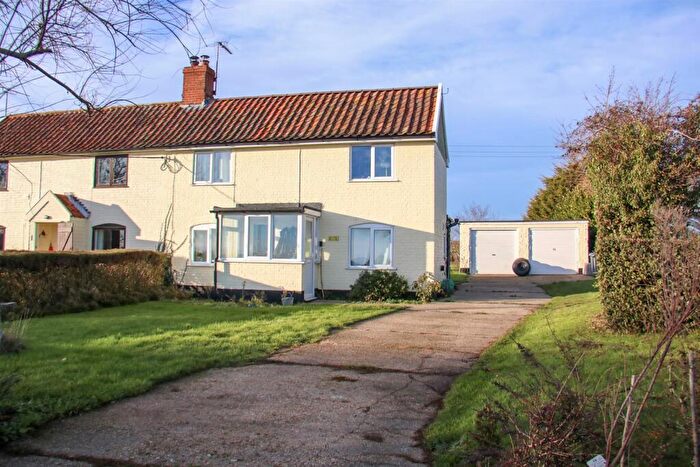
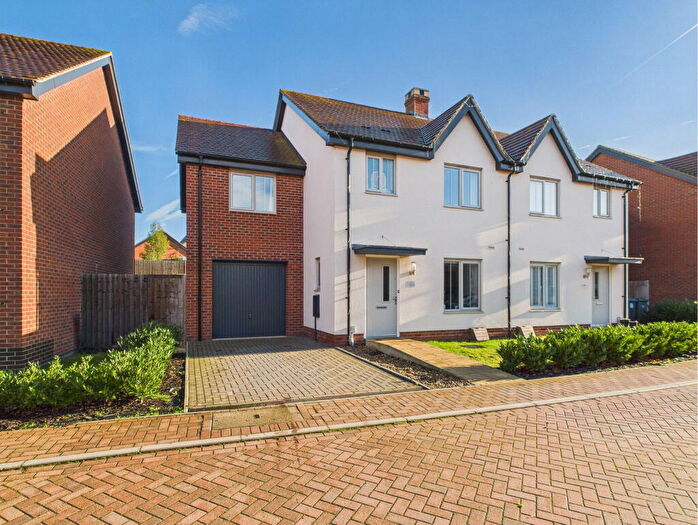
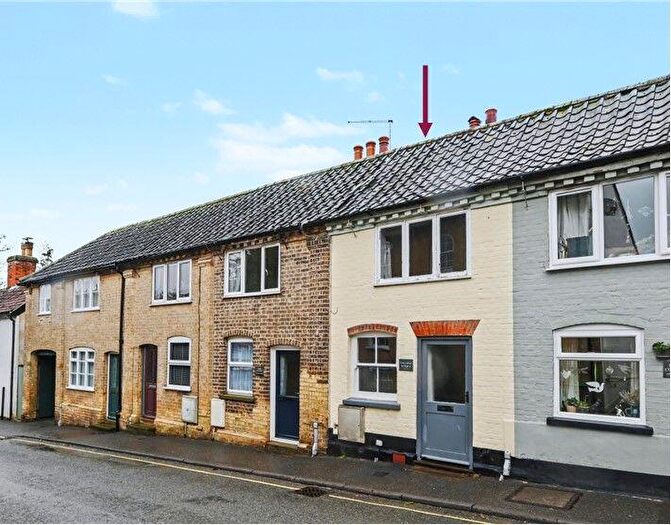
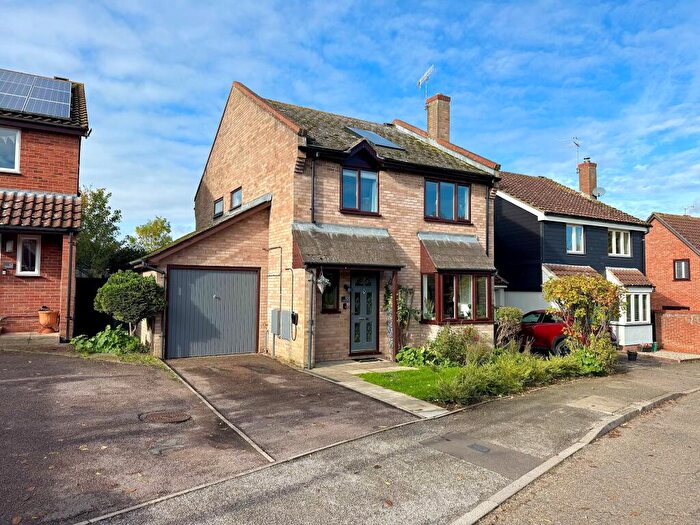
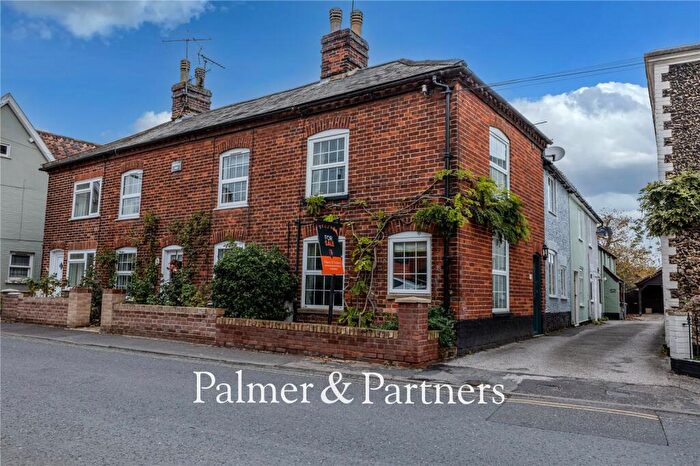
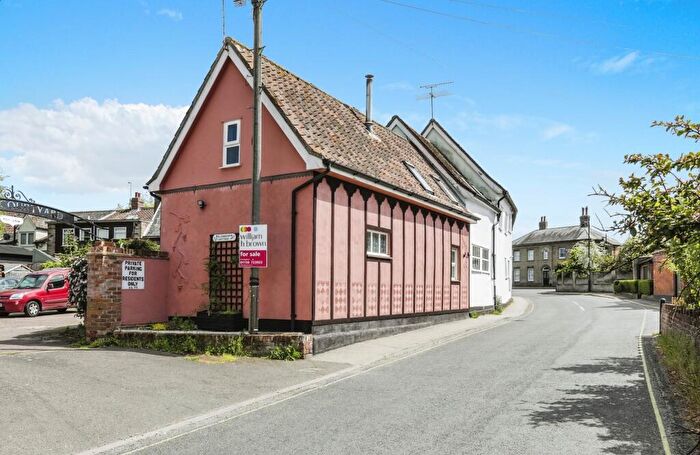
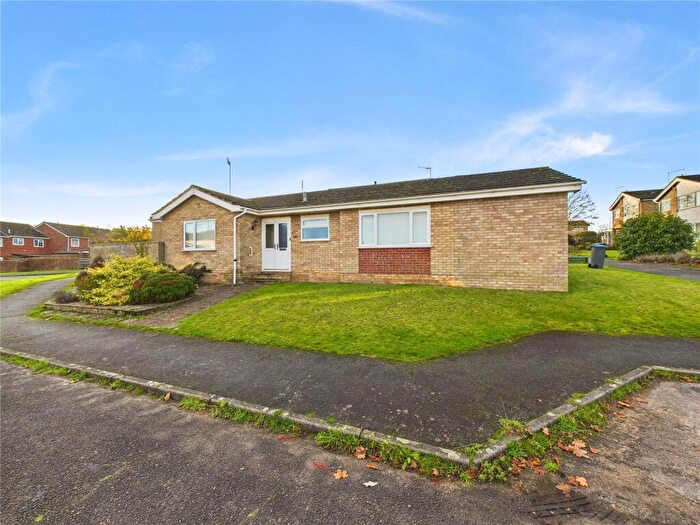
Houses for sale & to rent in Hacheston, Woodbridge
House Prices in Hacheston
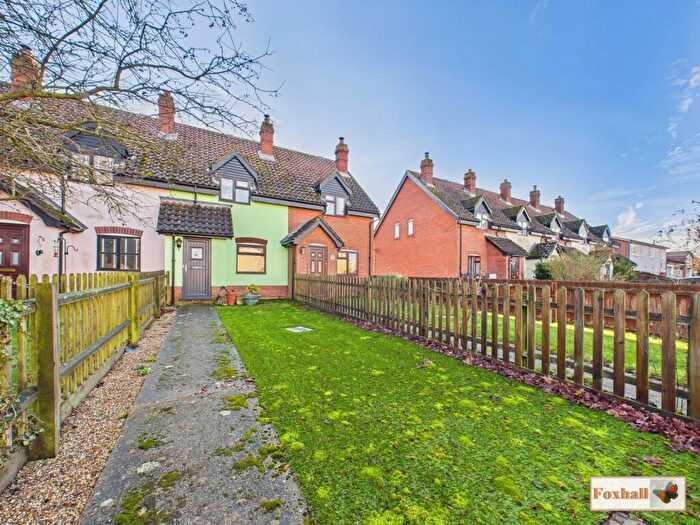
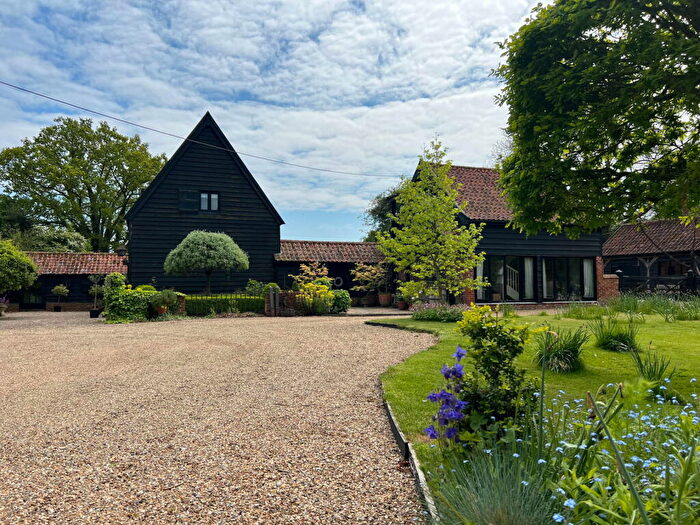
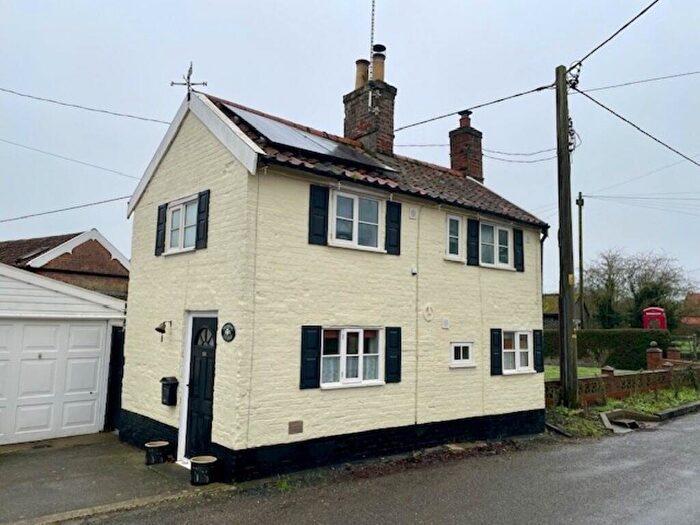
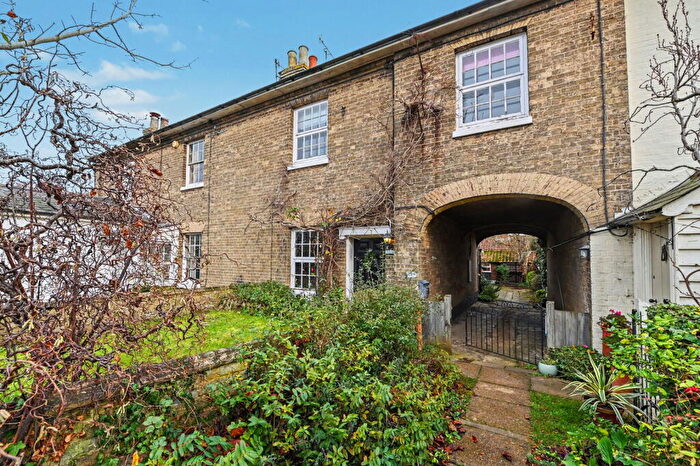
Properties in Hacheston have an average house price of £393,879.00 and had 29 Property Transactions within the last 3 years¹.
Hacheston is an area in Woodbridge, Suffolk with 426 households², where the most expensive property was sold for £2,205,000.00.
Properties for sale in Hacheston
Roads and Postcodes in Hacheston
Navigate through our locations to find the location of your next house in Hacheston, Woodbridge for sale or to rent.
| Streets | Postcodes |
|---|---|
| Ash Road | IP13 0AA IP13 0PB IP13 0PD IP13 0PE |
| Bell Lane | IP13 0AH |
| Blyth Row | IP13 9NB |
| Brick Lane | IP13 9LQ IP13 9NF |
| Butterfly Cottages | IP13 9LU |
| Church Farm Cottages | IP13 9PA |
| Church Road | IP13 0AT IP13 0BG IP13 0BJ |
| Common Farm Cottages | IP13 0BX |
| Easton Lane | IP13 0DY IP13 0DZ |
| Easton Road | IP13 0DX IP13 0EX |
| Ford Road | IP13 0AR IP13 0AS |
| Hall Road | IP13 0AX |
| Holly Cottages | IP13 0AN |
| Long Row | IP13 0DU |
| Low Meadows | IP13 0DQ |
| Low Road | IP13 0AL |
| Main Road | IP13 0AB IP13 0AD IP13 0AG IP13 0AY IP13 0AZ IP13 0BA IP13 0BE IP13 0BS |
| Marlesford Road | IP13 0DP |
| Mill Lane | IP13 0AJ |
| Mount Pleasant | IP13 9PF |
| North Green | IP13 9NW |
| Oaklands | IP13 9PB |
| Red House Farm Cottages | IP13 9NY |
| Shop Lane | IP13 0BD |
| Silverlace Green | IP13 9AD |
| Streetfield | IP13 0BQ |
| The Street | IP13 0AP IP13 0DL IP13 0DN IP13 0DR IP13 0DS IP13 0DT IP13 0DW IP13 9AA |
| Willoughby Close | IP13 9NA |
| IP13 0AE IP13 0DJ IP13 9LY IP13 9LZ IP13 9ND IP13 9NE IP13 9NG IP13 9NH IP13 9NL IP13 9NQ IP13 9NZ IP13 9PD IP13 9PQ IP13 9TB |
Transport near Hacheston
- FAQ
- Price Paid By Year
- Property Type Price
Frequently asked questions about Hacheston
What is the average price for a property for sale in Hacheston?
The average price for a property for sale in Hacheston is £393,879. This amount is 7% lower than the average price in Woodbridge. There are 1,079 property listings for sale in Hacheston.
What streets have the most expensive properties for sale in Hacheston?
The streets with the most expensive properties for sale in Hacheston are Main Road at an average of £437,500, Mill Lane at an average of £407,500 and The Street at an average of £338,590.
What streets have the most affordable properties for sale in Hacheston?
The streets with the most affordable properties for sale in Hacheston are Oaklands at an average of £187,250, Willoughby Close at an average of £291,666 and Hall Road at an average of £307,500.
Which train stations are available in or near Hacheston?
Some of the train stations available in or near Hacheston are Wickham Market, Saxmundham and Melton.
Property Price Paid in Hacheston by Year
The average sold property price by year was:
| Year | Average Sold Price | Price Change |
Sold Properties
|
|---|---|---|---|
| 2025 | £376,875 | 12% |
4 Properties |
| 2024 | £333,076 | -40% |
13 Properties |
| 2023 | £465,416 | 4% |
12 Properties |
| 2022 | £446,250 | 6% |
28 Properties |
| 2021 | £421,665 | 1% |
19 Properties |
| 2020 | £417,177 | 3% |
12 Properties |
| 2019 | £405,150 | 11% |
10 Properties |
| 2018 | £360,464 | 3% |
14 Properties |
| 2017 | £349,323 | 8% |
17 Properties |
| 2016 | £321,600 | -0,3% |
20 Properties |
| 2015 | £322,500 | 8% |
16 Properties |
| 2014 | £296,239 | 22% |
23 Properties |
| 2013 | £230,444 | -19% |
18 Properties |
| 2012 | £274,615 | 8% |
13 Properties |
| 2011 | £253,291 | -5% |
12 Properties |
| 2010 | £266,546 | -7% |
13 Properties |
| 2009 | £284,333 | -2% |
9 Properties |
| 2008 | £290,750 | 16% |
6 Properties |
| 2007 | £243,238 | -27% |
21 Properties |
| 2006 | £308,325 | 26% |
25 Properties |
| 2005 | £229,388 | -29% |
18 Properties |
| 2004 | £296,510 | 22% |
19 Properties |
| 2003 | £231,011 | 33% |
21 Properties |
| 2002 | £154,537 | -14% |
24 Properties |
| 2001 | £176,289 | 31% |
24 Properties |
| 2000 | £121,438 | 13% |
18 Properties |
| 1999 | £105,712 | -2% |
18 Properties |
| 1998 | £107,987 | 26% |
19 Properties |
| 1997 | £80,303 | -13% |
16 Properties |
| 1996 | £90,472 | 21% |
18 Properties |
| 1995 | £71,680 | - |
23 Properties |
Property Price per Property Type in Hacheston
Here you can find historic sold price data in order to help with your property search.
The average Property Paid Price for specific property types in the last three years are:
| Property Type | Average Sold Price | Sold Properties |
|---|---|---|
| Semi Detached House | £334,535.00 | 14 Semi Detached Houses |
| Detached House | £570,833.00 | 9 Detached Houses |
| Terraced House | £266,916.00 | 6 Terraced Houses |

