
Houses for sale in Woodbridge, Suffolk
House Prices in Woodbridge
Properties in Woodbridge have an average house price of £421k and had 1,900 Property Transactions within the last 3 years.¹
Woodbridge is an area in Suffolk with 19,682 households², where the most expensive property was sold for £3M.
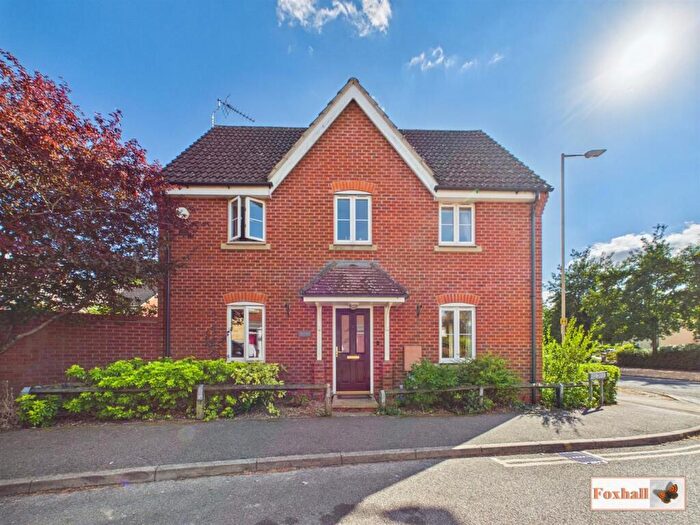
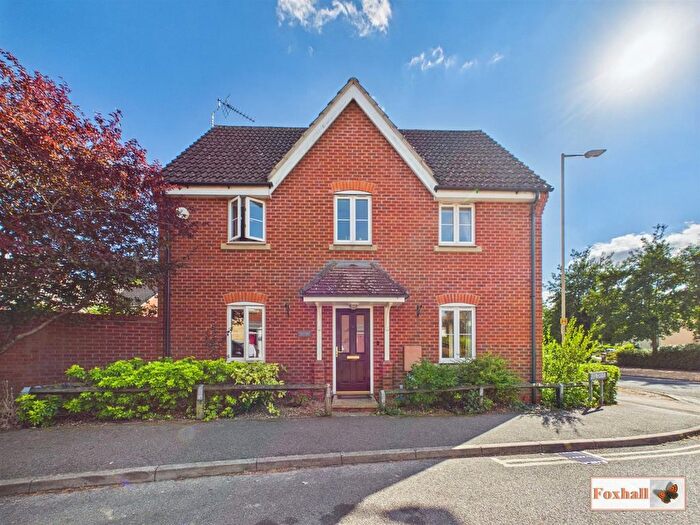
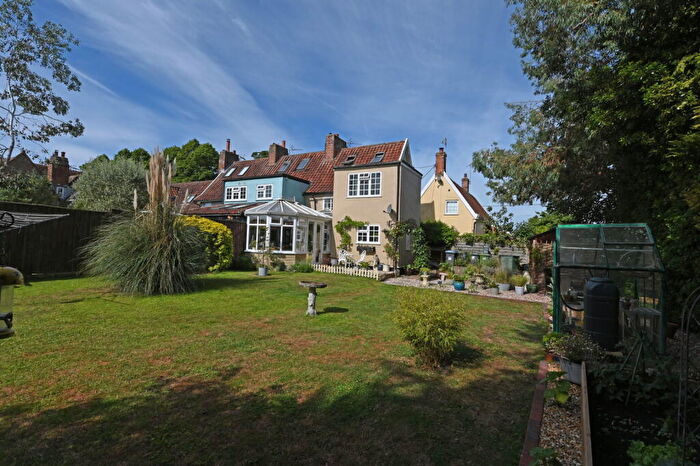
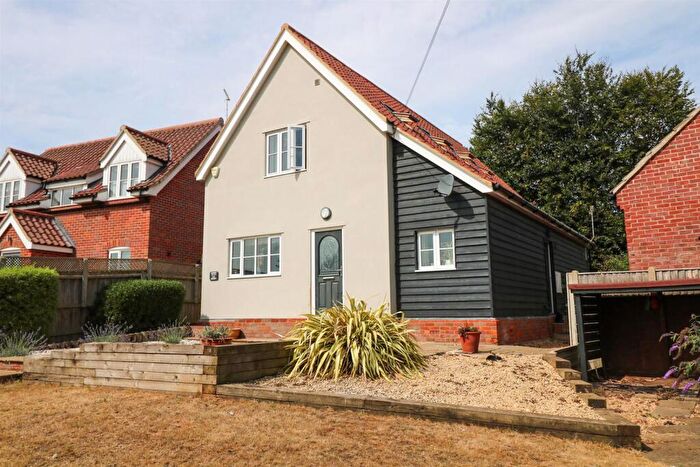
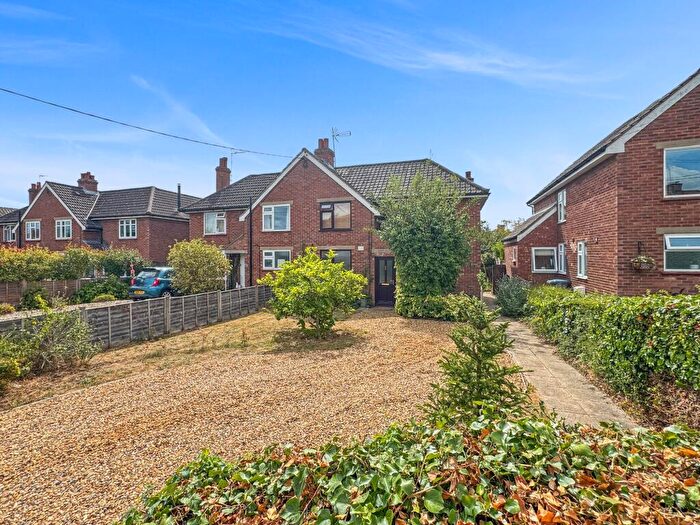
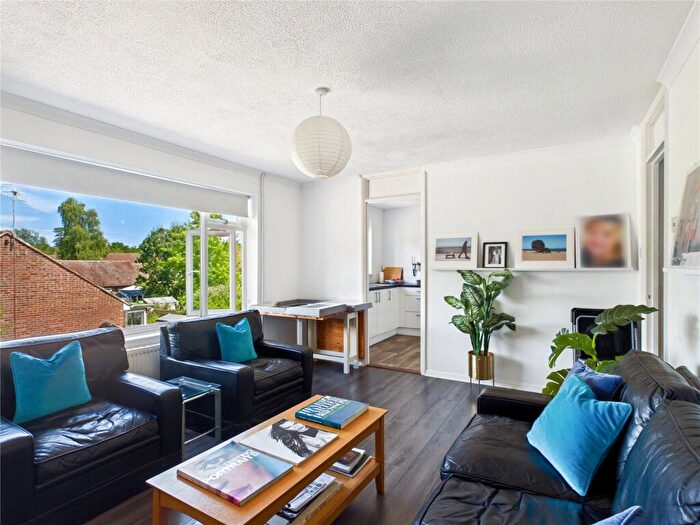
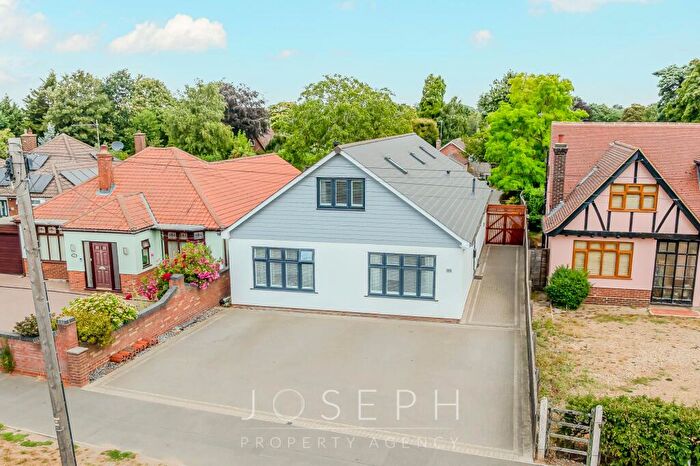
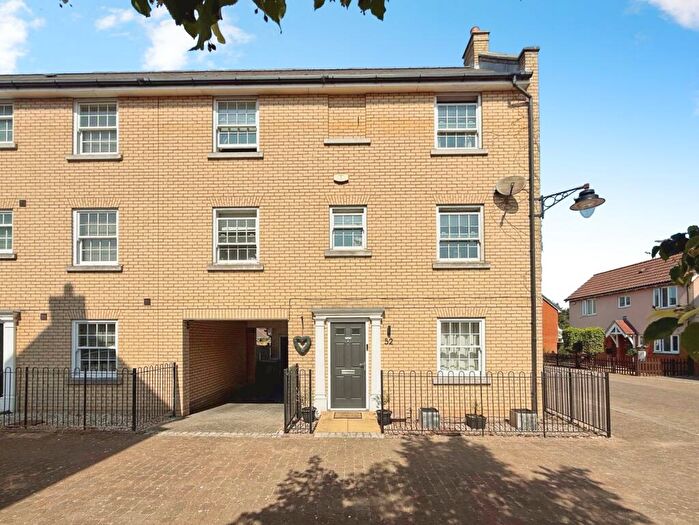
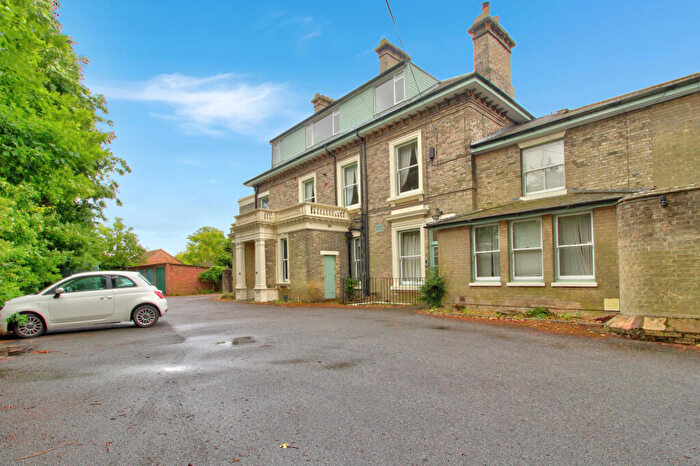
Properties for sale in Woodbridge
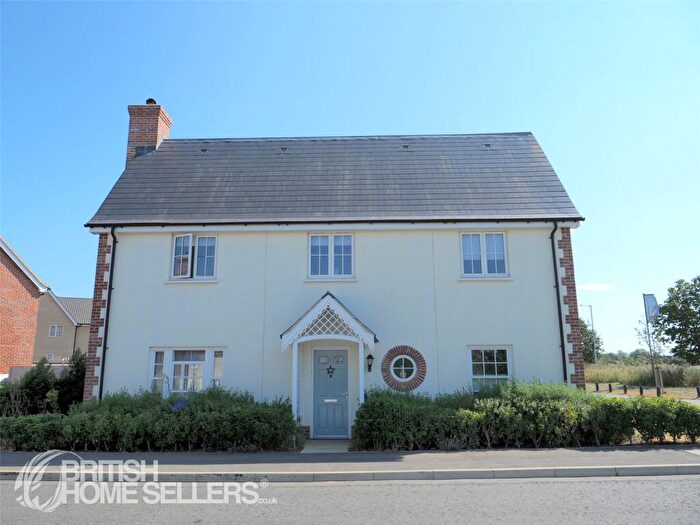
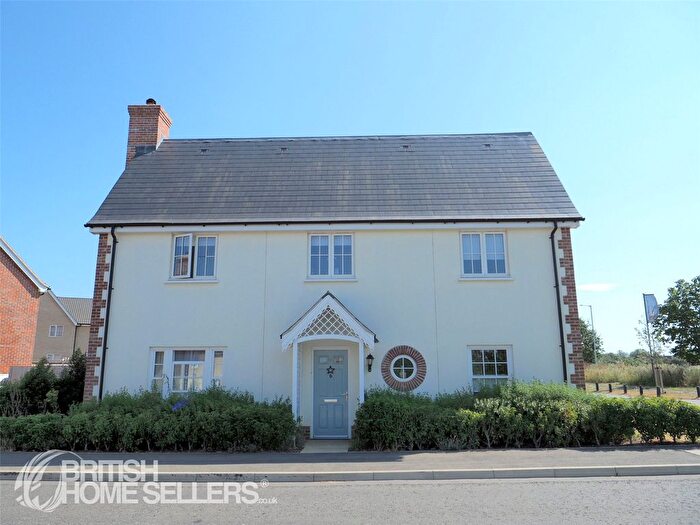
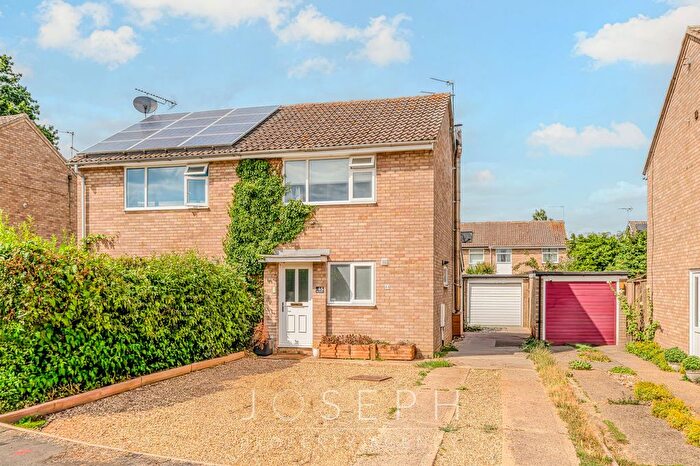

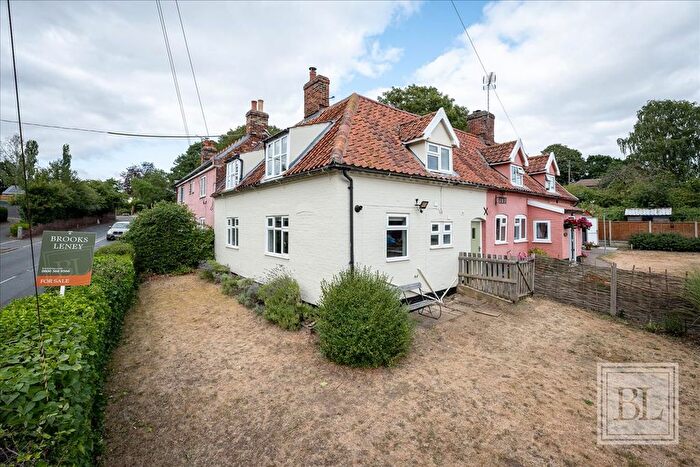
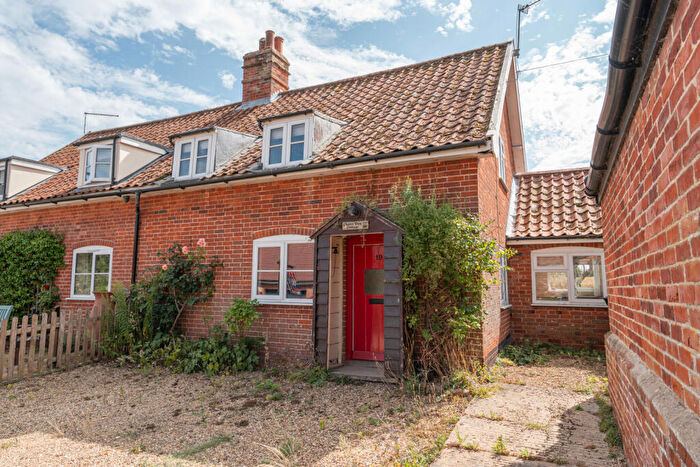
![]()
If you are looking to sell your house, let it out, or receive a property valuation, an expert can help you.
Click the button below to get started.


Neighbourhoods in Woodbridge
Navigate through our locations to find the location of your next house in Woodbridge, Suffolk for sale or to rent.
- Earl Soham
- Farlingaye
- Framlingham
- Grundisburgh
- Hacheston
- Helmingham And Coddenham
- Hollesley With Eyke
- Kyson
- Martlesham
- Melton And Ufford
- Nacton
- Orford And Tunstall
- Otley
- Rendlesham
- Riverside
- Seckford
- Stradbroke And Laxfield
- Sutton
- Wickham Market
- Witnesham
- Worlingworth
- Woodbridge
- Rendlesham & Orford
- Deben
- Orwell & Villages
- Martlesham & Purdis Farm
- Carlford & Fynn Valley
- Hoxne & Worlingworth
- Stradbroke & Laxfield
- Kelsale & Yoxford
- Melton
Property price trends in Woodbridge
According to the latest Land Registry data, the average home in Woodbridge sold for £371,833 in 2026. That figure comes from a substantial record of 24,640 sales logged over the past 31 years.
Prices have fallen back over the last three years. Compared with 2023, when the typical sale came in around £436,740, that's a fall of roughly 14.9%.
Looking back five years, average prices are down about 11.3% since 2021, a drop of around £47,294 in cash terms.
Zoom out to the past decade for the fuller picture. Back in 2016, homes here averaged £322,856, so the typical sold price has climbed about 15.2% since then, roughly 1.4% a year. Stretch the view to fifteen years and that annual pace edges up closer to 1.9%.
Frequently asked questions about Woodbridge
What is the average price for a property for sale in Woodbridge?
The average price for a property for sale in Woodbridge is £421,291. This amount is 32% higher than the average price in Suffolk. There are more than 10,000 property listings for sale in Woodbridge.
What locations have the most expensive properties for sale in Woodbridge?
The locations with the most expensive properties for sale in Woodbridge are Deben at an average of £569,186, Rendlesham & Orford at an average of £569,125 and Nacton at an average of £549,410.
What locations have the most affordable properties for sale in Woodbridge?
The locations with the most affordable properties for sale in Woodbridge are Rendlesham at an average of £290,236, Martlesham & Purdis Farm at an average of £309,107 and Wickham Market at an average of £334,820.
Which train stations are available in or near Woodbridge?
Some of the train stations available in or near Woodbridge are Wickham Market, Melton and Woodbridge.
Property Price Paid in Woodbridge by Year
The average sold property price by year was:
| Year | Average Sold Price | Price Change |
Sold Properties
|
|---|---|---|---|
| 2026 | £371,833 | -11% |
45 Properties |
| 2025 | £414,478 | -1% |
628 Properties |
| 2024 | £417,070 | -5% |
633 Properties |
| 2023 | £436,740 | 1% |
594 Properties |
| 2022 | £431,347 | 3% |
707 Properties |
| 2021 | £419,127 | 5% |
929 Properties |
| 2020 | £396,424 | 14% |
788 Properties |
| 2019 | £339,302 | -9% |
770 Properties |
| 2018 | £370,389 | 2% |
818 Properties |
| 2017 | £361,928 | 11% |
866 Properties |
Property Price per Property Type in Woodbridge
Here you can find historic sold price data in order to help with your property search.
The average Property Paid Price for specific property types in the last three years are:
| Property Type | Average Sold Price | Sold Properties |
|---|---|---|
| Semi Detached House | £331,881.00 | 523 Semi Detached Houses |
| Terraced House | £307,465.00 | 397 Terraced Houses |
| Detached House | £579,811.00 | 818 Detached Houses |
| Flat | £188,462.00 | 162 Flats |
Transport in Woodbridge
Please see below transportation links in this area:
