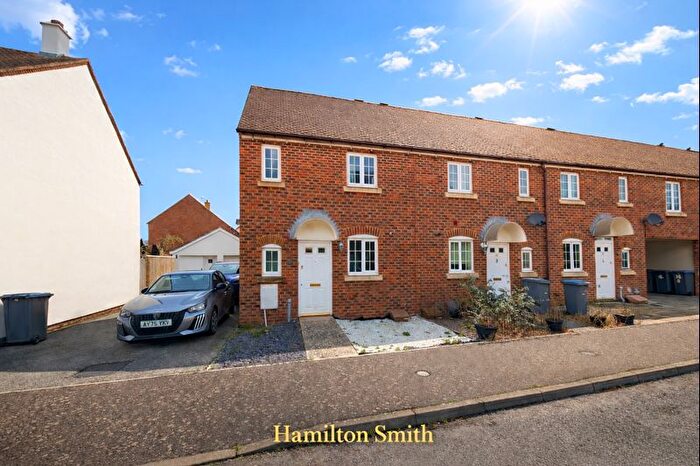
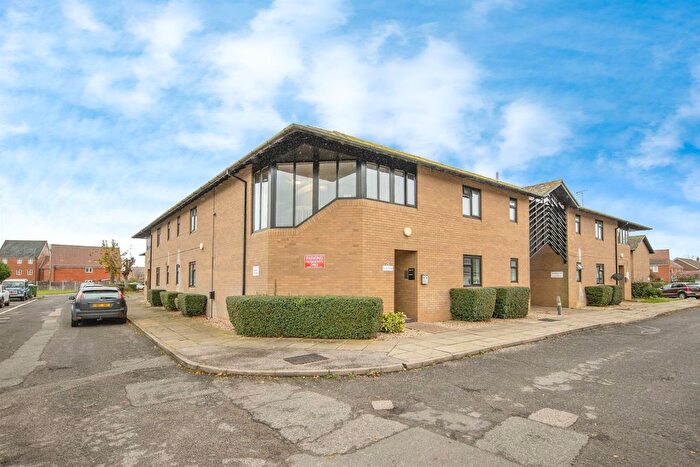
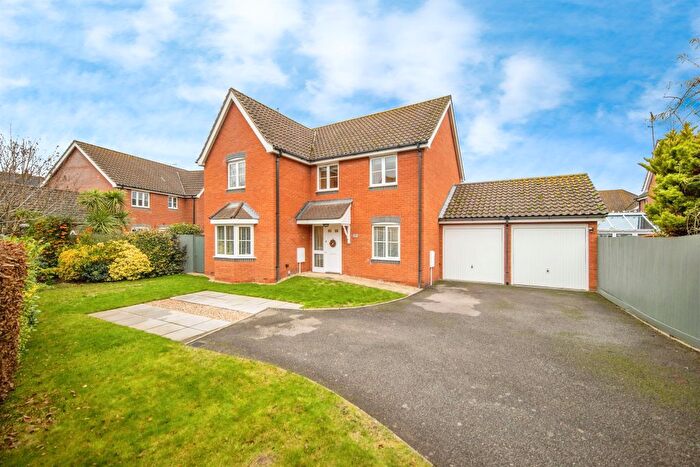
Houses for sale & to rent in Rendlesham, Woodbridge
House Prices in Rendlesham
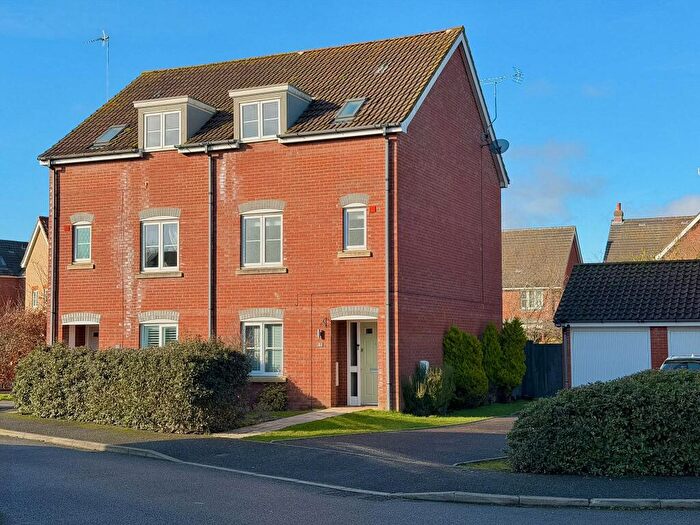
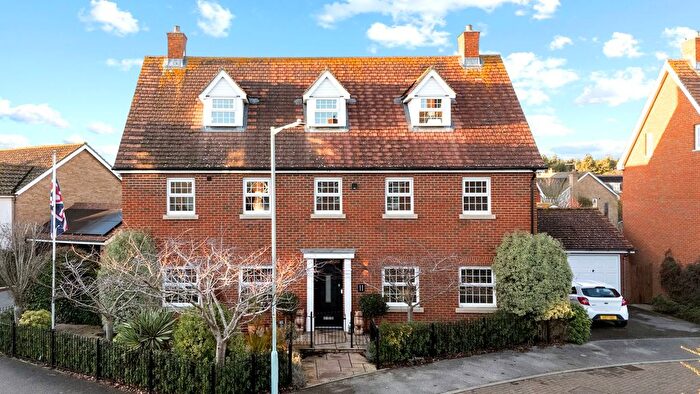
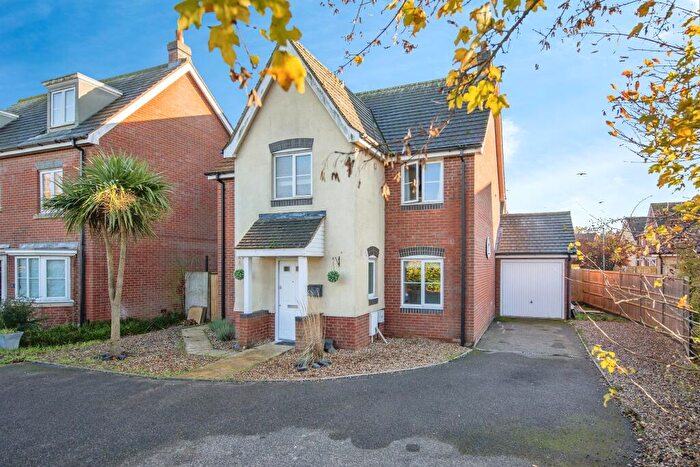
Properties in Rendlesham have an average house price of £289,235.00 and had 138 Property Transactions within the last 3 years¹.
Rendlesham is an area in Woodbridge, Suffolk with 1,249 households², where the most expensive property was sold for £1,292,250.00.
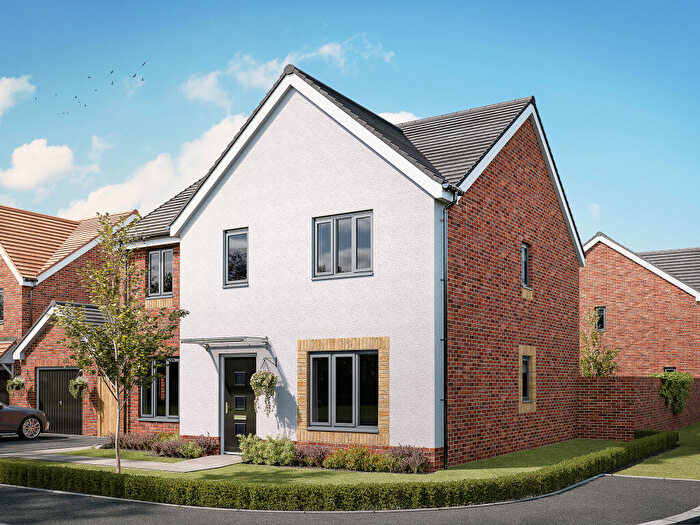
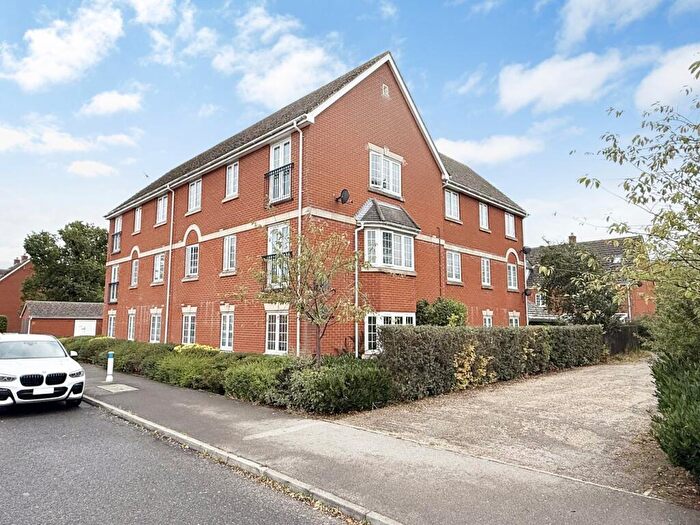
Properties for sale in Rendlesham
Previously listed properties in Rendlesham
Roads and Postcodes in Rendlesham
Navigate through our locations to find the location of your next house in Rendlesham, Woodbridge for sale or to rent.
| Streets | Postcodes |
|---|---|
| Abbey Close | IP12 2UD |
| Abbey Gardens | IP13 0TE |
| Acer Road | IP12 2GA |
| Ashe Road | IP12 2RF |
| Ashe Row | IP13 0PS |
| Ashton Close | IP12 2GS |
| Aspen Court | IP12 2GY |
| Avocet Mews | IP12 2UA |
| Beck Close | IP12 2UE |
| Cedar Road | IP12 2UN |
| Chestnut Close | IP12 2UW |
| Council Houses | IP13 0PW |
| Crooked Creek Road | IP12 2GL |
| Elm Close | IP12 2UP |
| Eyke Road | IP13 0PY |
| Forest Court | IP12 2GQ |
| Forest Gardens | IP12 2TX |
| Fountain Road | IP12 2UF |
| Friday Street | IP12 2RW |
| Garden Square | IP12 2GW |
| Gardenia Close | IP12 2GX |
| Harvey Way | IP12 2GU |
| Hazel Close | IP12 2UR |
| Hembling Terrace | IP13 0PP |
| Hercules Road | IP12 2GP |
| Hollesley Road | IP12 2RN |
| Ivy Lodge Road | IP13 0QB |
| Jays Croft Road | IP12 2TQ |
| Knight Road | IP12 2GR |
| Library Mews | IP12 2BF |
| Loudham Road | IP13 0PH |
| Magnolia Drive | IP12 2GB |
| Maple Close | IP12 2GH |
| Marlesford Road | IP13 0QF IP13 0QG |
| Mayhew Road | IP12 2GT IP12 2GZ |
| Mill Lane | IP13 0PL |
| Mission Cottages | IP13 0PF |
| Park Close | IP12 2UG |
| Pine Close | IP12 2GD |
| Railway Terrace | IP13 0PR |
| Redwald Road | IP12 2TA IP12 2TB IP12 2TE IP12 2TF |
| Sapling Close | IP12 2GN |
| Sparrows Croft Road | IP12 2TG |
| Spencer Road | IP12 2TJ |
| Spring Close | IP12 2UQ |
| St Gregorys Close | IP12 2TH |
| Station Road | IP13 0PT |
| Suffolk Drive | IP12 2TN IP12 2TP |
| Sycamore Drive | IP12 2GF |
| Talbot Walk | IP13 0QP |
| The Pit | IP13 0QQ |
| Thellusson Road | IP12 2TD |
| Tidy Road | IP12 2FD |
| Tower Field Road | IP12 2UL |
| Wacker Field Road | IP12 2UT |
| Walnut Tree Avenue | IP12 2GG |
| Welburn Close | IP12 2UH |
| Willow Way | IP12 2GE |
| Wood Close | IP12 2UJ |
| IP12 2RJ IP13 0QJ |
Transport near Rendlesham
- FAQ
- Price Paid By Year
- Property Type Price
Frequently asked questions about Rendlesham
What is the average price for a property for sale in Rendlesham?
The average price for a property for sale in Rendlesham is £289,235. This amount is 32% lower than the average price in Woodbridge. There are 332 property listings for sale in Rendlesham.
What streets have the most expensive properties for sale in Rendlesham?
The streets with the most expensive properties for sale in Rendlesham are Ivy Lodge Road at an average of £1,100,000, Friday Street at an average of £685,000 and Ashton Close at an average of £615,000.
What streets have the most affordable properties for sale in Rendlesham?
The streets with the most affordable properties for sale in Rendlesham are Avocet Mews at an average of £108,571, Gardenia Close at an average of £137,500 and Aspen Court at an average of £145,750.
Which train stations are available in or near Rendlesham?
Some of the train stations available in or near Rendlesham are Wickham Market, Melton and Woodbridge.
Property Price Paid in Rendlesham by Year
The average sold property price by year was:
| Year | Average Sold Price | Price Change |
Sold Properties
|
|---|---|---|---|
| 2025 | £304,186 | 5% |
43 Properties |
| 2024 | £288,555 | 5% |
54 Properties |
| 2023 | £274,451 | -9% |
41 Properties |
| 2022 | £300,025 | 2% |
48 Properties |
| 2021 | £294,822 | 13% |
62 Properties |
| 2020 | £255,118 | 6% |
40 Properties |
| 2019 | £240,979 | -2% |
72 Properties |
| 2018 | £246,677 | -2% |
64 Properties |
| 2017 | £250,397 | 14% |
97 Properties |
| 2016 | £216,228 | 7% |
83 Properties |
| 2015 | £201,703 | 1% |
87 Properties |
| 2014 | £200,065 | 7% |
72 Properties |
| 2013 | £186,521 | -2% |
62 Properties |
| 2012 | £191,149 | -4% |
86 Properties |
| 2011 | £198,849 | -4% |
68 Properties |
| 2010 | £205,952 | 16% |
86 Properties |
| 2009 | £172,364 | 3% |
71 Properties |
| 2008 | £166,637 | -11% |
73 Properties |
| 2007 | £184,853 | 4% |
141 Properties |
| 2006 | £178,364 | 3% |
181 Properties |
| 2005 | £172,213 | 12% |
161 Properties |
| 2004 | £152,399 | 20% |
153 Properties |
| 2003 | £122,283 | 21% |
161 Properties |
| 2002 | £96,028 | 25% |
123 Properties |
| 2001 | £71,988 | 34% |
118 Properties |
| 2000 | £47,719 | -14% |
47 Properties |
| 1999 | £54,432 | 32% |
88 Properties |
| 1998 | £36,756 | -21% |
38 Properties |
| 1997 | £44,596 | -1% |
33 Properties |
| 1996 | £45,180 | 23% |
26 Properties |
| 1995 | £34,695 | - |
24 Properties |
Property Price per Property Type in Rendlesham
Here you can find historic sold price data in order to help with your property search.
The average Property Paid Price for specific property types in the last three years are:
| Property Type | Average Sold Price | Sold Properties |
|---|---|---|
| Semi Detached House | £272,255.00 | 46 Semi Detached Houses |
| Detached House | £445,282.00 | 38 Detached Houses |
| Terraced House | £250,574.00 | 27 Terraced Houses |
| Flat | £137,203.00 | 27 Flats |

