
Houses for sale in Kyson, Woodbridge
House Prices in Kyson
Properties in Kyson have an average house price of £407k and had 72 Property Transactions within the last 3 years¹.
Kyson is an area in Woodbridge, Suffolk with 782 households², where the most expensive property was sold for £1.7M.
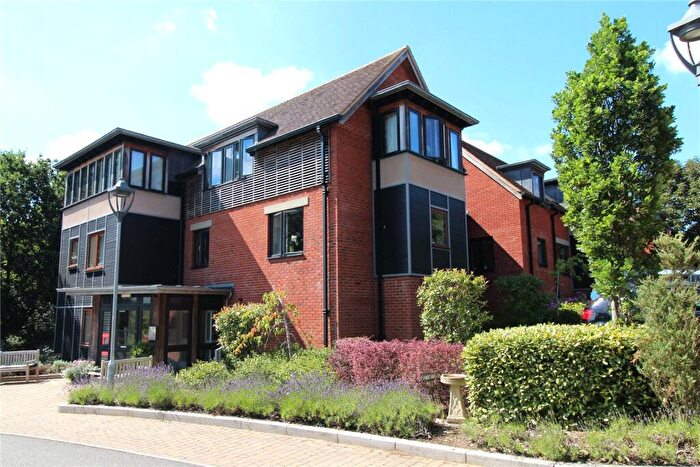
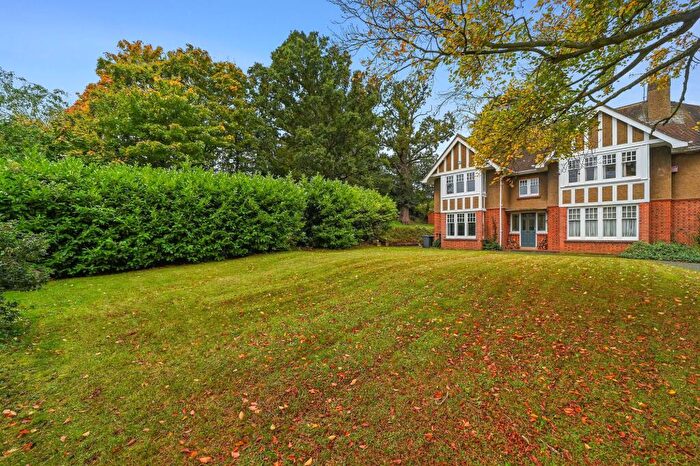
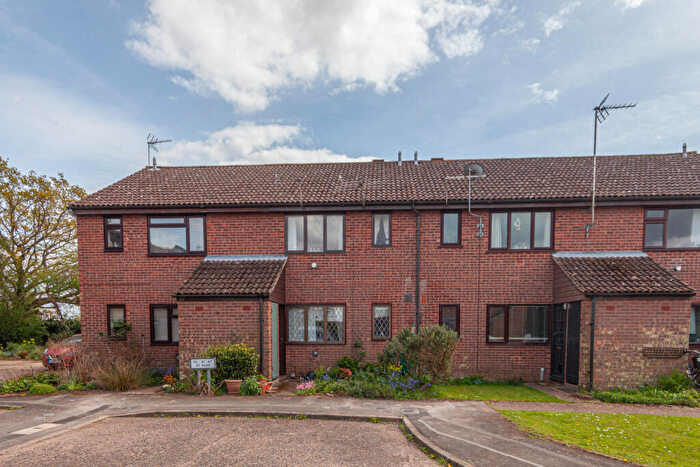
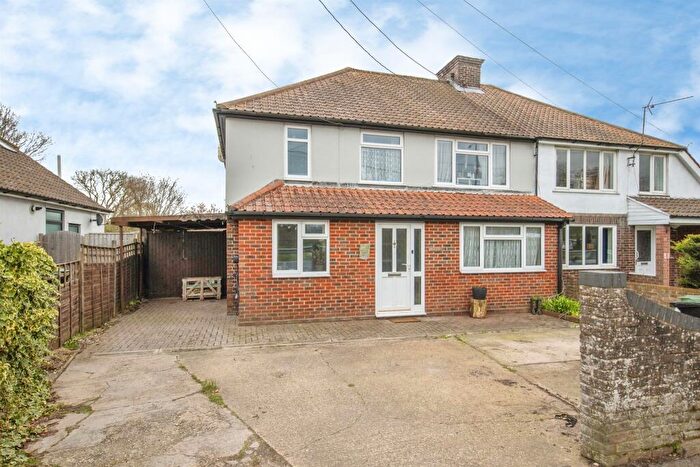
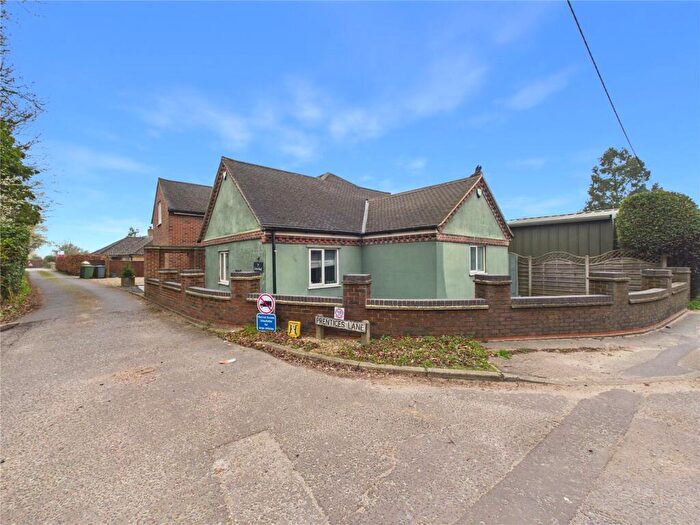
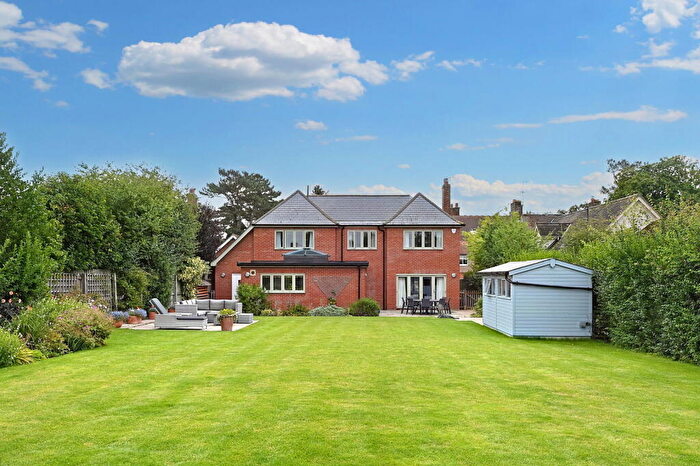
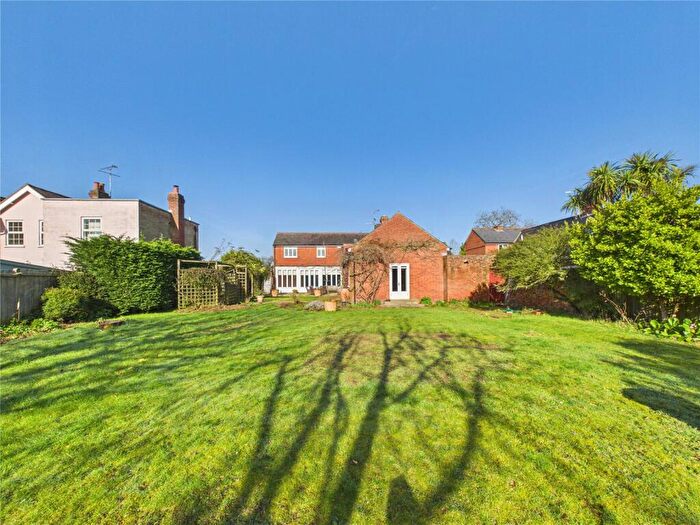
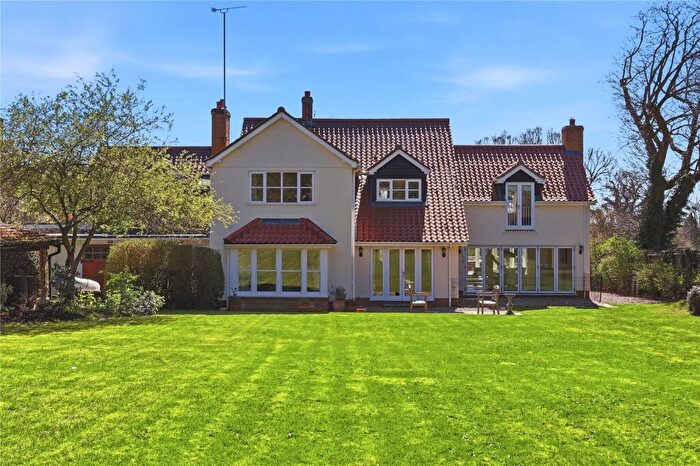
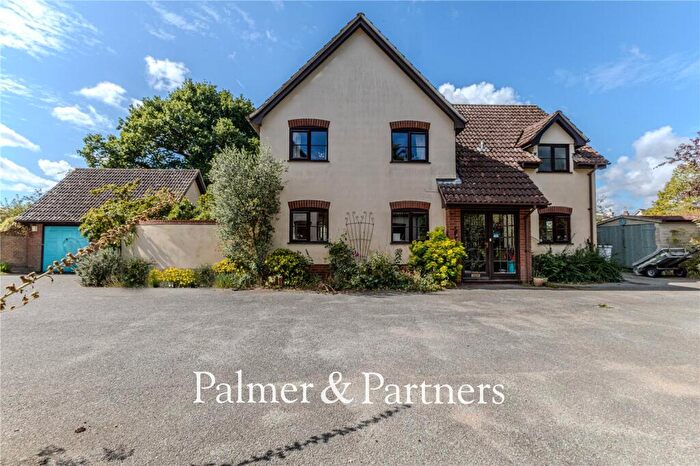
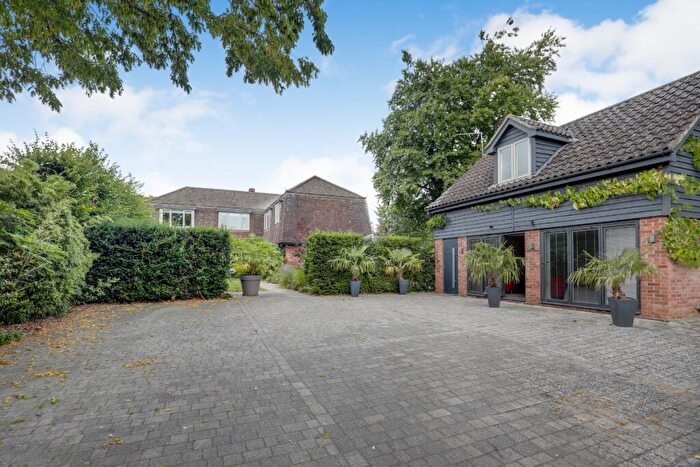
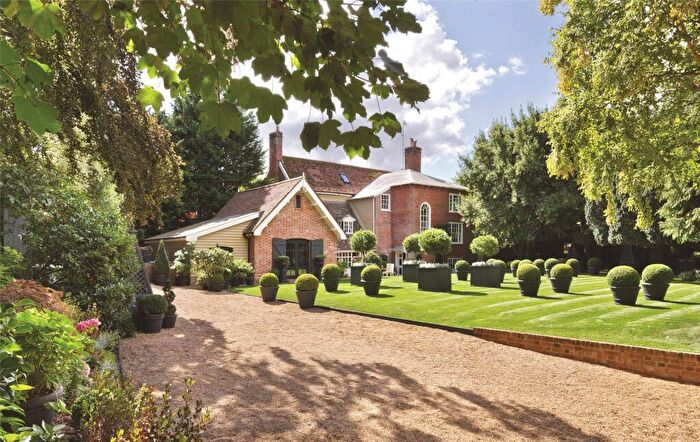
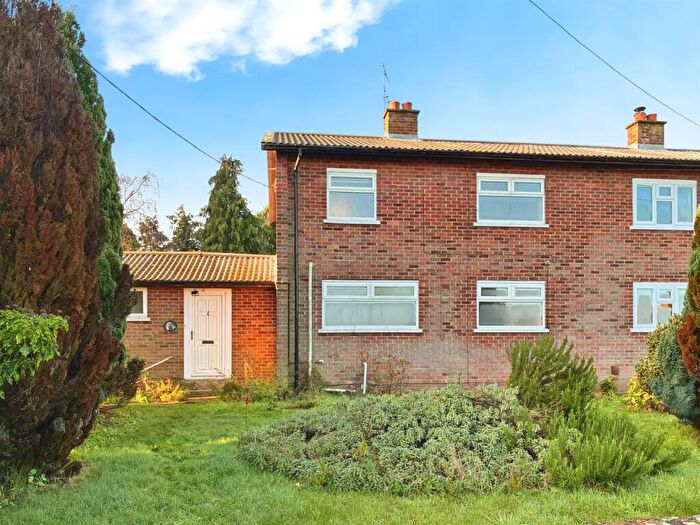
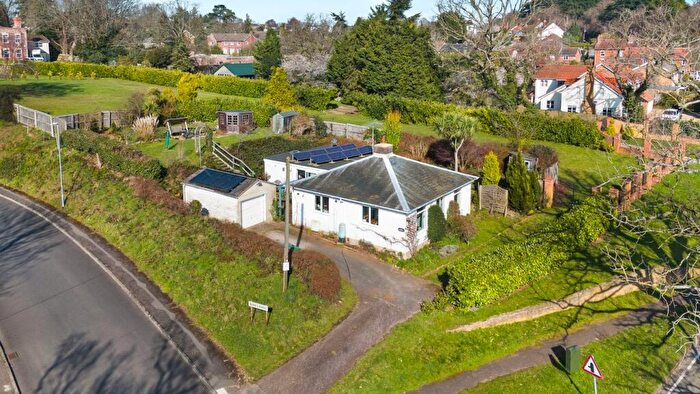
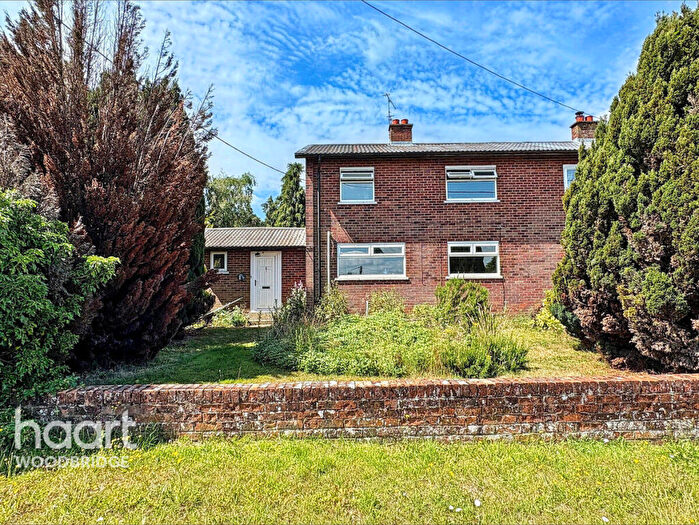
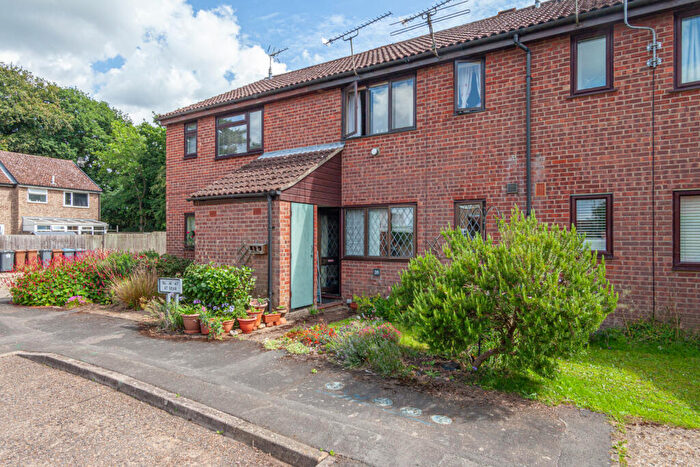
Properties for sale in Kyson
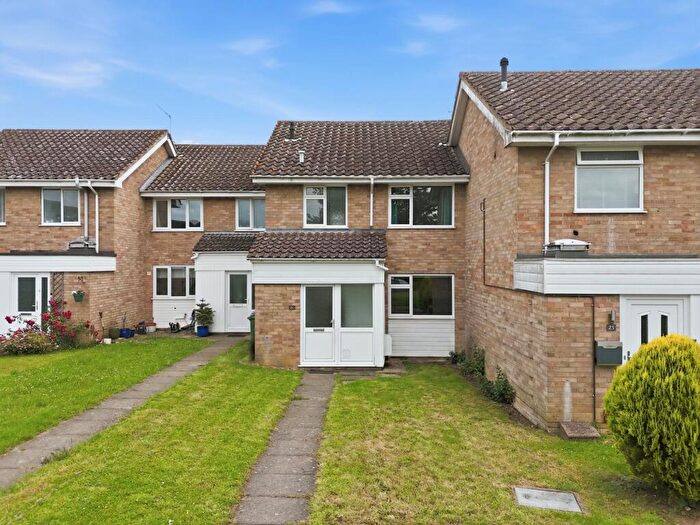
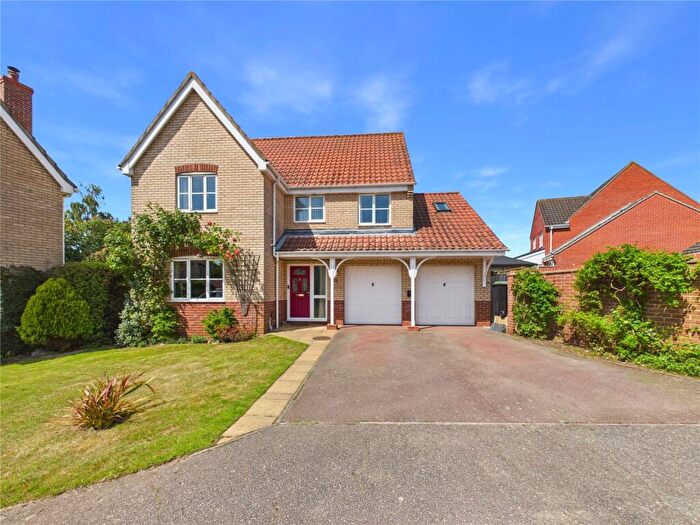
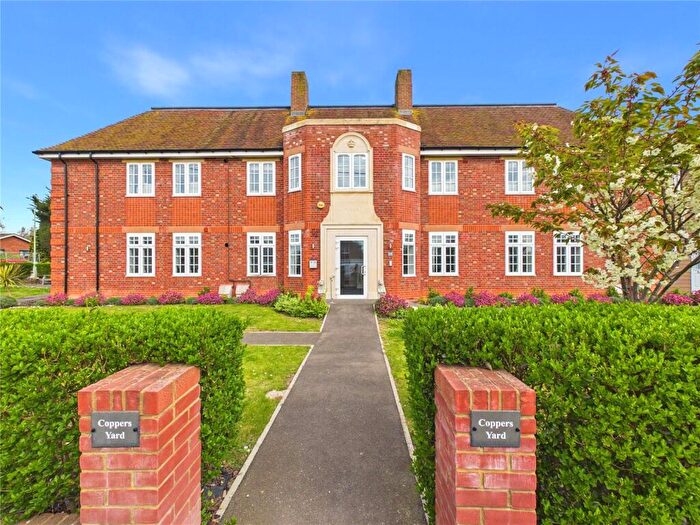
![]()
If you are looking to sell your house, let it out, or receive a property valuation, an expert can help you.
Click the button below to get started.
Roads and Postcodes in Kyson
Navigate through our locations to find the location of your next house in Kyson, Woodbridge for sale or to rent.
| Streets | Postcodes |
|---|---|
| Balliol Close | IP12 4EQ |
| Bilney Road | IP12 4HF |
| Bullards Lane | IP12 4HD IP12 4HE |
| Burkitt Road | IP12 4JJ |
| Christchurch Drive | IP12 4TJ |
| Churchill Close | IP12 4UU |
| Clare Avenue | IP12 4ES |
| Colletts Walk | IP12 4HS |
| Conach Road | IP12 4HN |
| Drybridge Hill | IP12 4HB |
| Greyfriars | IP12 4EY |
| Grove Road | IP12 4LG IP12 4LJ IP12 4LQ |
| Grundisburgh Road | IP12 4HG IP12 4HH IP12 4HJ IP13 6HX |
| Kings Close | IP12 4EU |
| Lady Margaret Gardens | IP12 4EZ |
| Magdalen Drive | IP12 4EF |
| Manor Road | IP13 6HY |
| Mill View Close | IP12 4HR |
| Moors Way | IP12 4HQ |
| Naunton Road | IP12 4HP |
| Newnham Avenue | IP12 4EN IP12 4EP |
| Old Barrack Road | IP12 4EL IP12 4ER IP12 4ET IP12 4EX |
| Oxford Drive | IP12 4EE IP12 4EG IP12 4EH |
| Pembroke Avenue | IP12 4JB |
| Peterhouse Crescent | IP12 4HT IP12 4HU IP12 4HX IP12 4HY IP12 4HZ |
| Prentices Lane | IP12 4LF |
| Russell Close | IP12 4LE |
| Seckford Street | IP12 4LZ |
| St Annes Close | IP12 4TL |
| St Peters Close | IP12 4EJ |
| Trinity Close | IP12 4TN |
| Wilmslow Avenue | IP12 4HW |
Property price trends in Kyson
According to the latest Land Registry data, the average home in Kyson sold for £332,097 in 2025. That figure comes from 831 sales logged over the past 30 years.
Prices have fallen back over the last three years. Compared with 2022, when the typical sale came in around £363,156, that's a fall of roughly 8.6%.
Looking back five years, average prices are up about 14.9% since 2020, a gain of around £42,991 in cash terms.
Zoom out to the past decade for the fuller picture. Back in 2015, homes here averaged £301,966, so the typical sold price has climbed about 10% since then, roughly 1% a year. Stretch the view to fifteen years and that annual pace edges up closer to 2.8%.
Frequently asked questions about Kyson
What is the average price for a property for sale in Kyson?
The average price for a property for sale in Kyson is £407,000. This amount is 3% lower than the average price in Woodbridge. There are 288 property listings for sale in Kyson.
What streets have the most expensive properties for sale in Kyson?
The streets with the most expensive properties for sale in Kyson are Grundisburgh Road at an average of £651,700, Seckford Street at an average of £640,000 and Old Barrack Road at an average of £543,000.
What streets have the most affordable properties for sale in Kyson?
The streets with the most affordable properties for sale in Kyson are Manor Road at an average of £150,000, Newnham Avenue at an average of £221,000 and Christchurch Drive at an average of £237,500.
Which train stations are available in or near Kyson?
Some of the train stations available in or near Kyson are Woodbridge, Melton and Westerfield.
Property Price Paid in Kyson by Year
The average sold property price by year was:
| Year | Average Sold Price | Price Change |
Sold Properties
|
|---|---|---|---|
| 2025 | £332,097 | -29% |
23 Properties |
| 2024 | £429,717 | -5% |
23 Properties |
| 2023 | £453,163 | 20% |
26 Properties |
| 2022 | £363,156 | -5% |
21 Properties |
| 2021 | £381,140 | 24% |
32 Properties |
| 2020 | £289,106 | -17% |
33 Properties |
| 2019 | £337,118 | -2% |
19 Properties |
| 2018 | £343,065 | 15% |
23 Properties |
| 2017 | £290,574 | -10% |
27 Properties |
| 2016 | £320,171 | 6% |
26 Properties |
Property Price per Property Type in Kyson
Here you can find historic sold price data in order to help with your property search.
The average Property Paid Price for specific property types in the last three years are:
| Property Type | Average Sold Price | Sold Properties |
|---|---|---|
| Semi Detached House | £358,422.00 | 29 Semi Detached Houses |
| Detached House | £545,804.00 | 23 Detached Houses |
| Terraced House | £317,812.00 | 20 Terraced Houses |
