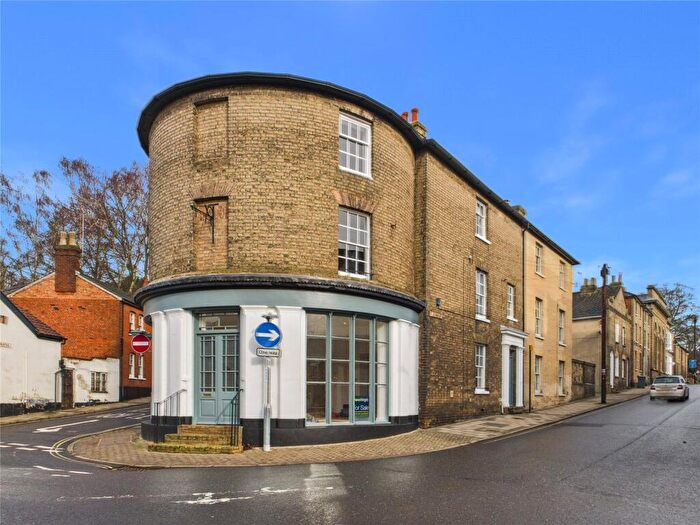
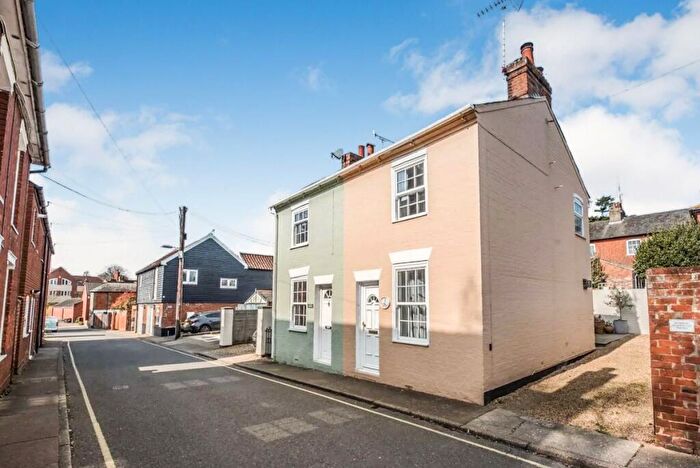
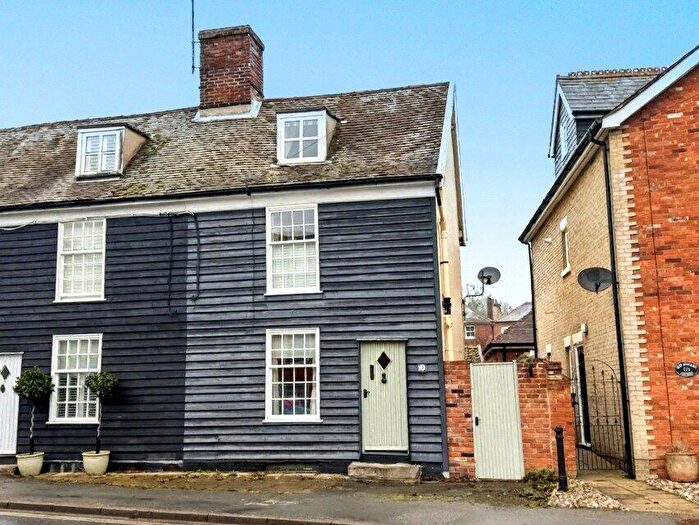
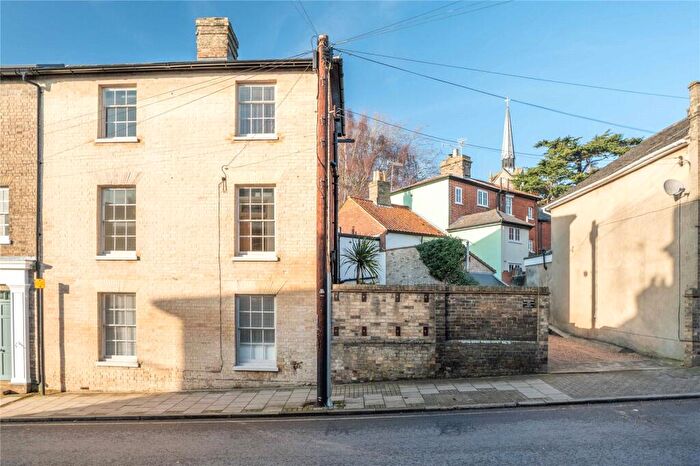
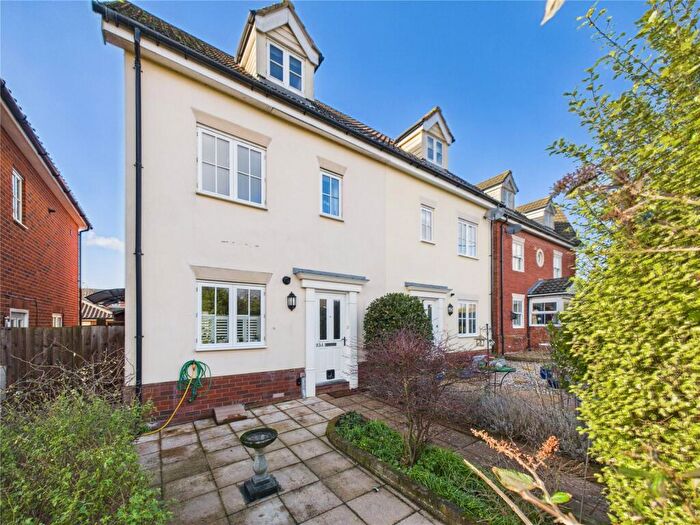
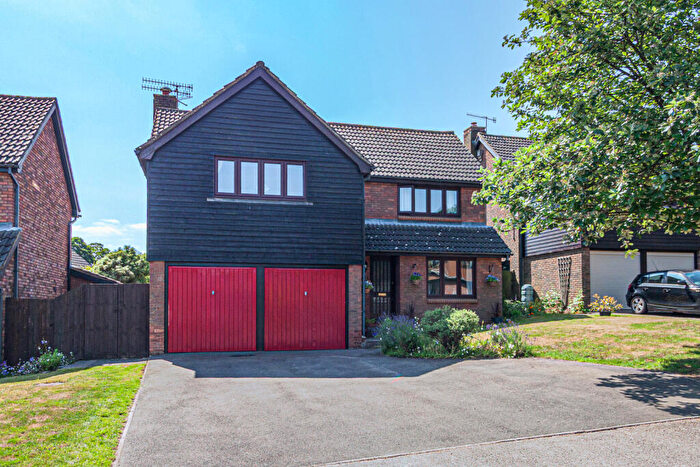
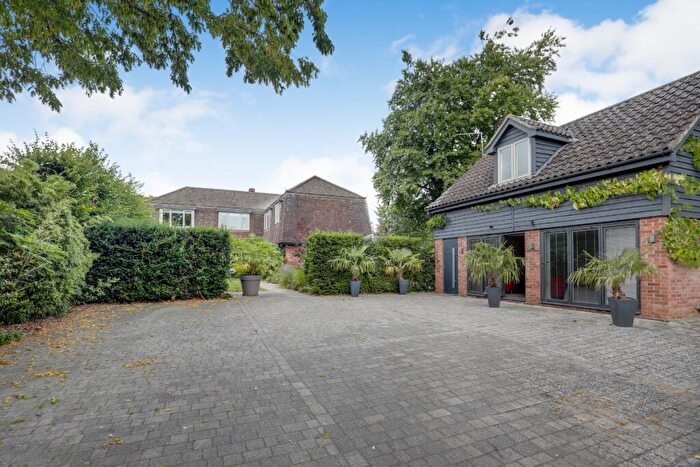
Houses for sale & to rent in Seckford, Woodbridge
House Prices in Seckford
Properties in Seckford have an average house price of £403,341.00 and had 149 Property Transactions within the last 3 years¹.
Seckford is an area in Woodbridge, Suffolk with 1,054 households², where the most expensive property was sold for £1,992,500.00.
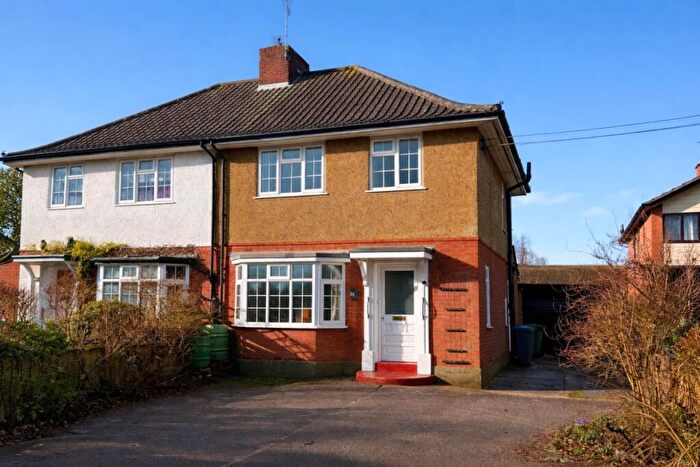
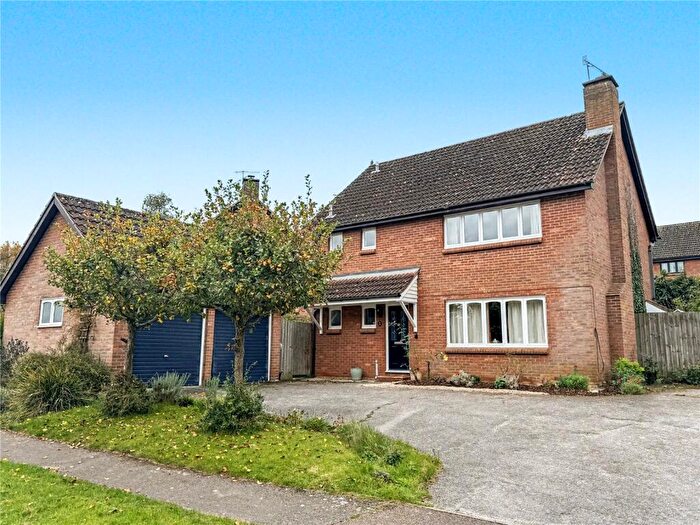
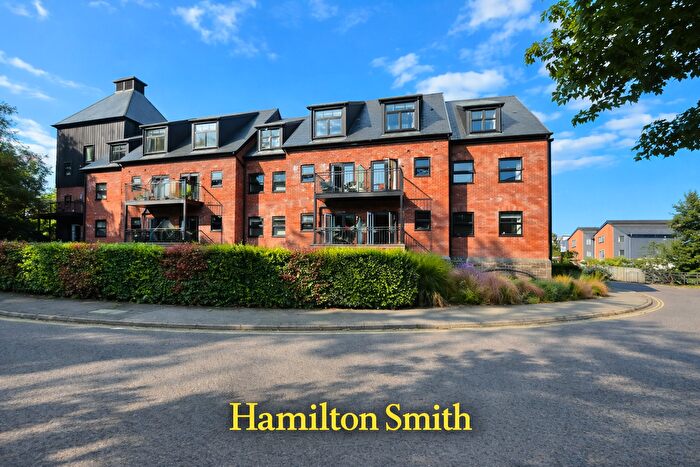
Properties for sale in Seckford
Roads and Postcodes in Seckford
Navigate through our locations to find the location of your next house in Seckford, Woodbridge for sale or to rent.
| Streets | Postcodes |
|---|---|
| Angel Lane | IP12 4NG |
| Beaconsfield Road | IP12 1EQ |
| Bredfield Street | IP12 4NH |
| Brook Street | IP12 1BE |
| Carlow Mews | IP12 1EA |
| Carmelite Place | IP12 1DR |
| Castle Street | IP12 1HL IP12 1HN |
| Chapel Street | IP12 4NF |
| Church Street | IP12 1DF IP12 1DH IP12 1DS |
| Crown Place | IP12 1BS IP12 1BU |
| Deben Road | IP12 1AZ |
| Doric Place | IP12 1BT |
| Elmhurst Court | IP12 1HB |
| Fitzgerald Road | IP12 1EN |
| Gladstone Road | IP12 1EF |
| Gobbitts Yard | IP12 1DD |
| Hamblin Road | IP12 1BG |
| Hill View Terrace | IP12 1HR |
| Jacobs Way | IP12 1DQ |
| Kings Way | IP12 1BA |
| Lanyard Place | IP12 1FE |
| Lime Kiln Quay | IP12 1BD |
| Lime Kiln Quay Road | IP12 1BB |
| Little St Johns Street | IP12 1EE IP12 1FJ |
| Lockwood Close | IP12 1HZ |
| Market Hill | IP12 4LP IP12 4LU IP12 4LX |
| Mill Lane | IP12 1HW |
| Naverne Meadows | IP12 1HU |
| New Street | IP12 1DT IP12 1DU IP12 1DX IP12 1DY IP12 1DZ |
| North Hill | IP12 1HH |
| Pytches Road | IP12 1EP IP12 1ES IP12 1ET |
| Quay Street | IP12 1BX |
| Quayside | IP12 1BN |
| Quayside Place | IP12 1FA |
| Queens Head Lane | IP12 4ND |
| Seckford Street | IP12 4LY |
| St Johns Hill | IP12 1HS IP12 1HT |
| St Johns Street | IP12 1EB IP12 1ED |
| St Johns Terrace | IP12 1HP |
| Stone Place | IP12 1DW |
| Suffolk Place | IP12 1XB |
| Sun Lane | IP12 1EG |
| Sutton Close | IP12 1XA |
| The Thoroughfare | IP12 1AQ |
| Theatre Street | IP12 4NE |
| Thoroughfare | IP12 1AA IP12 1AG IP12 1AL IP12 1AR IP12 1AS IP12 1AT IP12 1AW IP12 1FB |
| Tide Mill Way | IP12 1BY |
| Turn Lane | IP12 4AR |
| Valley Close | IP12 1NQ |
| Victoria Road | IP12 1EJ IP12 1EL |
| Waggoners Court | IP12 4UP |
| Wilderness Lane | IP12 1EH |
| IP12 1AH |
Transport near Seckford
-
Woodbridge Station
-
Melton Station
-
Wickham Market Station
-
Derby Road Station
-
Westerfield Station
-
Ipswich Station
-
Trimley Station
-
Felixstowe Station
- FAQ
- Price Paid By Year
- Property Type Price
Frequently asked questions about Seckford
What is the average price for a property for sale in Seckford?
The average price for a property for sale in Seckford is £403,341. This amount is 5% lower than the average price in Woodbridge. There are 648 property listings for sale in Seckford.
What streets have the most expensive properties for sale in Seckford?
The streets with the most expensive properties for sale in Seckford are Market Hill at an average of £1,992,500, North Hill at an average of £850,000 and Chapel Street at an average of £830,000.
What streets have the most affordable properties for sale in Seckford?
The streets with the most affordable properties for sale in Seckford are Suffolk Place at an average of £136,968, Elmhurst Court at an average of £159,214 and Mill Lane at an average of £187,000.
Which train stations are available in or near Seckford?
Some of the train stations available in or near Seckford are Woodbridge, Melton and Wickham Market.
Property Price Paid in Seckford by Year
The average sold property price by year was:
| Year | Average Sold Price | Price Change |
Sold Properties
|
|---|---|---|---|
| 2025 | £402,776 | 1% |
47 Properties |
| 2024 | £398,263 | -3% |
55 Properties |
| 2023 | £409,850 | 2% |
47 Properties |
| 2022 | £402,022 | -9% |
66 Properties |
| 2021 | £438,863 | 21% |
77 Properties |
| 2020 | £345,292 | -8% |
52 Properties |
| 2019 | £372,999 | -3% |
51 Properties |
| 2018 | £385,400 | 0,2% |
60 Properties |
| 2017 | £384,719 | 9% |
62 Properties |
| 2016 | £349,948 | 16% |
55 Properties |
| 2015 | £294,713 | -9% |
72 Properties |
| 2014 | £322,578 | 9% |
84 Properties |
| 2013 | £293,662 | -8% |
60 Properties |
| 2012 | £316,079 | 1% |
62 Properties |
| 2011 | £311,532 | 4% |
66 Properties |
| 2010 | £298,964 | 17% |
56 Properties |
| 2009 | £249,230 | -15% |
65 Properties |
| 2008 | £286,585 | 8% |
65 Properties |
| 2007 | £262,611 | 11% |
100 Properties |
| 2006 | £234,279 | -12% |
81 Properties |
| 2005 | £263,317 | 10% |
67 Properties |
| 2004 | £238,030 | 18% |
68 Properties |
| 2003 | £195,067 | 18% |
74 Properties |
| 2002 | £159,117 | -6% |
76 Properties |
| 2001 | £169,313 | 36% |
65 Properties |
| 2000 | £107,662 | -1% |
68 Properties |
| 1999 | £108,736 | 23% |
87 Properties |
| 1998 | £83,933 | 2% |
63 Properties |
| 1997 | £82,025 | 12% |
83 Properties |
| 1996 | £71,995 | -8% |
78 Properties |
| 1995 | £77,754 | - |
57 Properties |
Property Price per Property Type in Seckford
Here you can find historic sold price data in order to help with your property search.
The average Property Paid Price for specific property types in the last three years are:
| Property Type | Average Sold Price | Sold Properties |
|---|---|---|
| Semi Detached House | £454,333.00 | 27 Semi Detached Houses |
| Detached House | £726,857.00 | 14 Detached Houses |
| Terraced House | £433,199.00 | 70 Terraced Houses |
| Flat | £192,921.00 | 38 Flats |

