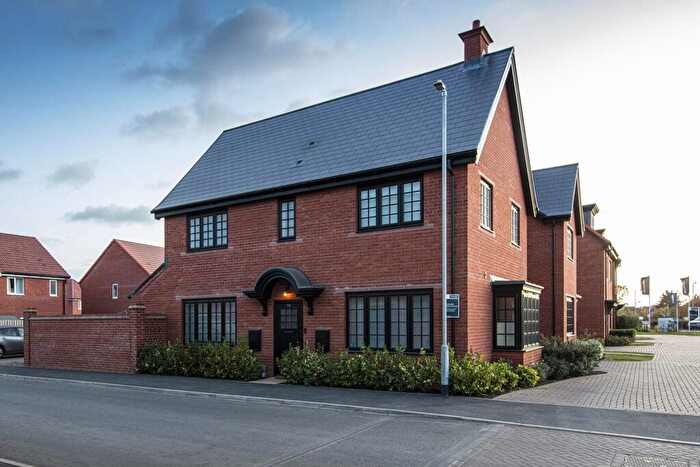
Houses for sale & to rent in Sutton, Woodbridge
House Prices in Sutton
Properties in Sutton have an average house price of £381,124.00 and had 72 Property Transactions within the last 3 years¹.
Sutton is an area in Woodbridge, Suffolk with 773 households², where the most expensive property was sold for £1,250,000.00.
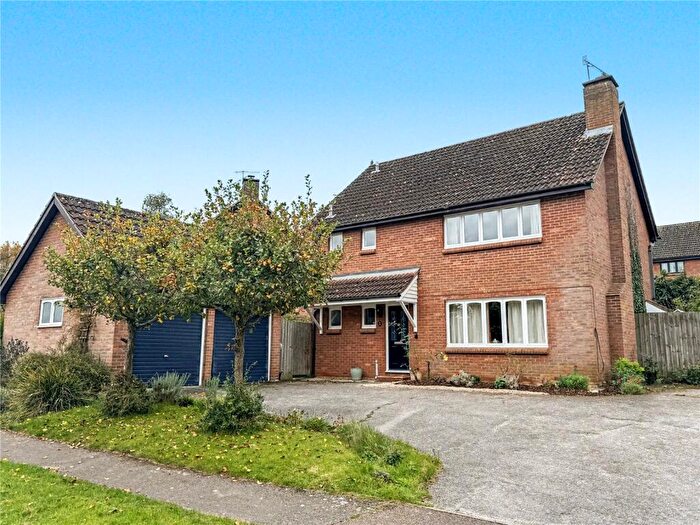
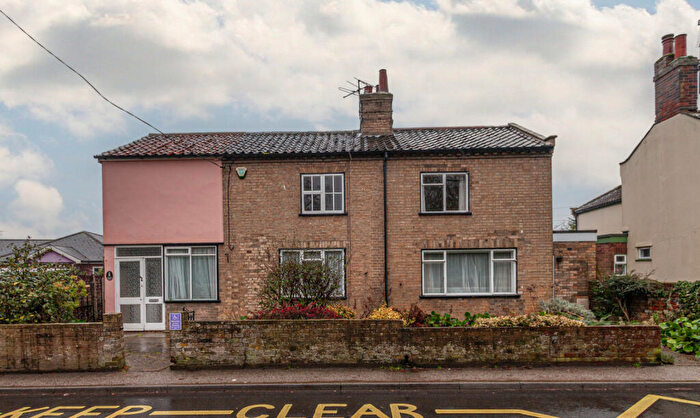
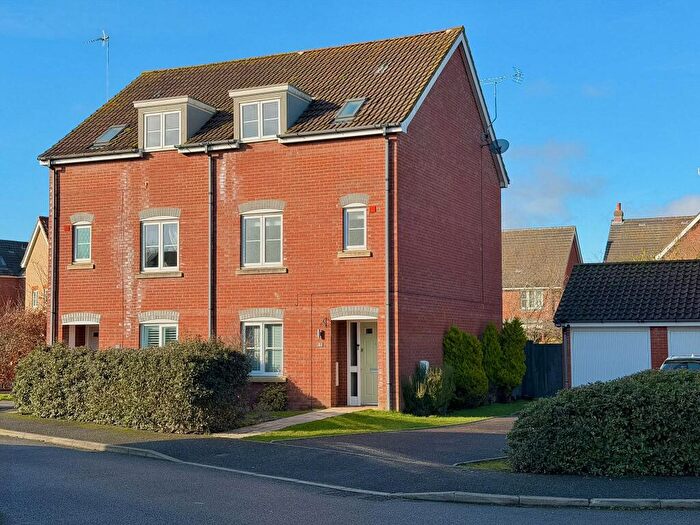
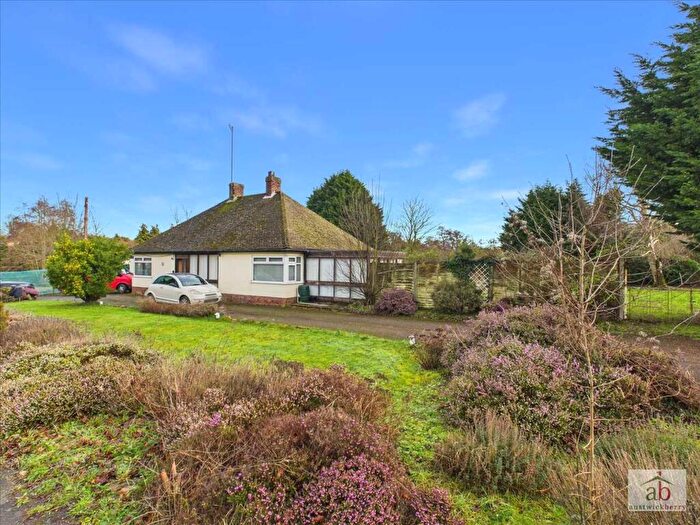
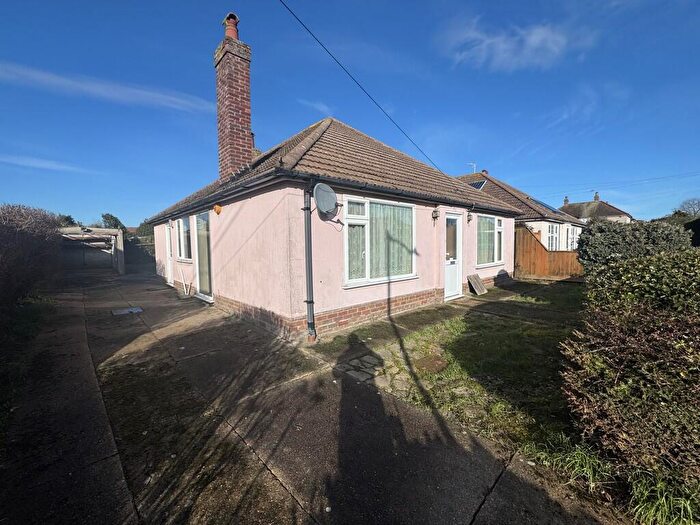
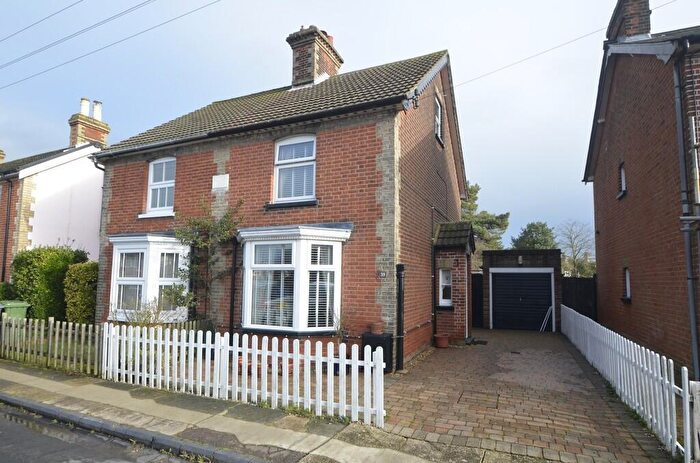
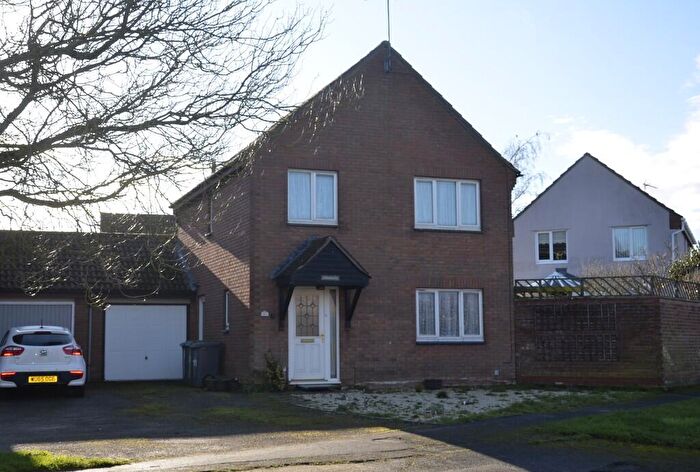
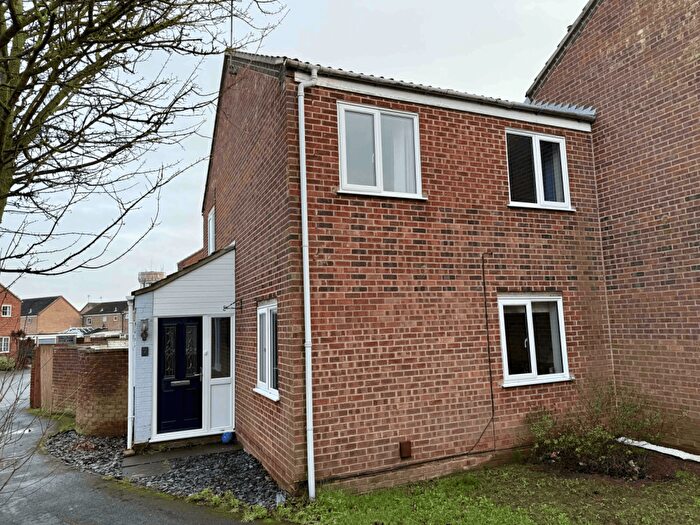
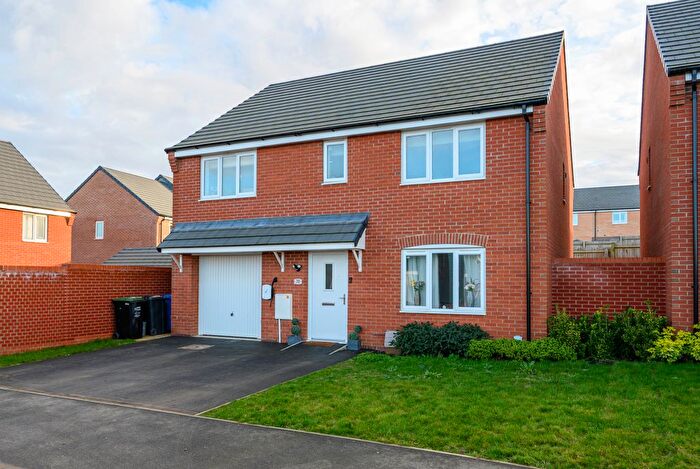
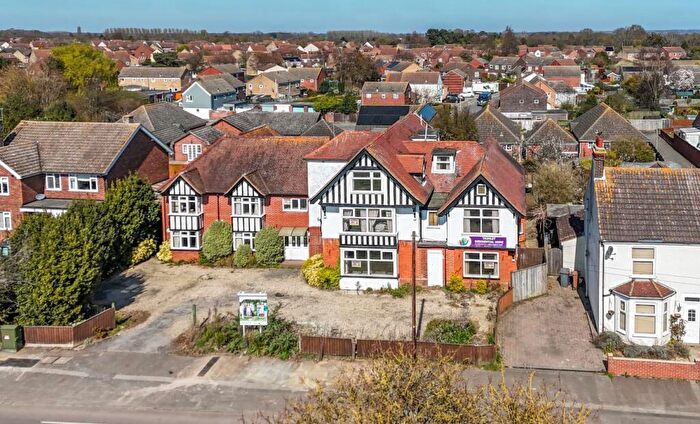
Properties for sale in Sutton
Roads and Postcodes in Sutton
Navigate through our locations to find the location of your next house in Sutton, Woodbridge for sale or to rent.
| Streets | Postcodes |
|---|---|
| Alderton Road | IP12 3EP IP12 3ER |
| Barracks Row | IP12 3EZ |
| Beach Lane | IP12 3BU |
| Cavell Close | IP12 3DD |
| Chequer Field | IP12 3TT |
| Church Lane | IP12 2PJ IP12 3HG IP12 3HJ |
| Coastguard Cottages | IP12 3BG |
| Common Lane | IP12 2PQ |
| East Lane | IP12 3AP |
| Easton Road | IP12 3TD |
| Eyke Road | IP12 2PN IP12 2PW |
| Farm Cottage | IP12 3BA |
| Ferry Road | IP12 3AS IP12 3AU IP12 3AW IP12 3AX IP12 3AY |
| Firebrass Lane | IP12 3TS |
| Greenways | IP12 3TP IP12 3TR |
| Heath Drive | IP12 3HF |
| Hollesley Road | IP12 3BX IP12 3DQ IP12 3HD |
| Main Road | IP12 3DU IP12 3DZ IP12 3EE IP12 3EJ |
| Methersgate | IP12 3JL |
| Mill Hoo | IP12 3DA |
| Mill Lane | IP12 3DB |
| New Houses | IP12 3EU |
| Orford Road | IP12 2PP IP12 2PT |
| Ramsholt Road | IP12 3AG IP12 3AQ |
| Red House Farm Lane | IP12 3AN |
| Red Rose Close | IP12 3DG |
| Sandy Lane | IP12 2PR |
| School Lane | IP12 2PX IP12 2PY IP12 2PZ |
| School Road | IP12 3AR |
| Sheepdrift Road | IP12 2SB |
| Shingle Street | IP12 3BE |
| Shottisham Road | IP12 3DE |
| St Edmunds Close | IP12 2PL |
| Summer Lane | IP12 2QA |
| Sutton Hoo | IP12 3DJ |
| Sutton Road | IP12 3DL IP12 3DN IP12 3DW |
| The Knoll | IP12 3BS |
| The Manor House Estate | IP12 3AL |
| The Pastures | IP12 3DS |
| The Street | IP12 2PH IP12 3AH IP12 3AJ IP12 3BL IP12 3BN IP12 3ET IP12 3EY IP12 3HA |
| The Walks | IP12 3DP |
| Thorn Walk | IP12 3TU |
| Ufford Road | IP12 2QB |
| Watson Way | IP12 3BZ |
| Wilford Bridge | IP12 3DH |
| Wood Hall Drive | IP12 3EG |
| Woodbridge Road | IP12 3EA |
| Yoxford Mews | IP12 3TH |
| IP12 2PG IP12 3AA IP12 3AT IP12 3BH IP12 3BT IP12 3DR IP12 3DT IP12 3ES |
Transport near Sutton
-
Woodbridge Station
-
Melton Station
-
Trimley Station
-
Felixstowe Station
-
Wickham Market Station
-
Derby Road Station
-
Harwich Town Station
-
Dovercourt Station
-
Harwich International Station
-
Westerfield Station
- FAQ
- Price Paid By Year
- Property Type Price
Frequently asked questions about Sutton
What is the average price for a property for sale in Sutton?
The average price for a property for sale in Sutton is £381,124. This amount is 10% lower than the average price in Woodbridge. There are 5,461 property listings for sale in Sutton.
What streets have the most expensive properties for sale in Sutton?
The streets with the most expensive properties for sale in Sutton are Sutton Road at an average of £1,250,000, Alderton Road at an average of £780,000 and The Pastures at an average of £605,000.
What streets have the most affordable properties for sale in Sutton?
The streets with the most affordable properties for sale in Sutton are Beach Lane at an average of £198,000, Woodbridge Road at an average of £229,500 and Heath Drive at an average of £233,000.
Which train stations are available in or near Sutton?
Some of the train stations available in or near Sutton are Woodbridge, Melton and Trimley.
Property Price Paid in Sutton by Year
The average sold property price by year was:
| Year | Average Sold Price | Price Change |
Sold Properties
|
|---|---|---|---|
| 2025 | £403,441 | 23% |
29 Properties |
| 2024 | £311,968 | -28% |
16 Properties |
| 2023 | £398,135 | -1% |
27 Properties |
| 2022 | £402,487 | -4% |
20 Properties |
| 2021 | £417,677 | 4% |
33 Properties |
| 2020 | £402,513 | -4% |
38 Properties |
| 2019 | £419,533 | 7% |
30 Properties |
| 2018 | £390,913 | 20% |
30 Properties |
| 2017 | £311,437 | -9% |
24 Properties |
| 2016 | £339,139 | 4% |
50 Properties |
| 2015 | £324,313 | 11% |
29 Properties |
| 2014 | £287,074 | 12% |
41 Properties |
| 2013 | £253,468 | -4% |
40 Properties |
| 2012 | £262,998 | 1% |
39 Properties |
| 2011 | £261,099 | 5% |
29 Properties |
| 2010 | £247,199 | 1% |
33 Properties |
| 2009 | £244,763 | -1% |
34 Properties |
| 2008 | £246,642 | -23% |
32 Properties |
| 2007 | £302,826 | 38% |
46 Properties |
| 2006 | £187,542 | 19% |
94 Properties |
| 2005 | £152,742 | -23% |
129 Properties |
| 2004 | £188,253 | 1% |
67 Properties |
| 2003 | £185,580 | 10% |
20 Properties |
| 2002 | £166,162 | 14% |
27 Properties |
| 2001 | £143,325 | 29% |
29 Properties |
| 2000 | £101,736 | -3% |
19 Properties |
| 1999 | £104,479 | -19% |
37 Properties |
| 1998 | £124,115 | 29% |
34 Properties |
| 1997 | £87,526 | 9% |
17 Properties |
| 1996 | £79,385 | -5% |
26 Properties |
| 1995 | £83,236 | - |
21 Properties |
Property Price per Property Type in Sutton
Here you can find historic sold price data in order to help with your property search.
The average Property Paid Price for specific property types in the last three years are:
| Property Type | Average Sold Price | Sold Properties |
|---|---|---|
| Semi Detached House | £294,074.00 | 48 Semi Detached Houses |
| Detached House | £561,647.00 | 23 Detached Houses |
| Terraced House | £407,500.00 | 1 Terraced House |

