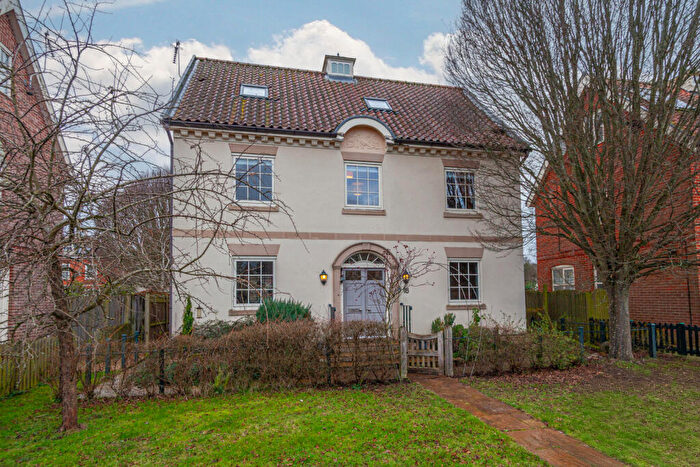
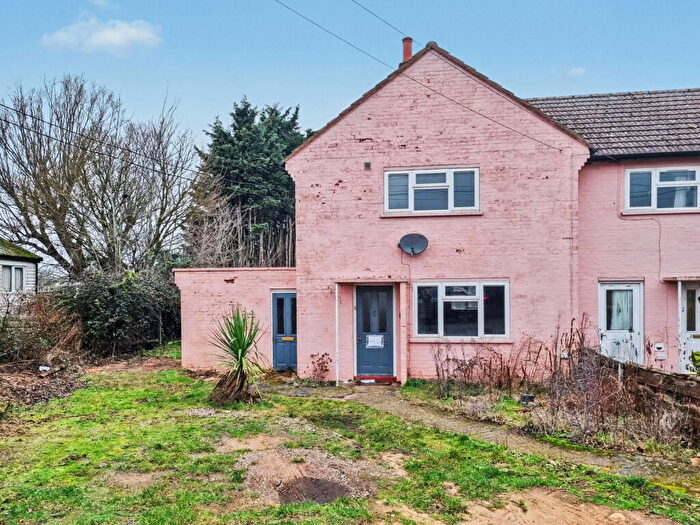
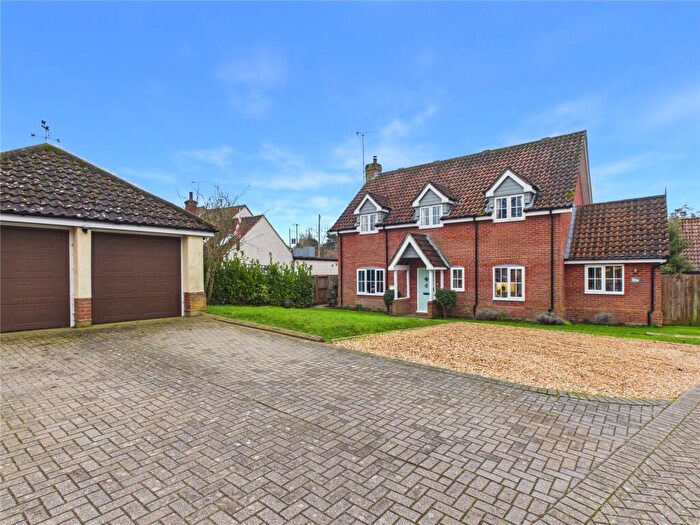
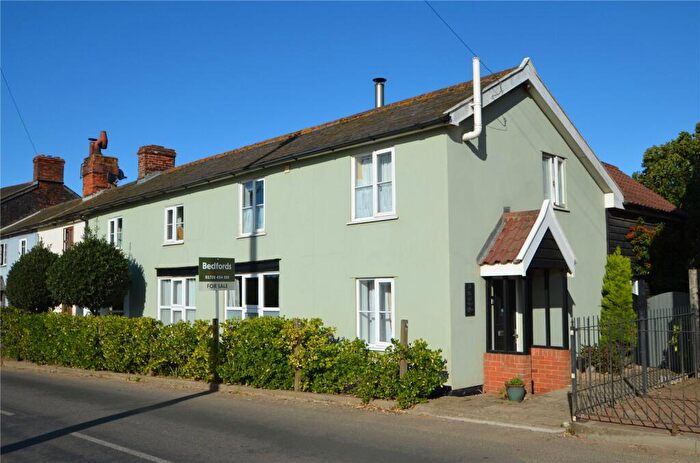
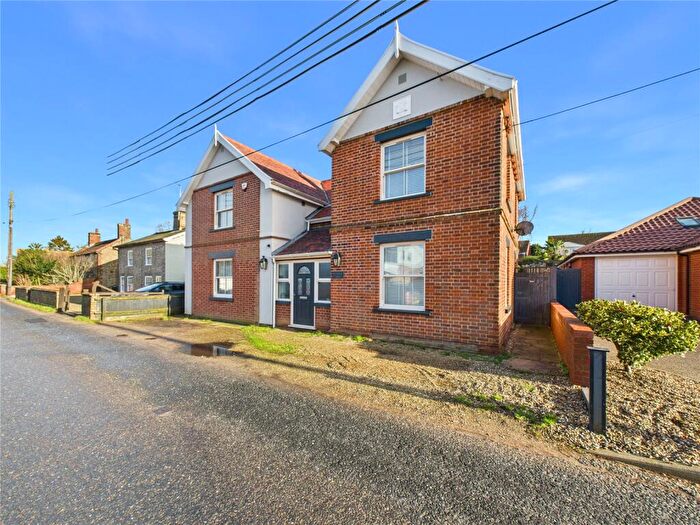
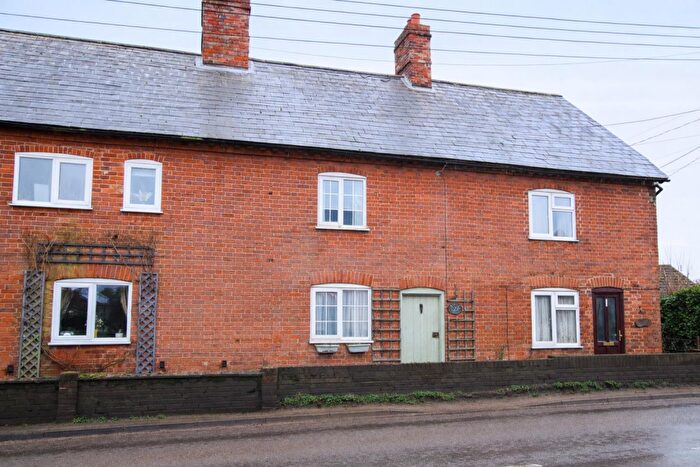
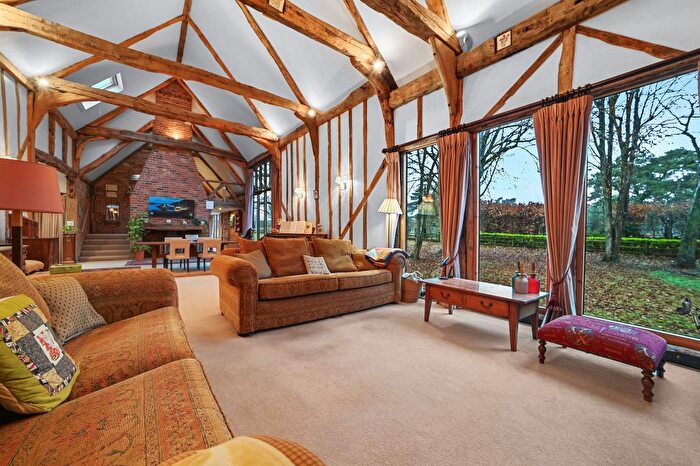
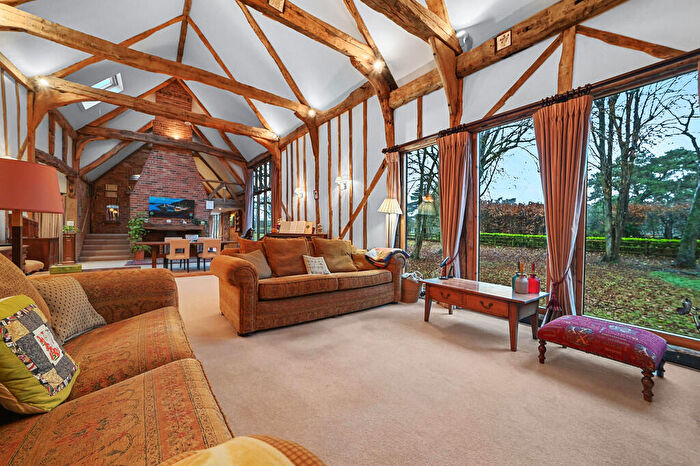
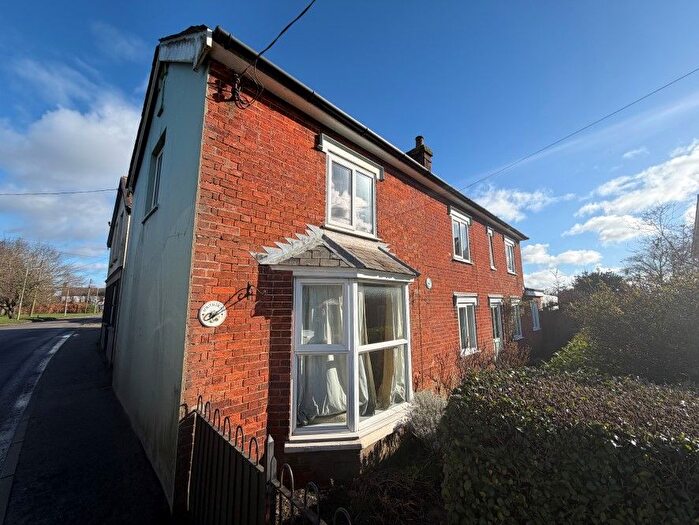
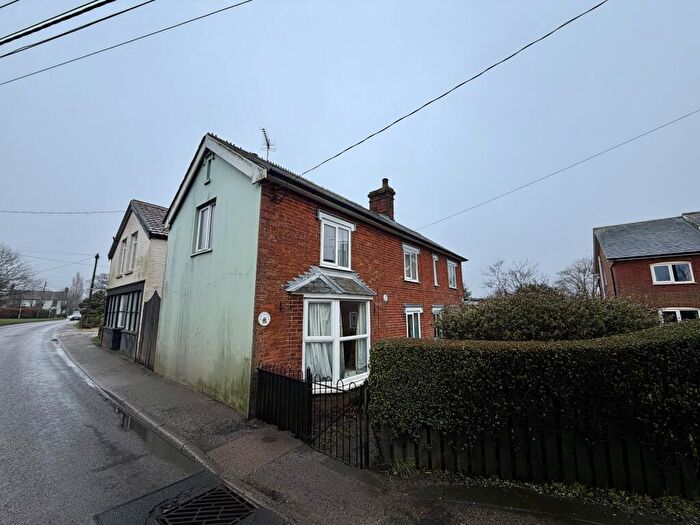
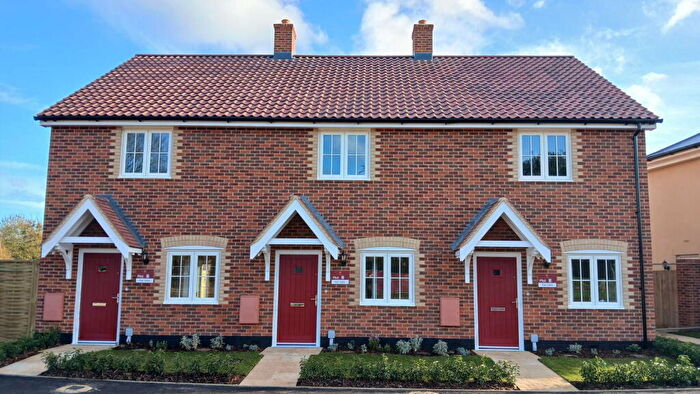
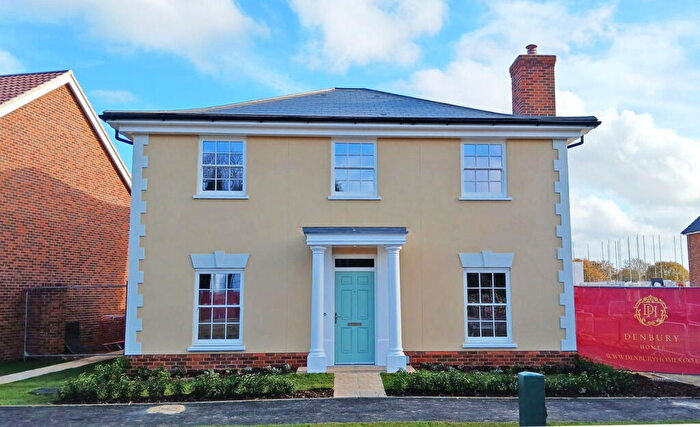
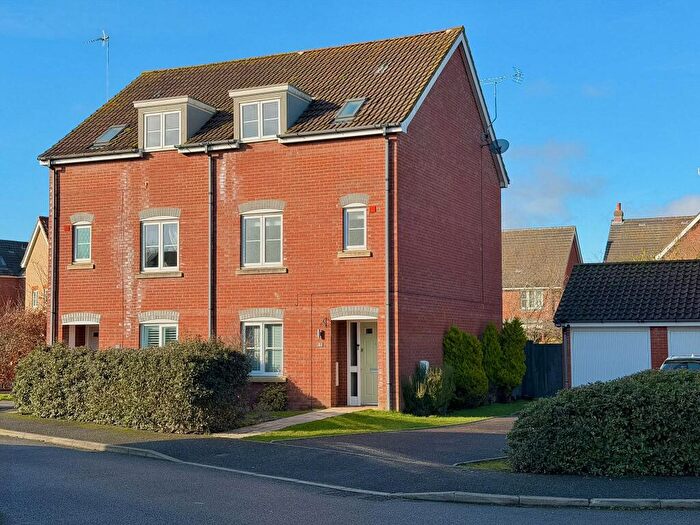
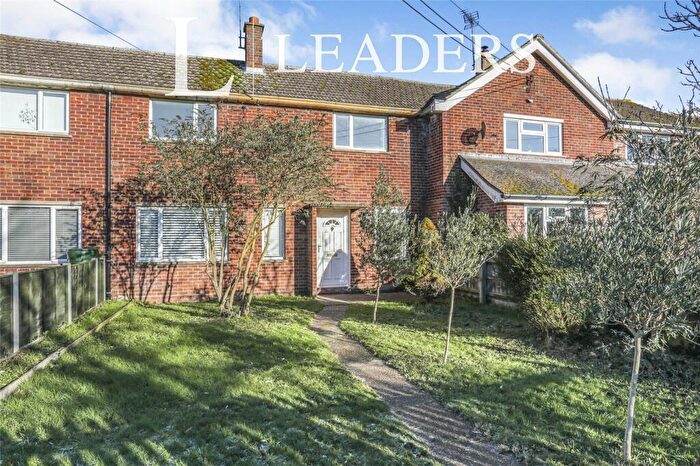
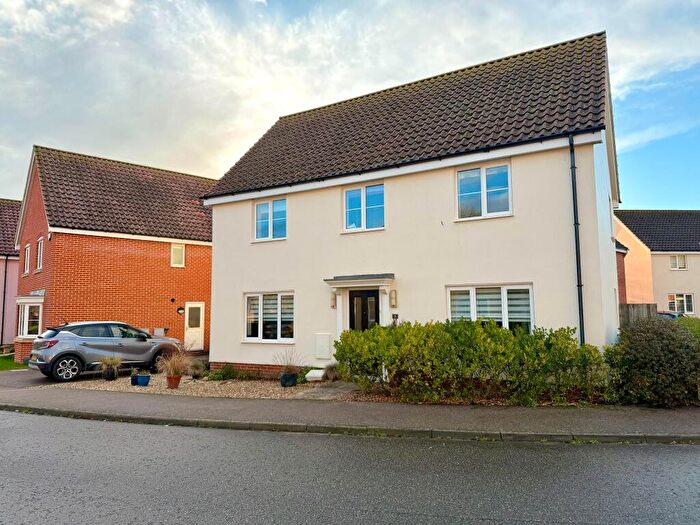
Houses for sale & to rent in Hollesley With Eyke, Woodbridge
House Prices in Hollesley With Eyke
Properties in Hollesley With Eyke have an average house price of £405,315.00 and had 72 Property Transactions within the last 3 years¹.
Hollesley With Eyke is an area in Woodbridge, Suffolk with 769 households², where the most expensive property was sold for £1,250,000.00.
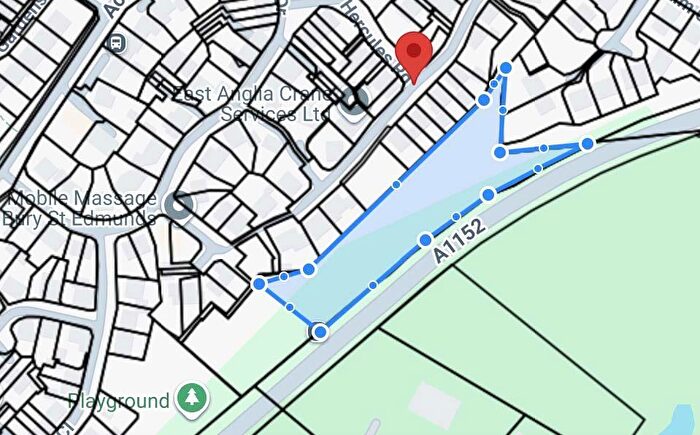
Properties for sale in Hollesley With Eyke
Roads and Postcodes in Hollesley With Eyke
Navigate through our locations to find the location of your next house in Hollesley With Eyke, Woodbridge for sale or to rent.
| Streets | Postcodes |
|---|---|
| Acorn Rise | IP12 3JT |
| Alderton Road | IP12 3RH IP12 3RJ IP12 3RQ |
| Boyton Road | IP12 3LD |
| Brick Kiln | IP12 3PX |
| Bushy Lane | IP12 3RU IP12 3RY |
| Church Farm Bungalows | IP12 2QH |
| Church Lane | IP12 2QS IP12 2QT |
| Coronation Avenue | IP12 3RP |
| Cottons Acre | IP12 3LP |
| Cracks Lane | IP12 2SP |
| Duck Corner | IP12 3QS |
| Fenn Row | IP12 3PJ |
| Fox Hill | IP12 3RA IP12 3RD |
| Gorselands | IP12 3QL |
| Hayhall Cottages | IP12 3LG |
| Hertfords Place | IP12 3SD |
| High Corner | IP12 3QF |
| Hollesley Road | IP12 3HE |
| Land At | IP12 3NQ |
| Lodge Road | IP12 3RR |
| Low Corner | IP12 3QD |
| Low Road | IP12 2QF |
| Mallard Way | IP12 3QJ |
| Melton Road | IP12 3LB |
| Mill Lane | IP12 3LL IP12 3PZ |
| Moorlands | IP12 3QP |
| Myrtle Cottages | IP12 2QQ |
| Oak Hill | IP12 3JY IP12 3JZ |
| Oak Tree Close | IP12 3QW |
| Oaktree Drive | IP12 2SQ |
| Orford Road | IP12 3PP |
| Padley Water | IP12 3PR |
| Parsons Hill | IP12 3RB |
| Pedlars Lane | IP12 3PT |
| Poplar Farm Cottages | IP12 3NA |
| Rectory Road | IP12 3JS |
| School Cottages | IP12 2QP |
| School Lane | IP12 3RE IP12 3RF |
| Shannon Heights | IP12 3SF |
| Short Walk | IP12 3NU |
| Spratt Street | IP12 2RY |
| Stebbings Close | IP12 3QY |
| Stebbings Lane | IP12 3QZ |
| Swallows Close | IP12 3RW |
| The Street | IP12 2QG IP12 2QL IP12 2QN IP12 2QR IP12 2QW IP12 2QX IP12 3LW IP12 3PB IP12 3PD IP12 3PE IP12 3PU IP12 3QU |
| Tower Hill Road | IP12 3QX |
| Ufford Road | IP12 2QE |
| White Womans Lane | IP12 2SY |
| William Close | IP12 2SA |
| Willoughby Rise | IP12 3QN |
| Wood Cottages | IP12 3PS |
| Woodbridge Road | IP12 3QR |
| Woodbridge Walk | IP12 3LA |
| IP12 3LE IP12 3LH IP12 3NF IP12 3NL IP12 3NY |
Transport near Hollesley With Eyke
-
Melton Station
-
Woodbridge Station
-
Wickham Market Station
-
Felixstowe Station
-
Trimley Station
-
Saxmundham Station
- FAQ
- Price Paid By Year
- Property Type Price
Frequently asked questions about Hollesley With Eyke
What is the average price for a property for sale in Hollesley With Eyke?
The average price for a property for sale in Hollesley With Eyke is £405,315. This amount is 4% lower than the average price in Woodbridge. There are 609 property listings for sale in Hollesley With Eyke.
What streets have the most expensive properties for sale in Hollesley With Eyke?
The streets with the most expensive properties for sale in Hollesley With Eyke are School Lane at an average of £630,000, Rectory Road at an average of £611,333 and Shannon Heights at an average of £595,000.
What streets have the most affordable properties for sale in Hollesley With Eyke?
The streets with the most affordable properties for sale in Hollesley With Eyke are Cottons Acre at an average of £246,000, Moorlands at an average of £249,375 and Ufford Road at an average of £250,000.
Which train stations are available in or near Hollesley With Eyke?
Some of the train stations available in or near Hollesley With Eyke are Melton, Woodbridge and Wickham Market.
Property Price Paid in Hollesley With Eyke by Year
The average sold property price by year was:
| Year | Average Sold Price | Price Change |
Sold Properties
|
|---|---|---|---|
| 2025 | £381,413 | -8% |
23 Properties |
| 2024 | £410,907 | -3% |
27 Properties |
| 2023 | £423,440 | 10% |
22 Properties |
| 2022 | £382,825 | -5% |
20 Properties |
| 2021 | £403,814 | 22% |
35 Properties |
| 2020 | £316,241 | 10% |
29 Properties |
| 2019 | £284,586 | -0,3% |
26 Properties |
| 2018 | £285,386 | -13% |
21 Properties |
| 2017 | £321,424 | 12% |
33 Properties |
| 2016 | £283,983 | 5% |
31 Properties |
| 2015 | £271,151 | 19% |
33 Properties |
| 2014 | £220,107 | -4% |
35 Properties |
| 2013 | £229,892 | -2% |
35 Properties |
| 2012 | £234,081 | -13% |
57 Properties |
| 2011 | £265,208 | -4% |
24 Properties |
| 2010 | £276,075 | 18% |
26 Properties |
| 2009 | £227,227 | -8% |
16 Properties |
| 2008 | £244,532 | 13% |
20 Properties |
| 2007 | £213,834 | -11% |
42 Properties |
| 2006 | £238,087 | 4% |
45 Properties |
| 2005 | £229,246 | 22% |
44 Properties |
| 2004 | £178,119 | 3% |
30 Properties |
| 2003 | £172,857 | 12% |
40 Properties |
| 2002 | £151,361 | 21% |
43 Properties |
| 2001 | £119,667 | -6% |
39 Properties |
| 2000 | £126,727 | 15% |
51 Properties |
| 1999 | £108,017 | 29% |
35 Properties |
| 1998 | £76,505 | 18% |
50 Properties |
| 1997 | £63,046 | -13% |
45 Properties |
| 1996 | £71,248 | 10% |
43 Properties |
| 1995 | £64,424 | - |
36 Properties |
Property Price per Property Type in Hollesley With Eyke
Here you can find historic sold price data in order to help with your property search.
The average Property Paid Price for specific property types in the last three years are:
| Property Type | Average Sold Price | Sold Properties |
|---|---|---|
| Semi Detached House | £314,536.00 | 19 Semi Detached Houses |
| Detached House | £480,337.00 | 43 Detached Houses |
| Terraced House | £255,200.00 | 10 Terraced Houses |

