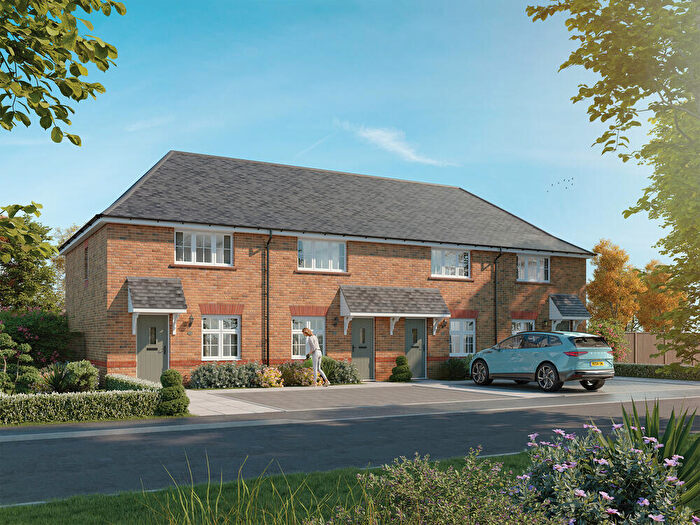
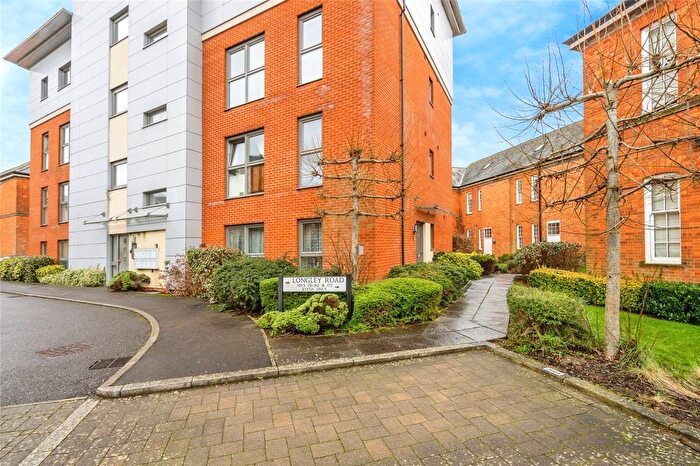
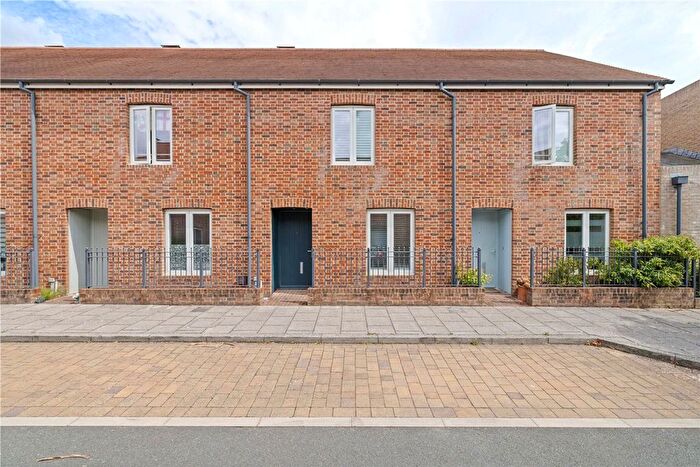
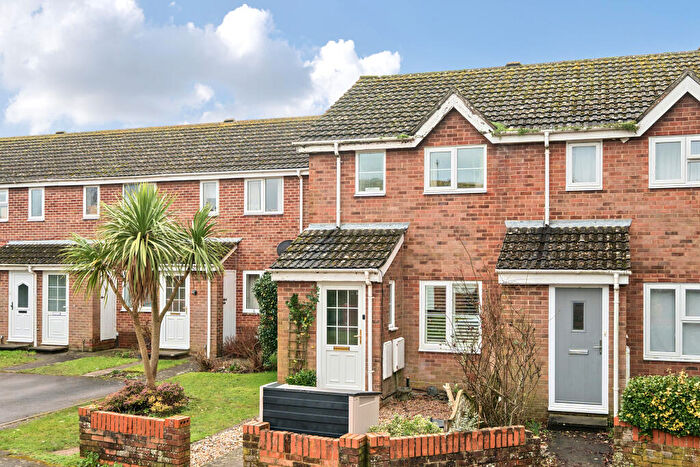
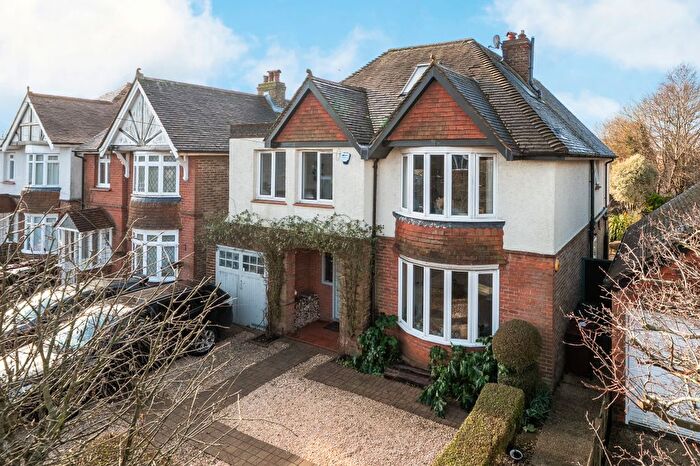
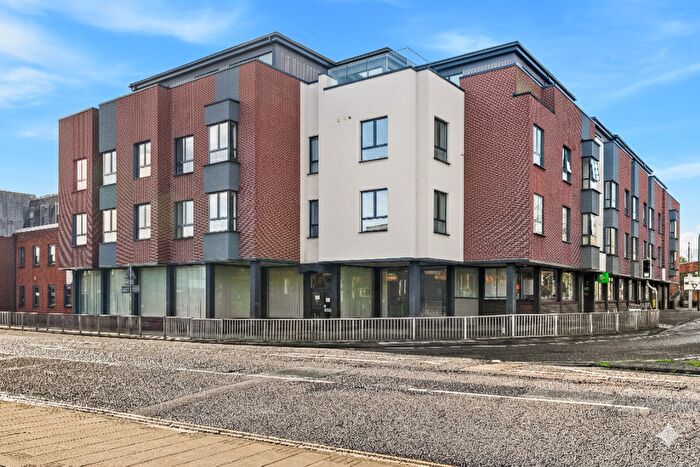
Houses for sale & to rent in Boxgrove, Chichester
House Prices in Boxgrove
Properties in Boxgrove have an average house price of £636,595.00 and had 62 Property Transactions within the last 3 years¹.
Boxgrove is an area in Chichester, Surrey with 814 households², where the most expensive property was sold for £3,961,930.00.
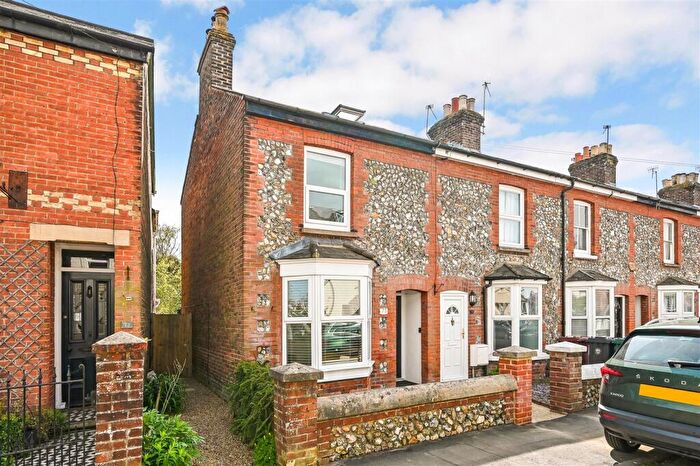
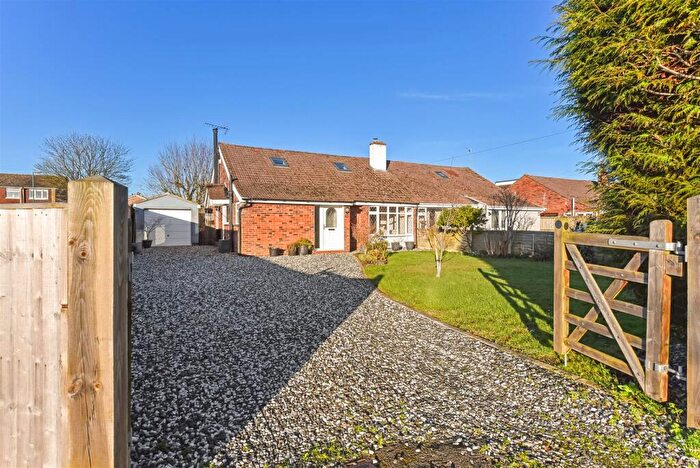
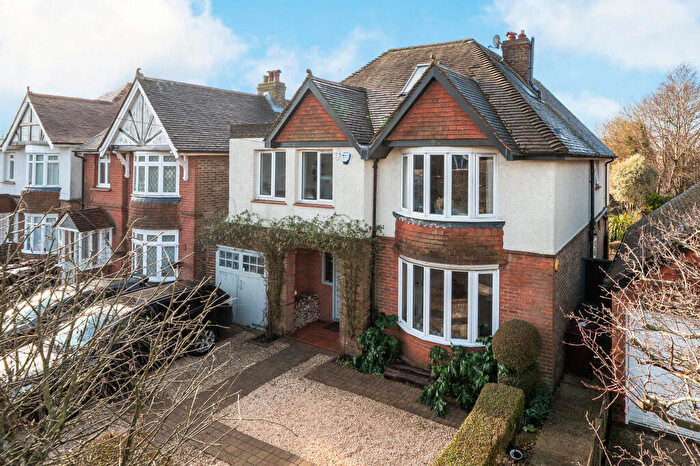
Properties for sale in Boxgrove
Roads and Postcodes in Boxgrove
Navigate through our locations to find the location of your next house in Boxgrove, Chichester for sale or to rent.
| Streets | Postcodes |
|---|---|
| Abbotts Close | PO18 0EL |
| Aldingbourne Drive | PO18 0SD |
| Arundel Road | PO18 0DZ |
| Bankside | PO18 0HT |
| Binderton Lane | PO18 0JS |
| Butchers Lane | PO18 0JE PO18 0JF |
| Cemetery Lane | PO18 0FG |
| Chapel Row | PO18 0JD |
| Charlton Mill Way | PO18 0HY |
| Chilgrove | PO18 9HU PO18 9NA |
| Chilgrove Road | PO18 9HW |
| Church Lane | PO18 0ED |
| Church Way | PO18 0ET |
| Cobblers Row | PO18 0HN |
| Crockerhill | PO18 0LH |
| Crouch Cross Lane | PO18 0EF PO18 0EH |
| Droke Lane | PO18 0JH PO18 0JJ |
| High Street | PO18 9HX |
| Hylters Lane | PO18 9HT |
| Kirkby Close | PO18 0EQ |
| Newhouse Lane | PO18 0NJ |
| North Barn Cottages | PO18 0LU |
| Oakford Park | PO18 0BF |
| Park Lane | PO18 0QW |
| Pearman Court | PO18 0HE |
| Priors Acre | PO18 0ER |
| Priory Close | PO18 0EA |
| Rose Cottages | PO18 0HP |
| St Blaises Road | PO18 0EJ |
| St Marys Road | PO18 0EN |
| Strettington Lane | PO18 0LA |
| The Leys | PO18 0HR |
| The Steps | PO18 0LN |
| The Street | PO18 0DX PO18 0DY PO18 0EB PO18 0EE |
| The Warren | PO18 0RP |
| PO18 0EX PO18 0EY PO18 0EZ PO18 0HA PO18 0HB PO18 0HD PO18 0HF PO18 0HJ PO18 0HU PO18 0HW PO18 0HX PO18 0JA PO18 0JB PO18 0JG PO18 0LB PO18 0LP PO18 0LS PO18 0LT PO18 0NF PO18 0NG PO18 0NH PO18 0NQ PO18 0QE PO18 0QY PO18 0SB PO18 9HN |
Transport near Boxgrove
-
Chichester Station
-
Fishbourne Station
-
Barnham Station
-
Bosham Station
-
Nutbourne Station
-
Bognor Regis Station
-
Ford Station
-
Southbourne Station
-
Amberley Station
-
Arundel Station
- FAQ
- Price Paid By Year
- Property Type Price
Frequently asked questions about Boxgrove
What is the average price for a property for sale in Boxgrove?
The average price for a property for sale in Boxgrove is £636,595. This amount is 31% higher than the average price in Chichester. There are 6,669 property listings for sale in Boxgrove.
What streets have the most expensive properties for sale in Boxgrove?
The streets with the most expensive properties for sale in Boxgrove are Park Lane at an average of £3,961,930, Strettington Lane at an average of £1,332,500 and Rose Cottages at an average of £925,000.
What streets have the most affordable properties for sale in Boxgrove?
The streets with the most affordable properties for sale in Boxgrove are Priors Acre at an average of £240,000, St Marys Road at an average of £294,250 and St Blaises Road at an average of £300,000.
Which train stations are available in or near Boxgrove?
Some of the train stations available in or near Boxgrove are Chichester, Fishbourne and Barnham.
Property Price Paid in Boxgrove by Year
The average sold property price by year was:
| Year | Average Sold Price | Price Change |
Sold Properties
|
|---|---|---|---|
| 2025 | £552,600 | -32% |
20 Properties |
| 2024 | £730,453 | 16% |
23 Properties |
| 2023 | £611,394 | -5% |
19 Properties |
| 2022 | £644,000 | 16% |
18 Properties |
| 2021 | £542,013 | -55% |
36 Properties |
| 2020 | £839,602 | 44% |
19 Properties |
| 2019 | £472,947 | -18% |
20 Properties |
| 2018 | £556,406 | -6% |
29 Properties |
| 2017 | £590,045 | -5% |
21 Properties |
| 2016 | £617,138 | 27% |
25 Properties |
| 2015 | £447,906 | -12% |
32 Properties |
| 2014 | £500,291 | 25% |
31 Properties |
| 2013 | £377,194 | -27% |
28 Properties |
| 2012 | £480,066 | -9% |
37 Properties |
| 2011 | £522,676 | 22% |
17 Properties |
| 2010 | £406,347 | 8% |
35 Properties |
| 2009 | £373,324 | -28% |
25 Properties |
| 2008 | £478,466 | 24% |
15 Properties |
| 2007 | £362,101 | -7% |
29 Properties |
| 2006 | £385,724 | 10% |
35 Properties |
| 2005 | £346,536 | -10% |
25 Properties |
| 2004 | £380,014 | 35% |
32 Properties |
| 2003 | £246,652 | -8% |
24 Properties |
| 2002 | £266,040 | 27% |
37 Properties |
| 2001 | £195,165 | -33% |
41 Properties |
| 2000 | £260,068 | 26% |
32 Properties |
| 1999 | £192,347 | 16% |
34 Properties |
| 1998 | £161,224 | -3% |
29 Properties |
| 1997 | £166,094 | 12% |
49 Properties |
| 1996 | £146,128 | 6% |
32 Properties |
| 1995 | £137,203 | - |
27 Properties |
Property Price per Property Type in Boxgrove
Here you can find historic sold price data in order to help with your property search.
The average Property Paid Price for specific property types in the last three years are:
| Property Type | Average Sold Price | Sold Properties |
|---|---|---|
| Semi Detached House | £421,636.00 | 11 Semi Detached Houses |
| Detached House | £836,164.00 | 30 Detached Houses |
| Terraced House | £511,722.00 | 18 Terraced Houses |
| Flat | £178,333.00 | 3 Flats |

