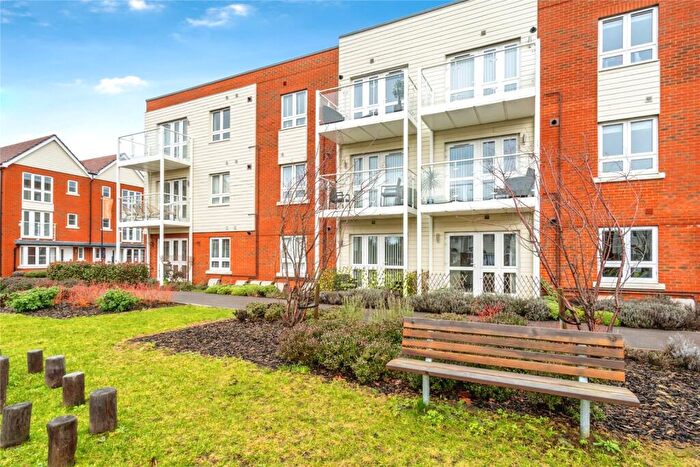
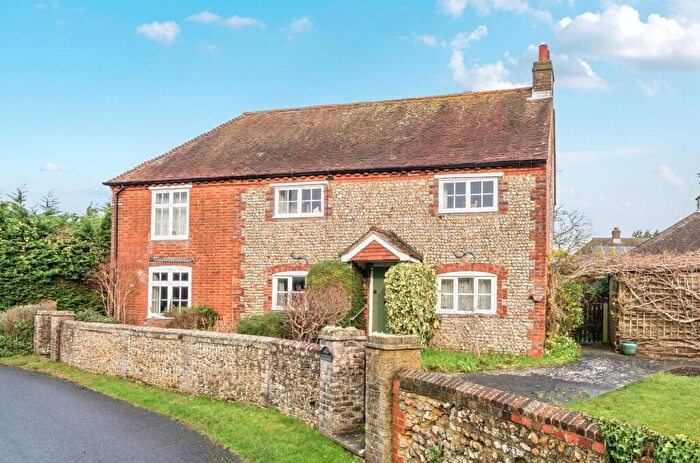
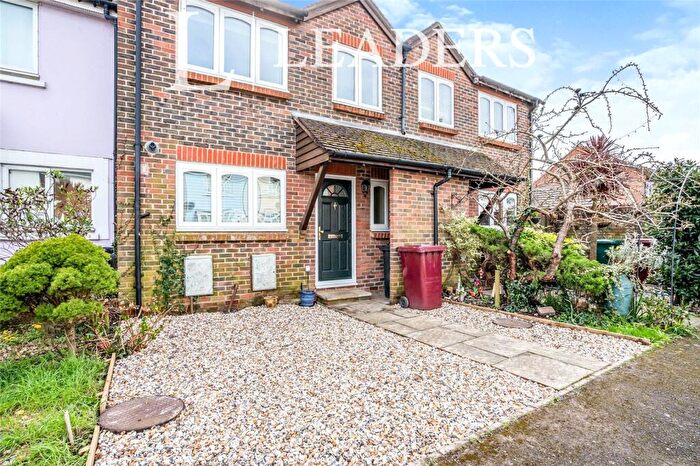
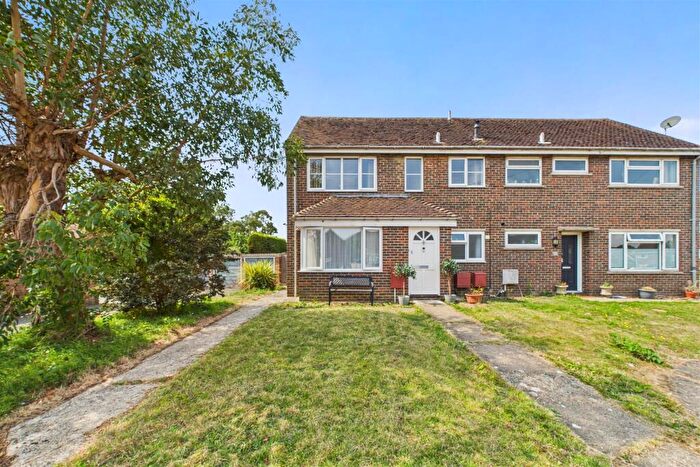
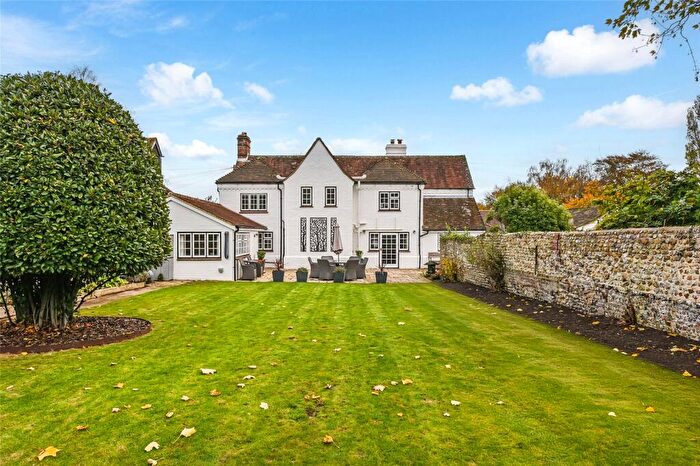
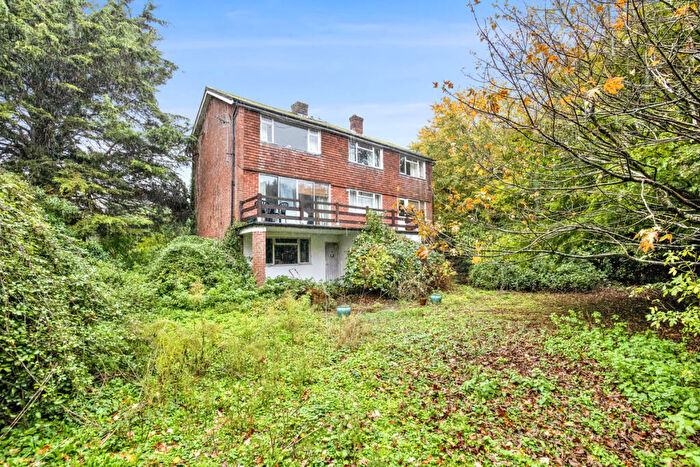
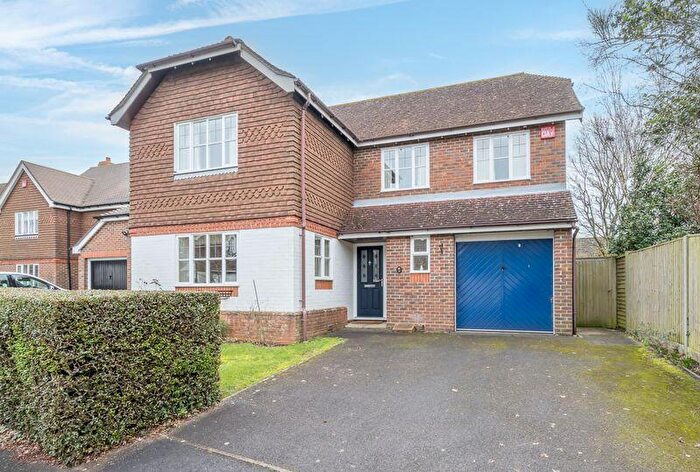
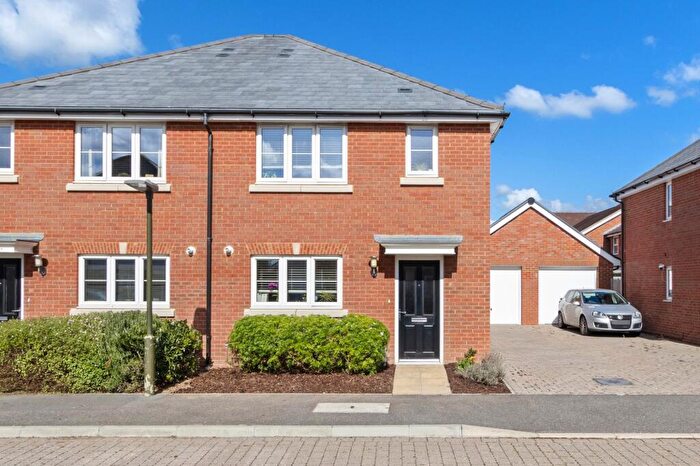
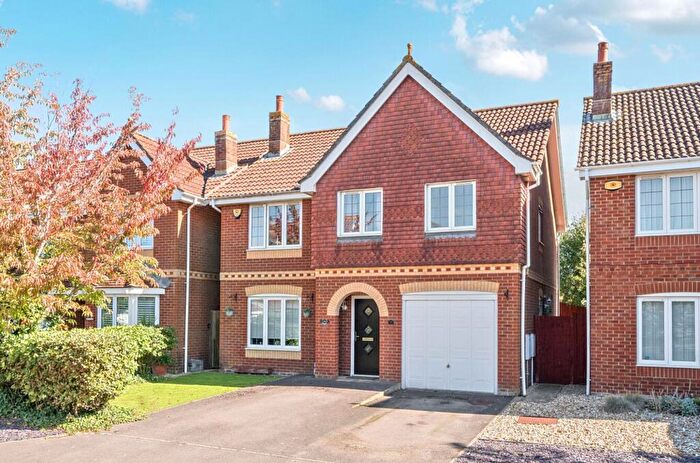
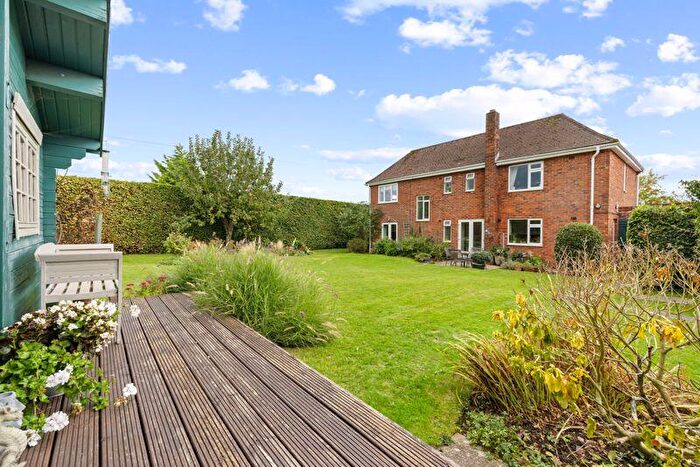
Houses for sale & to rent in Tangmere, Chichester
House Prices in Tangmere
Properties in Tangmere have an average house price of £361,137.00 and had 95 Property Transactions within the last 3 years¹.
Tangmere is an area in Chichester, Surrey with 966 households², where the most expensive property was sold for £949,000.00.
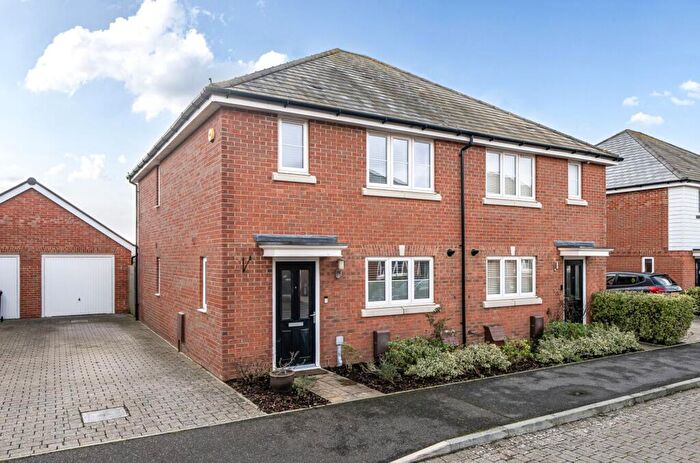
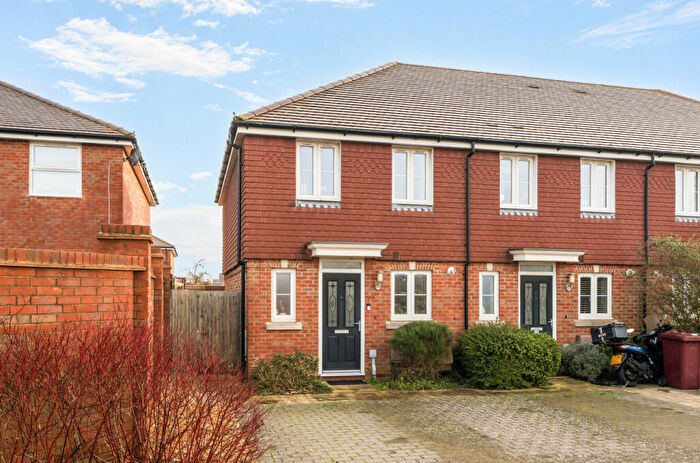
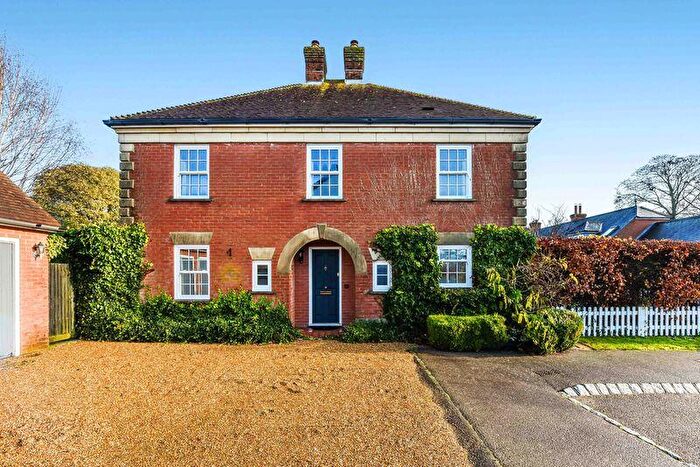
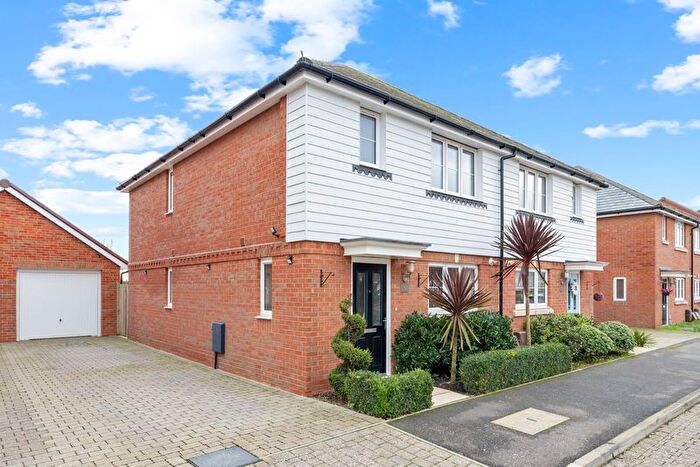
Properties for sale in Tangmere
Roads and Postcodes in Tangmere
Navigate through our locations to find the location of your next house in Tangmere, Chichester for sale or to rent.
| Streets | Postcodes |
|---|---|
| Arundel Road | PO18 0DU PO18 0JZ |
| Barncroft Close | PO20 2FE |
| Bayley Road | PO20 2ET |
| Bishop Road | PO20 2JB |
| Caedwalla Drive | PO20 2HJ |
| Cheshire Crescent | PO20 2HT |
| Chestnut Walk | PO20 2HH PO20 2HL |
| Chichester Drive | PO20 2FA PO20 2FF |
| Church Lane | PO20 2EZ PO20 2HA |
| Churchwood Drive | PO20 2FN PO20 2GB PO20 2GS PO20 2GY |
| City Fields Way | PO20 2WA |
| Copper Beech Drive | PO20 2HN |
| Derwent Close | PO20 2FQ |
| Duxford Close | PO20 2JH |
| Easthampnett Lane | PO18 0JY |
| Edwards Avenue | PO20 2HP |
| Fulmar Way | PO20 2GG |
| Garland Square | PO20 2JF |
| Gibson Road | PO20 2JA |
| Haleybridge Walk | PO20 2HG |
| Haresfield Terrace | PO20 2EX |
| Hawker Close | PO20 2JE |
| Hearn Close | PO20 2EY |
| Hunters Gate | PO20 2GT |
| Jerrard Road | PO20 2FD |
| Lysander Way | PO20 2FJ |
| Malcolm Road | PO20 2HS |
| Mannock Road | PO20 2HU |
| Marsh Lane | PO18 0JW |
| Meadowside Walk | PO20 2WR |
| Middleton Gardens | PO20 2JD |
| Nelson Close | PO20 2FW |
| Nettleton Avenue | PO20 2HZ |
| Neville Duke Way | PO20 2AS PO20 2AU |
| Nicolson Close | PO20 2LA |
| Oakwood Close | PO20 2WD |
| Old Cottage Close | PO20 2HF |
| Saxon Meadow | PO20 2GA |
| St Andrews Lane | PO20 2HQ |
| Tamar Way | PO20 2FG |
| Tangmere Road | PO20 2GZ PO20 2HB PO20 2HE PO20 2HR PO20 2HW |
| The Boulevard | PO20 2AN PO20 2AQ |
| The Glebe | PO20 2HD |
| Wellington Place | PO20 2AL |
| Whitebeam Way | PO20 2FB |
| Windmill Drive | PO20 2AP |
| Woodfield Close | PO20 2FL |
| Wyvern Close | PO20 2GQ |
Transport near Tangmere
- FAQ
- Price Paid By Year
- Property Type Price
Frequently asked questions about Tangmere
What is the average price for a property for sale in Tangmere?
The average price for a property for sale in Tangmere is £361,137. This amount is 26% lower than the average price in Chichester. There are 613 property listings for sale in Tangmere.
What streets have the most expensive properties for sale in Tangmere?
The streets with the most expensive properties for sale in Tangmere are Jerrard Road at an average of £949,000, Chestnut Walk at an average of £795,000 and Nettleton Avenue at an average of £647,500.
What streets have the most affordable properties for sale in Tangmere?
The streets with the most affordable properties for sale in Tangmere are Garland Square at an average of £227,500, Tamar Way at an average of £230,016 and Woodfield Close at an average of £244,714.
Which train stations are available in or near Tangmere?
Some of the train stations available in or near Tangmere are Chichester, Barnham and Fishbourne.
Property Price Paid in Tangmere by Year
The average sold property price by year was:
| Year | Average Sold Price | Price Change |
Sold Properties
|
|---|---|---|---|
| 2025 | £334,835 | -6% |
28 Properties |
| 2024 | £356,185 | -9% |
32 Properties |
| 2023 | £386,705 | 14% |
35 Properties |
| 2022 | £332,178 | 5% |
30 Properties |
| 2021 | £316,959 | 2% |
57 Properties |
| 2020 | £310,052 | 6% |
19 Properties |
| 2019 | £292,775 | 1% |
49 Properties |
| 2018 | £288,938 | -7% |
46 Properties |
| 2017 | £309,256 | 4% |
58 Properties |
| 2016 | £297,726 | 11% |
50 Properties |
| 2015 | £265,776 | 0,5% |
51 Properties |
| 2014 | £264,494 | 20% |
53 Properties |
| 2013 | £210,791 | -11% |
34 Properties |
| 2012 | £234,711 | -0,2% |
36 Properties |
| 2011 | £235,206 | 5% |
36 Properties |
| 2010 | £224,021 | 9% |
55 Properties |
| 2009 | £203,862 | -9% |
48 Properties |
| 2008 | £223,140 | -5% |
25 Properties |
| 2007 | £233,979 | 5% |
62 Properties |
| 2006 | £221,812 | 22% |
60 Properties |
| 2005 | £172,586 | -27% |
42 Properties |
| 2004 | £218,365 | 12% |
59 Properties |
| 2003 | £191,672 | 12% |
59 Properties |
| 2002 | £168,077 | 14% |
113 Properties |
| 2001 | £144,249 | 19% |
73 Properties |
| 2000 | £116,682 | 15% |
75 Properties |
| 1999 | £99,305 | 6% |
86 Properties |
| 1998 | £92,889 | 11% |
67 Properties |
| 1997 | £82,632 | 8% |
70 Properties |
| 1996 | £75,827 | 18% |
70 Properties |
| 1995 | £62,001 | - |
49 Properties |
Property Price per Property Type in Tangmere
Here you can find historic sold price data in order to help with your property search.
The average Property Paid Price for specific property types in the last three years are:
| Property Type | Average Sold Price | Sold Properties |
|---|---|---|
| Semi Detached House | £353,711.00 | 26 Semi Detached Houses |
| Detached House | £533,258.00 | 23 Detached Houses |
| Terraced House | £288,504.00 | 40 Terraced Houses |
| Flat | £217,733.00 | 6 Flats |

