
Houses for sale in Fishbourne, Chichester
House Prices in Fishbourne
Properties in Fishbourne have an average house price of £501k and had 88 Property Transactions within the last 3 years¹.
Fishbourne is an area in Chichester, Surrey with 1,020 households², where the most expensive property was sold for £1.3M.
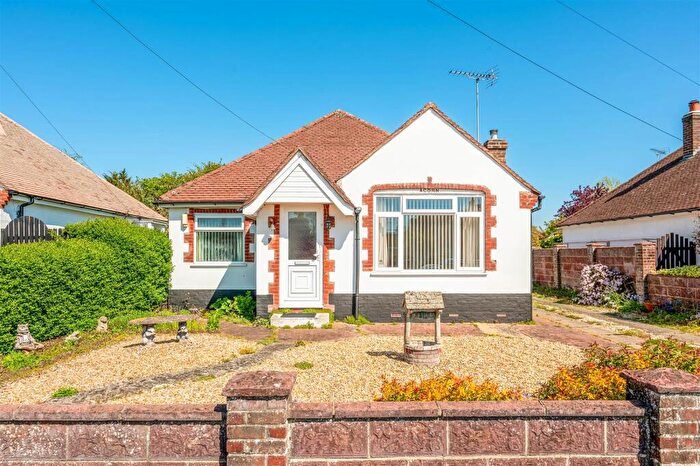
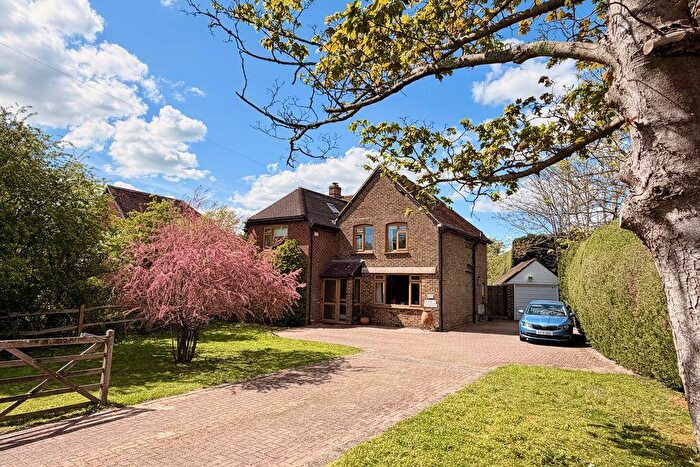
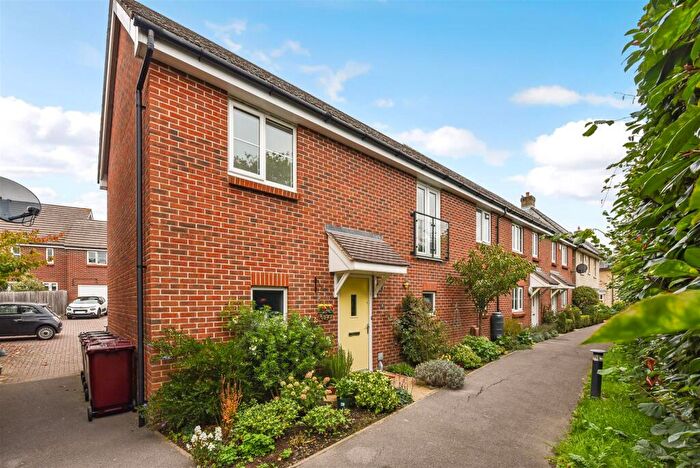
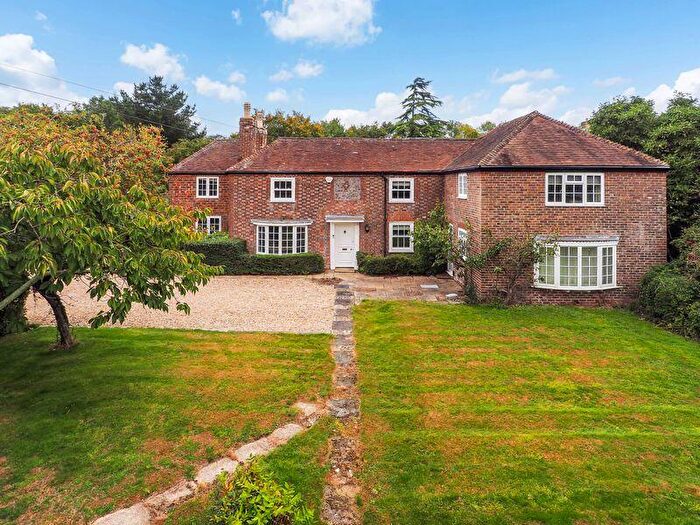
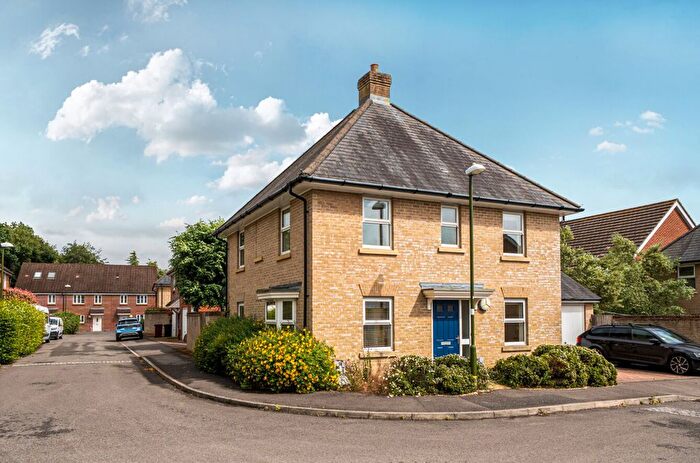
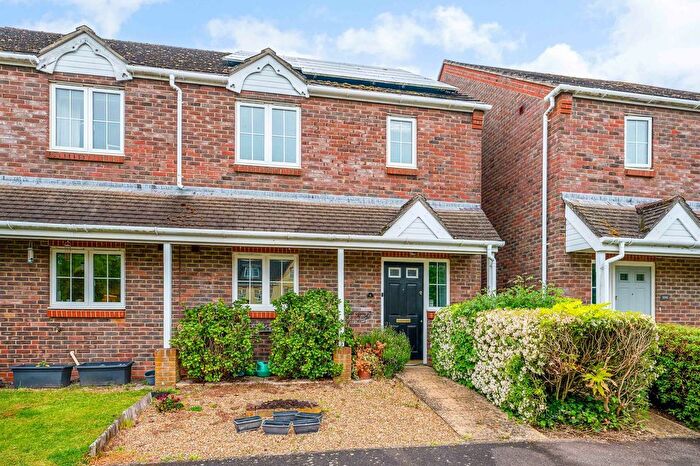
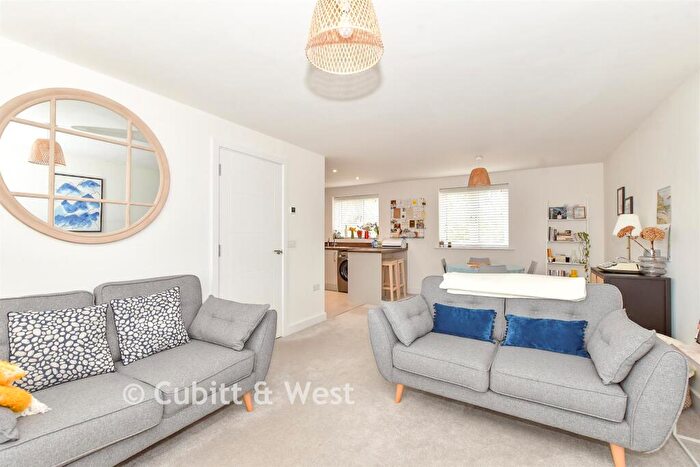
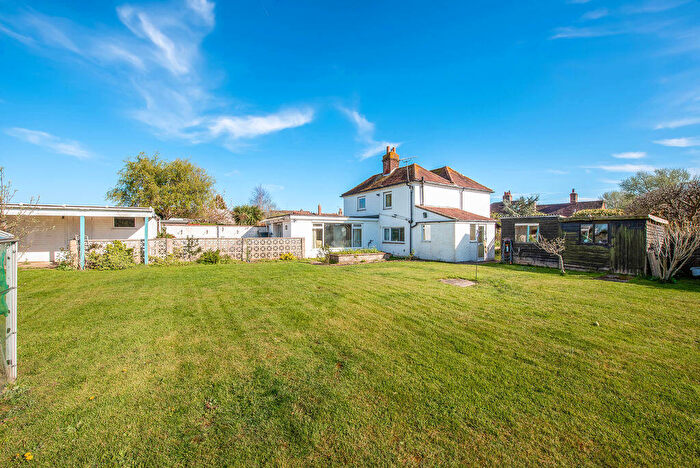
Properties for sale in Fishbourne
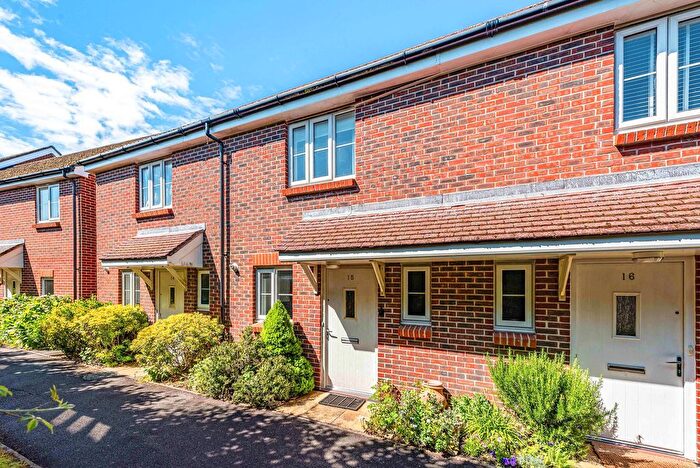
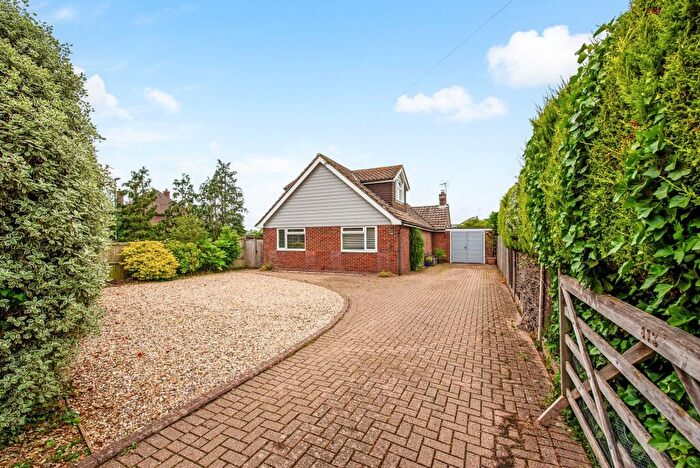

![]()
If you are looking to sell your house, let it out, or receive a property valuation, an expert can help you.
Click the button below to get started.
Previously listed properties in Fishbourne

Roads and Postcodes in Fishbourne
Navigate through our locations to find the location of your next house in Fishbourne, Chichester for sale or to rent.
| Streets | Postcodes |
|---|---|
| Appledram Lane South | PO20 7PE |
| Barker Close | PO18 8BJ |
| Beaver Close | PO19 3QU |
| Bethwines Close | PO18 8BP |
| Blackboy Lane | PO18 8AZ PO18 8BE PO18 8BH PO18 8BL PO18 8BN |
| Blakeney Close | PO19 3JY |
| Bourne Close | PO19 3QJ |
| Caspian Close | PO18 8AY |
| Claver Gardens | PO19 3FB |
| Clay Lane | PO18 8AH PO18 8BS PO18 8BT PO18 8DW PO19 3PX |
| Creek End | PO19 3JS |
| Cuckoo Fields | PO18 8EF |
| Deeside Avenue | PO19 3QF PO19 3QG |
| Dolphin Close | PO19 3QP |
| Farm Close | PO18 8AW |
| Fishbourne Road West | PO19 3JJ PO19 3JL PO19 3JP PO19 3JR PO19 3PU |
| Follis Gardens | PO19 3RP |
| Frampton Close | PO19 3DF |
| Fraser Row | PO18 8EG |
| Gilpin Close | PO19 3QW |
| Godwin Way | PO18 8BW |
| Halfrey Close | PO18 8BX |
| Halfrey Road | PO18 8BU |
| Main Road | PO18 8AN PO18 8AR PO18 8AT PO18 8AU PO18 8AX PO18 8BA PO18 8BB PO18 8BD PO18 8XX |
| Margary Close | PO19 3SD |
| Mill Close | PO19 3JW |
| Mill Lane | PO19 3JN |
| Mosse Gardens | PO19 3PG PO19 3PQ |
| Newport Drive | PO19 3QQ |
| Nursery Lane | PO19 3QE |
| Old Park Lane | PO18 8AP PO18 8HA |
| Polthooks Cottages | PO18 8AL |
| Roman Way | PO19 3QN PO19 3QT |
| Roman Wharf | PO19 3RZ |
| Rudkin Place | PO18 8FH |
| Salthill Road | PO19 3PZ PO19 3QD PO19 3QH PO19 3QL PO19 3QX |
| Senator Gardens | PO19 3RL |
| Storrington Close | PO19 3QB |
Property price trends in Fishbourne
According to the latest Land Registry data, the average home in Fishbourne sold for £565,000 in 2026. That figure comes from 1,445 sales logged over the past 31 years.
Prices have continued to climb over the last three years. Compared with 2023, when the typical sale came in around £398,700, that's a rise of roughly 41.7%.
Looking back five years, average prices are up about 42.3% since 2021, a gain of around £167,938 in cash terms.
Zoom out to the past decade for the fuller picture. Back in 2016, homes here averaged £349,175, so the typical sold price has climbed about 61.8% since then, roughly 4.9% a year. Stretch the view to fifteen years and that annual pace edges up closer to 5.5%.
Frequently asked questions about Fishbourne
What is the average price for a property for sale in Fishbourne?
The average price for a property for sale in Fishbourne is £500,900. This amount is 4% higher than the average price in Chichester. There are 305 property listings for sale in Fishbourne.
What streets have the most expensive properties for sale in Fishbourne?
The streets with the most expensive properties for sale in Fishbourne are Mill Lane at an average of £1,242,500, Beaver Close at an average of £880,000 and Salthill Road at an average of £671,801.
What streets have the most affordable properties for sale in Fishbourne?
The streets with the most affordable properties for sale in Fishbourne are Mosse Gardens at an average of £277,625, Senator Gardens at an average of £280,000 and Deeside Avenue at an average of £350,700.
Which train stations are available in or near Fishbourne?
Some of the train stations available in or near Fishbourne are Fishbourne, Bosham and Chichester.
Property Price Paid in Fishbourne by Year
The average sold property price by year was:
| Year | Average Sold Price | Price Change |
Sold Properties
|
|---|---|---|---|
| 2026 | £565,000 | 12% |
1 Property |
| 2025 | £496,860 | -20% |
25 Properties |
| 2024 | £597,866 | 33% |
32 Properties |
| 2023 | £398,700 | -14% |
30 Properties |
| 2022 | £452,662 | 12% |
37 Properties |
| 2021 | £397,062 | -12% |
48 Properties |
| 2020 | £445,153 | 14% |
39 Properties |
| 2019 | £382,388 | 9% |
36 Properties |
| 2018 | £348,954 | -10% |
43 Properties |
| 2017 | £385,581 | 9% |
48 Properties |
Property Price per Property Type in Fishbourne
Here you can find historic sold price data in order to help with your property search.
The average Property Paid Price for specific property types in the last three years are:
| Property Type | Average Sold Price | Sold Properties |
|---|---|---|
| Semi Detached House | £376,445.00 | 16 Semi Detached Houses |
| Detached House | £616,839.00 | 49 Detached Houses |
| Terraced House | £350,531.00 | 16 Terraced Houses |
| Flat | £317,500.00 | 7 Flats |
