
Houses for sale & to rent in PO19 3QJ, Bourne Close, Fishbourne, Chichester
House Prices in PO19 3QJ, Bourne Close, Fishbourne
Properties in PO19 3QJ have no sales history available within the last 3 years. PO19 3QJ is a postcode in Bourne Close located in Fishbourne, an area in Chichester, Surrey, with 13 households².
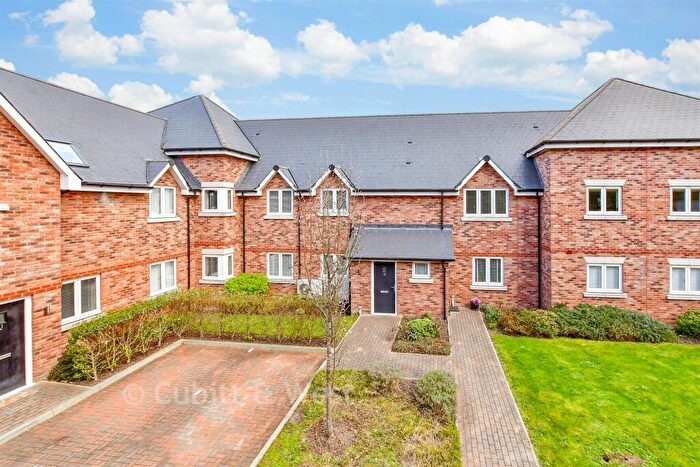
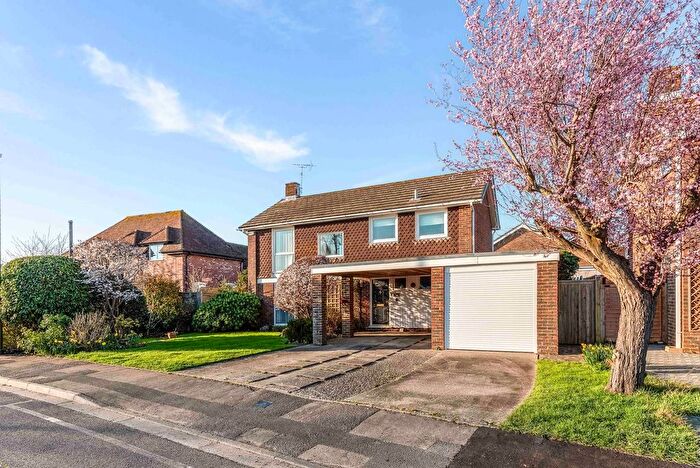
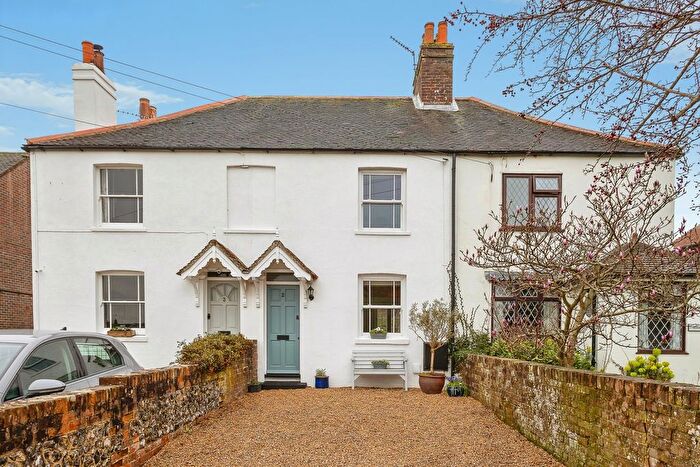
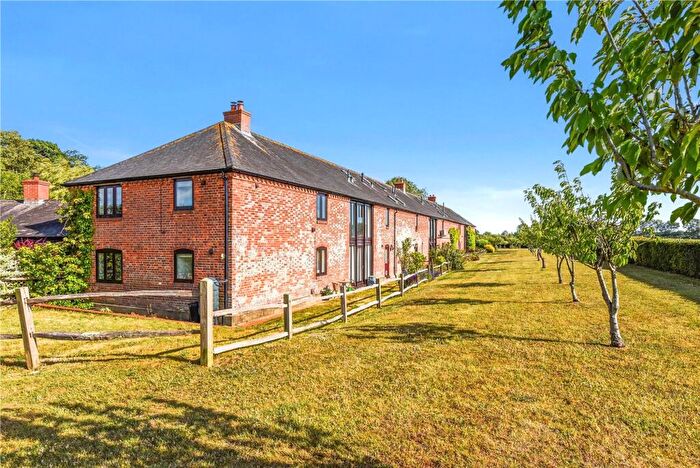
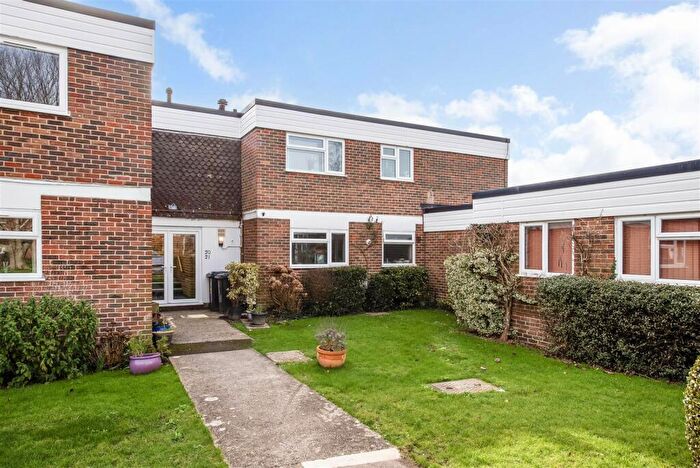
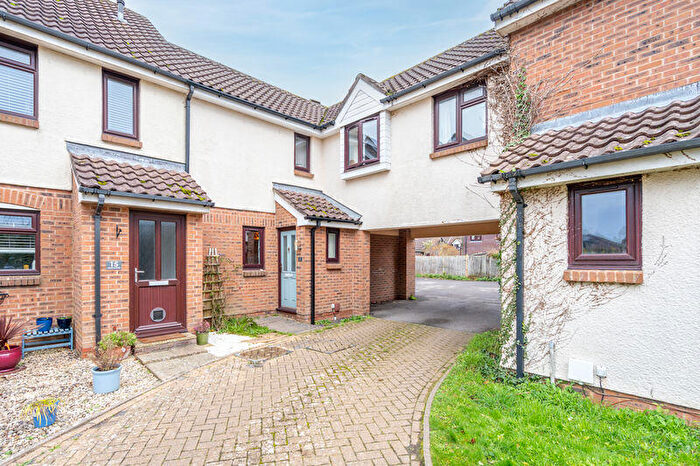
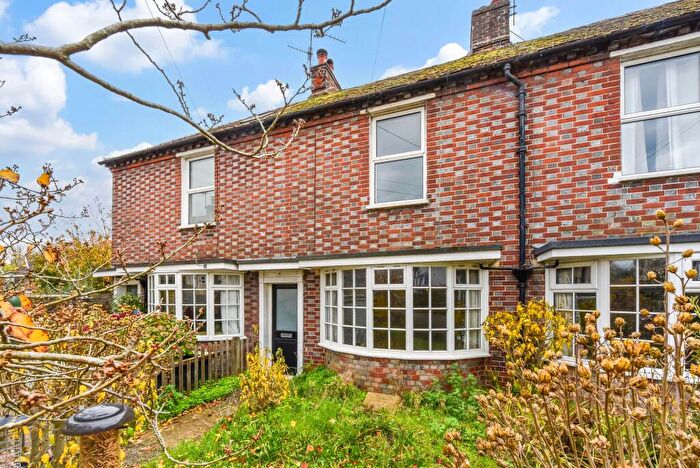
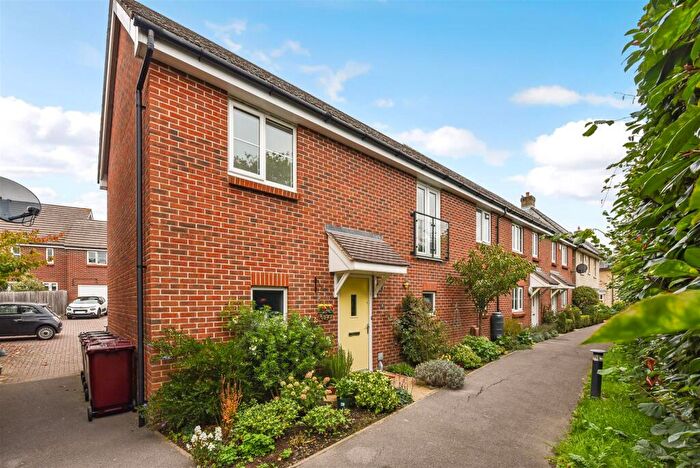
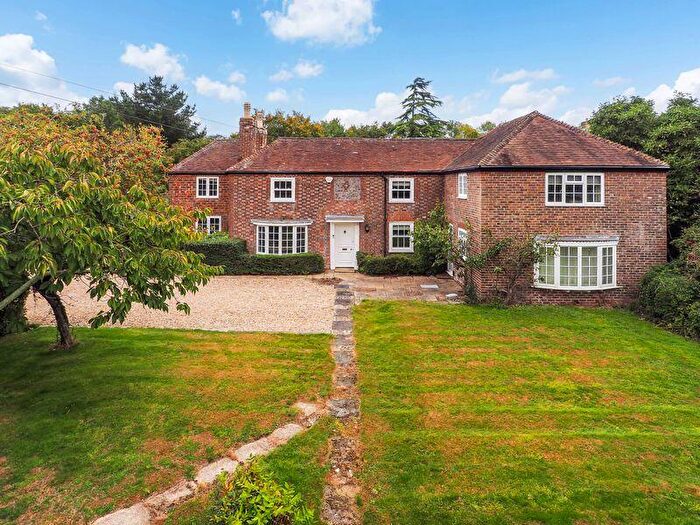
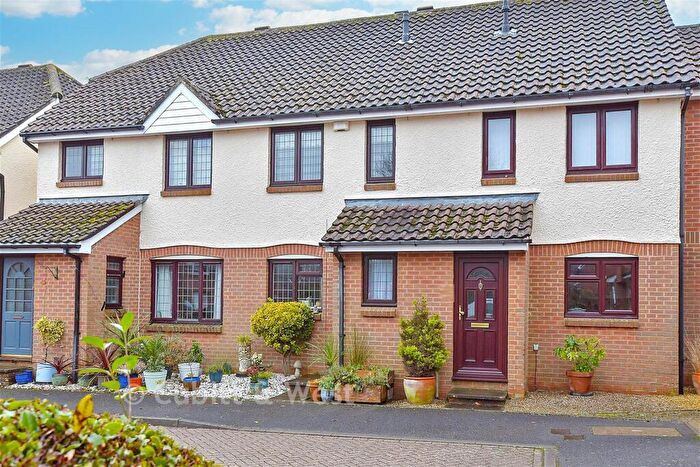
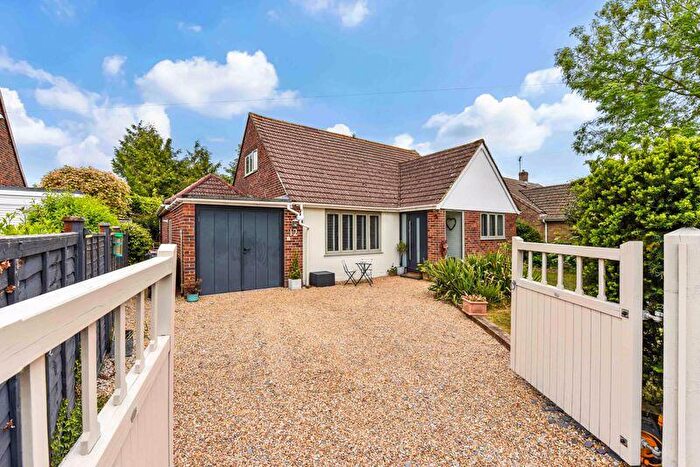
Properties for sale near PO19 3QJ, Bourne Close
![]()
If you are looking to sell your house, let it out, or receive a property valuation, an expert can help you.
Click the button below to get started.
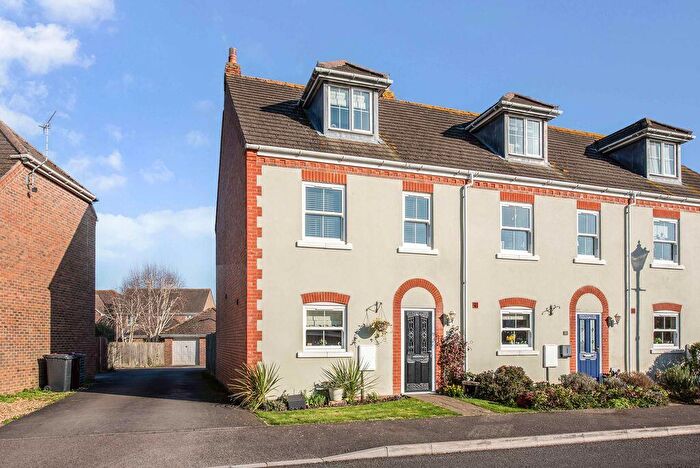
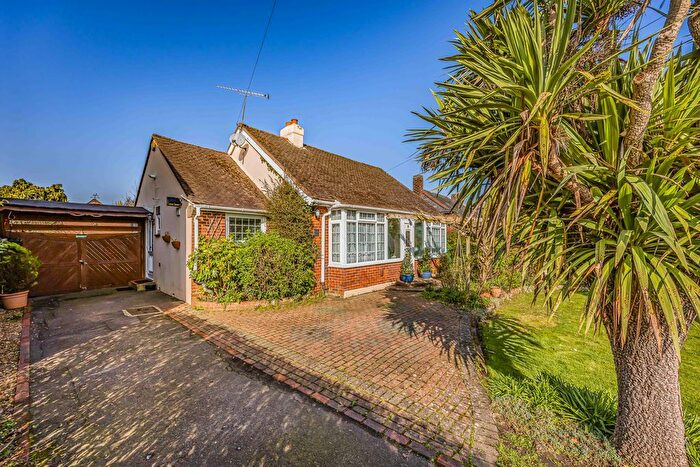
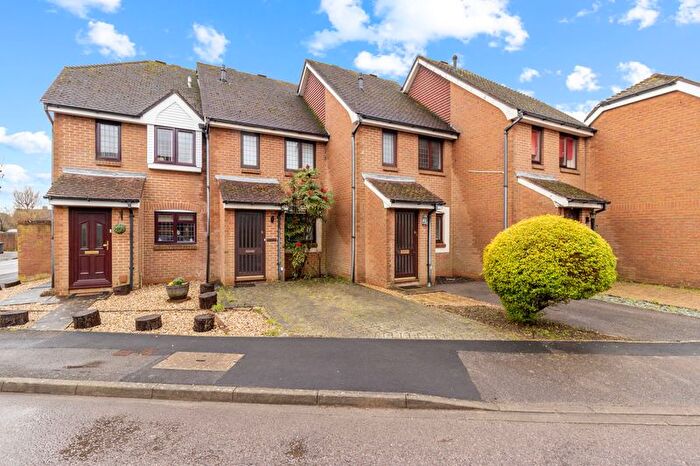
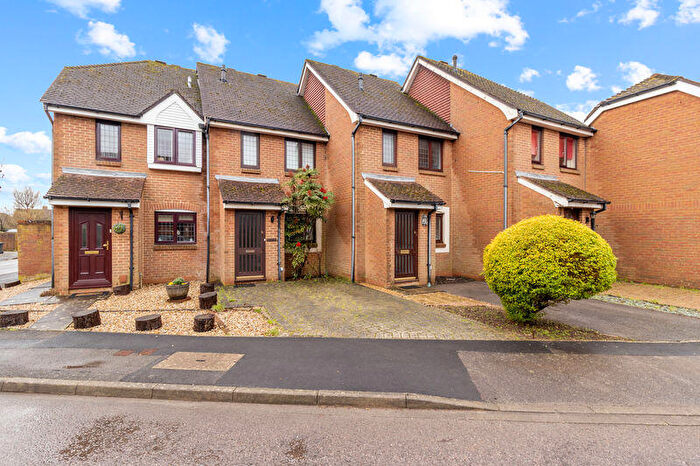
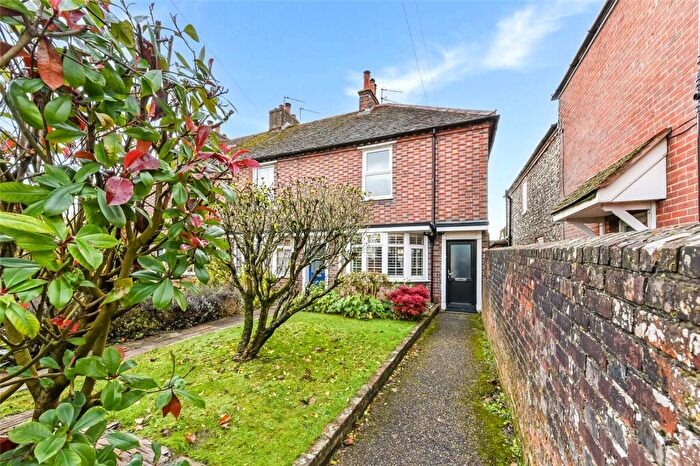
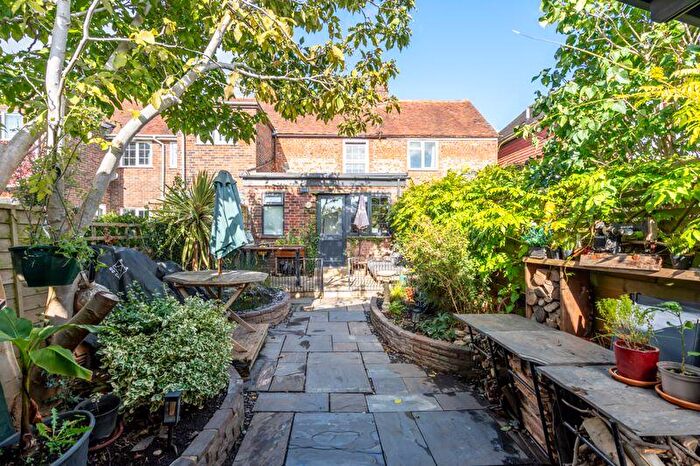
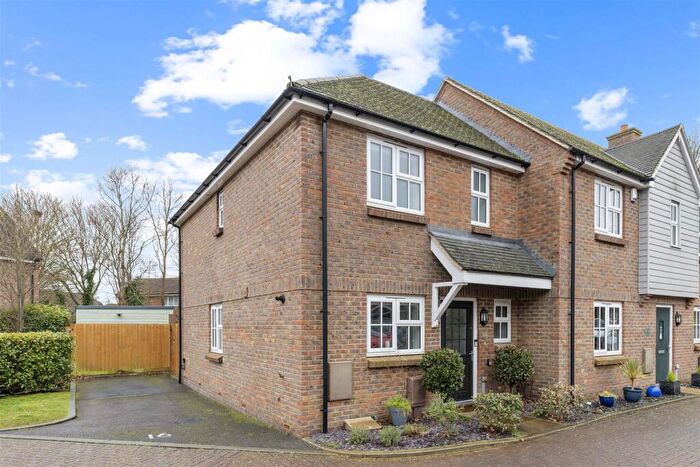
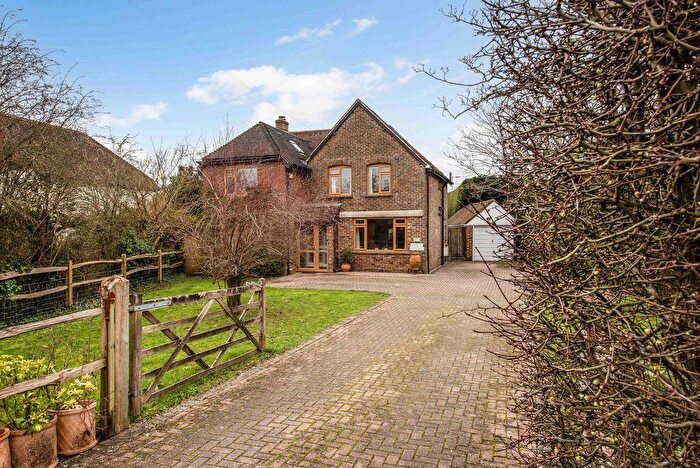
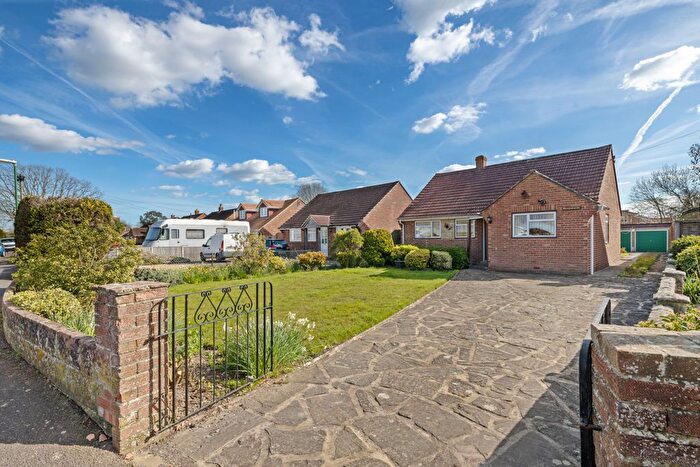
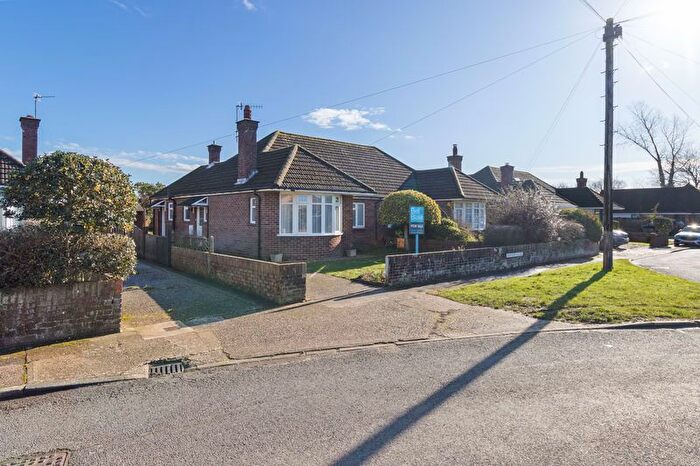
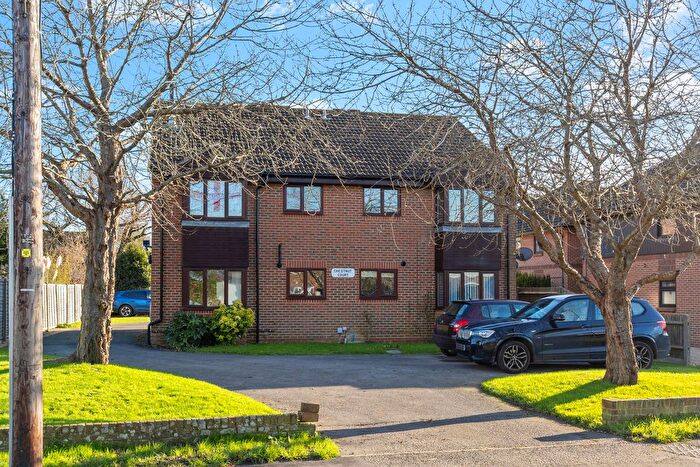
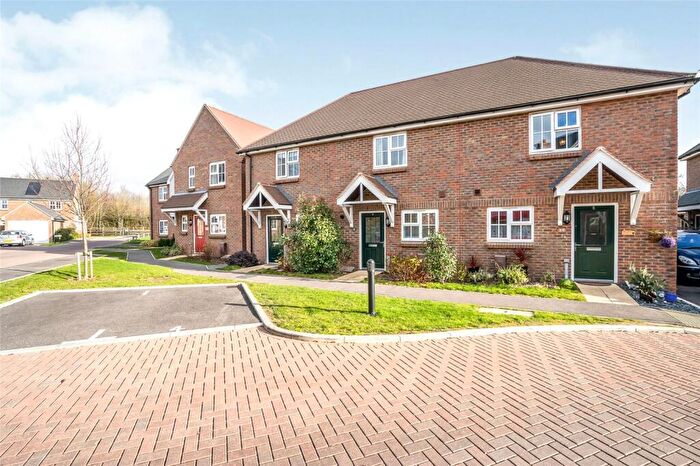
Previously listed properties near PO19 3QJ, Bourne Close
![]()
If you are looking to sell your house, let it out, or receive a property valuation, an expert can help you.
Click the button below to get started.
Price Paid in Bourne Close, PO19 3QJ, Fishbourne
12 Bourne Close, PO19 3QJ, Fishbourne Chichester
Property 12 has been sold 4 times. The last time it was sold was in 14/10/2016 and the sold price was £371,000.00.
This detached house, sold as a freehold on 14/10/2016, is a 83 sqm detached bungalow with an EPC rating of E.
| Date | Price | Property Type | Tenure | Classification |
|---|---|---|---|---|
| 14/10/2016 | £371,000.00 | Detached House | freehold | Established Building |
| 29/05/2014 | £304,000.00 | Detached House | freehold | Established Building |
| 20/12/2006 | £275,000.00 | Detached House | freehold | Established Building |
| 30/03/1998 | £82,700.00 | Detached House | freehold | Established Building |
8 Bourne Close, PO19 3QJ, Fishbourne Chichester
Property 8 has been sold 2 times. The last time it was sold was in 27/10/2015 and the sold price was £475,000.00.
This detached house, sold as a freehold on 27/10/2015, is a 69 sqm detached bungalow with an EPC rating of E.
| Date | Price | Property Type | Tenure | Classification |
|---|---|---|---|---|
| 27/10/2015 | £475,000.00 | Detached House | freehold | Established Building |
| 02/02/2012 | £272,500.00 | Detached House | freehold | Established Building |
3 Bourne Close, PO19 3QJ, Fishbourne Chichester
Property 3 has been sold 1 time. The last time it was sold was in 01/02/2012 and the sold price was £488,000.00.
This detached house, sold as a freehold on 01/02/2012, is a 116 sqm detached house with an EPC rating of E.
| Date | Price | Property Type | Tenure | Classification |
|---|---|---|---|---|
| 01/02/2012 | £488,000.00 | Detached House | freehold | Established Building |
9 Bourne Close, PO19 3QJ, Fishbourne Chichester
Property 9 has been sold 2 times. The last time it was sold was in 03/08/2004 and the sold price was £295,000.00.
This is a Detached House which was sold as a freehold in 03/08/2004
| Date | Price | Property Type | Tenure | Classification |
|---|---|---|---|---|
| 03/08/2004 | £295,000.00 | Detached House | freehold | Established Building |
| 16/04/1999 | £118,500.00 | Detached House | freehold | Established Building |
7 Bourne Close, PO19 3QJ, Fishbourne Chichester
Property 7 has been sold 1 time. The last time it was sold was in 01/06/2004 and the sold price was £220,000.00.
This detached house, sold as a freehold on 01/06/2004, is a 83 sqm detached bungalow with an EPC rating of C.
| Date | Price | Property Type | Tenure | Classification |
|---|---|---|---|---|
| 01/06/2004 | £220,000.00 | Detached House | freehold | Established Building |
14 Bourne Close, PO19 3QJ, Fishbourne Chichester
Property 14 has been sold 1 time. The last time it was sold was in 15/06/2000 and the sold price was £139,000.00.
This detached house, sold as a freehold on 15/06/2000, is a 111 sqm detached house with an EPC rating of E.
| Date | Price | Property Type | Tenure | Classification |
|---|---|---|---|---|
| 15/06/2000 | £139,000.00 | Detached House | freehold | Established Building |
10 Bourne Close, PO19 3QJ, Fishbourne Chichester
Property 10 has been sold 1 time. The last time it was sold was in 30/05/1997 and the sold price was £99,950.00.
This is a Detached House which was sold as a freehold in 30/05/1997
| Date | Price | Property Type | Tenure | Classification |
|---|---|---|---|---|
| 30/05/1997 | £99,950.00 | Detached House | freehold | Established Building |
Transport near PO19 3QJ, Bourne Close

House price paid reports for PO19 3QJ, Bourne Close
Click on the buttons below to see price paid reports by year or property price:
- Price Paid By Year
Property Price Paid in PO19 3QJ, Bourne Close by Year
The average sold property price by year was:
| Year | Average Sold Price | Price Change |
Sold Properties
|
|---|---|---|---|
| 2016 | £371,000 | -28% |
1 Property |
| 2015 | £475,000 | 36% |
1 Property |
| 2014 | £304,000 | -25% |
1 Property |
| 2012 | £380,250 | 28% |
2 Properties |
| 2006 | £275,000 | 6% |
1 Property |
| 2004 | £257,500 | 46% |
2 Properties |
| 2000 | £139,000 | 15% |
1 Property |
| 1999 | £118,500 | 30% |
1 Property |
| 1998 | £82,700 | -21% |
1 Property |
| 1997 | £99,950 | - |
1 Property |