
Houses for sale & to rent in PO20 1LQ, Marsh Lane, North Mundham, Chichester
House Prices in PO20 1LQ, Marsh Lane, North Mundham
Properties in PO20 1LQ have no sales history available within the last 3 years. PO20 1LQ is a postcode in Marsh Lane located in North Mundham, an area in Chichester, Surrey, with 3 households².
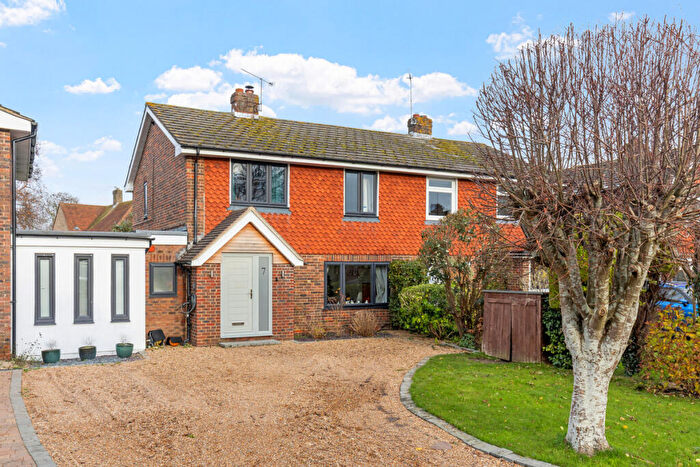
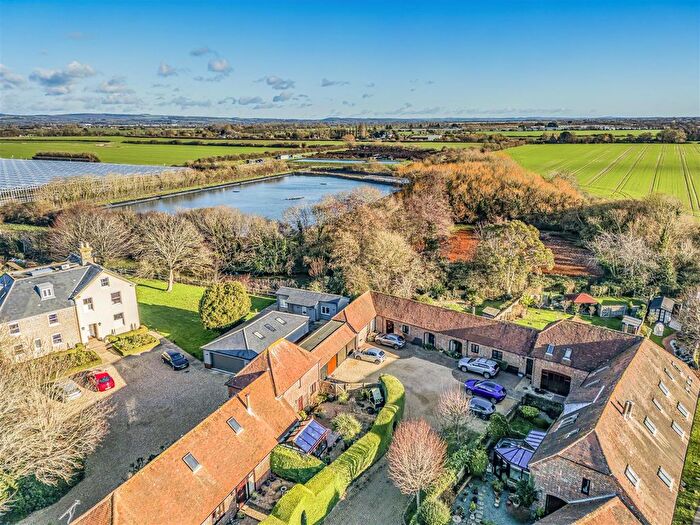
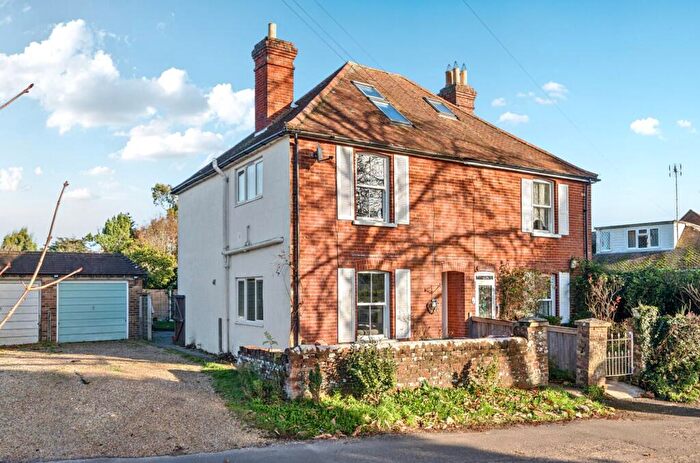
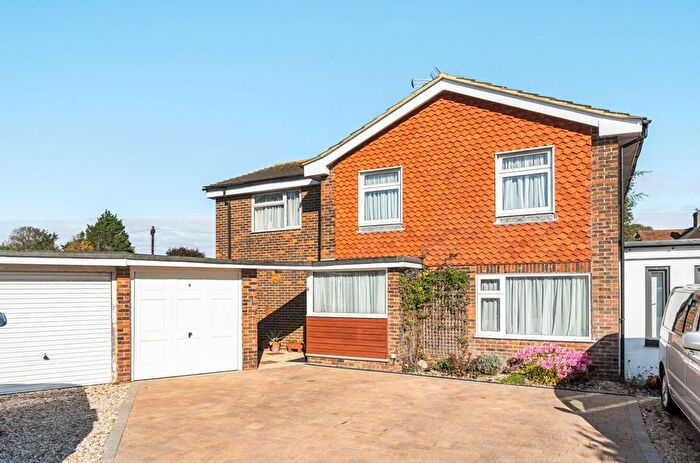
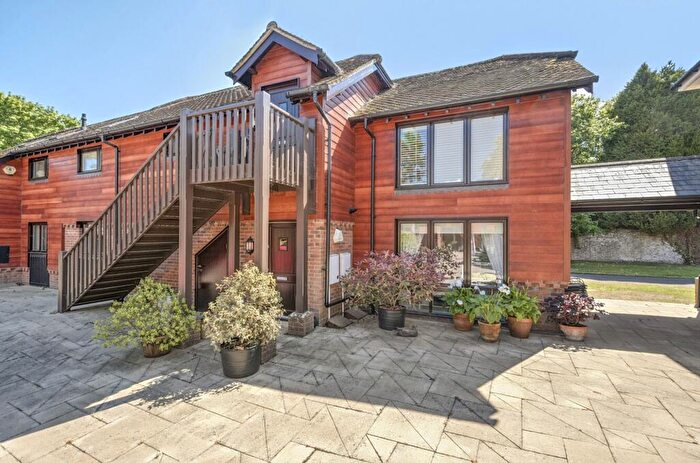
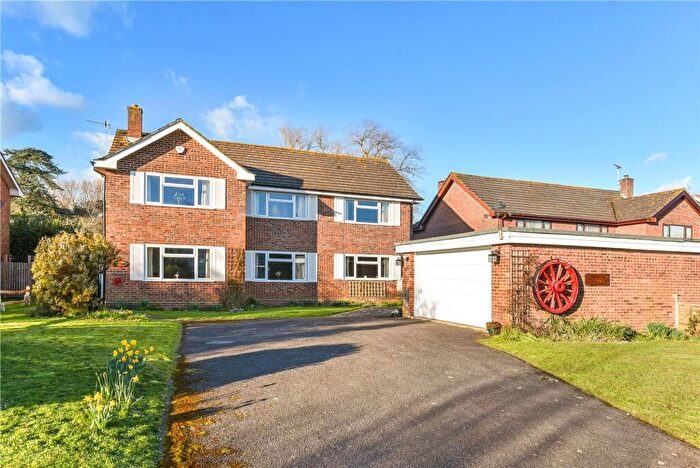
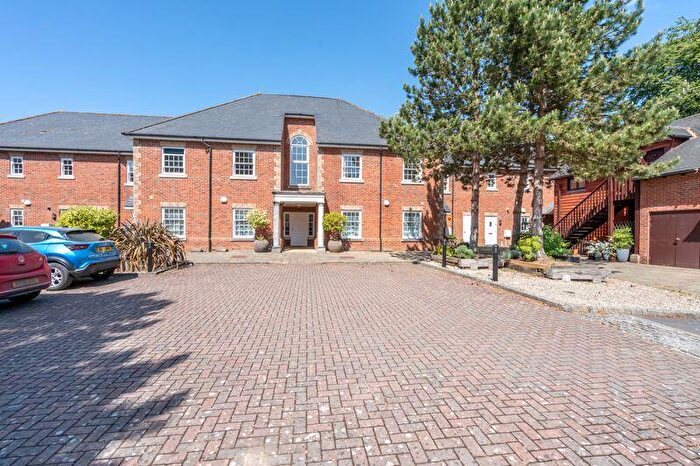
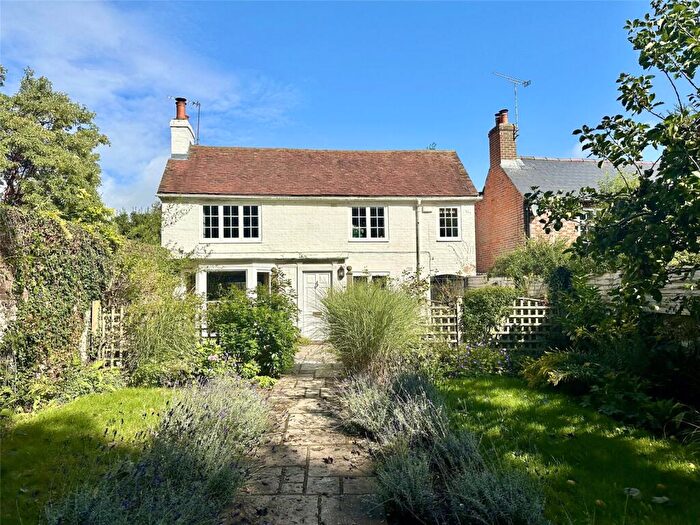
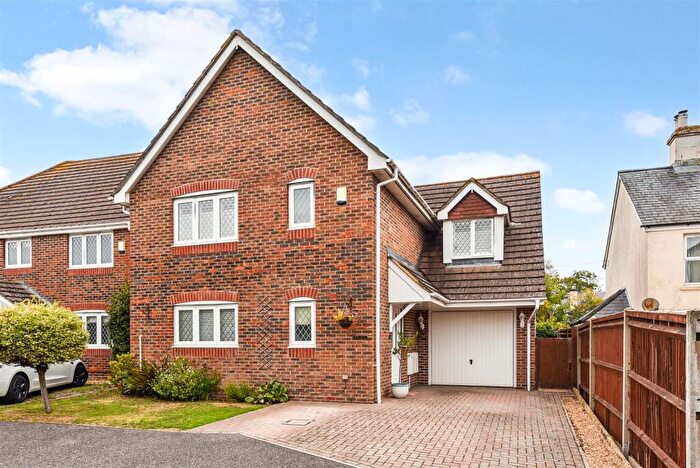
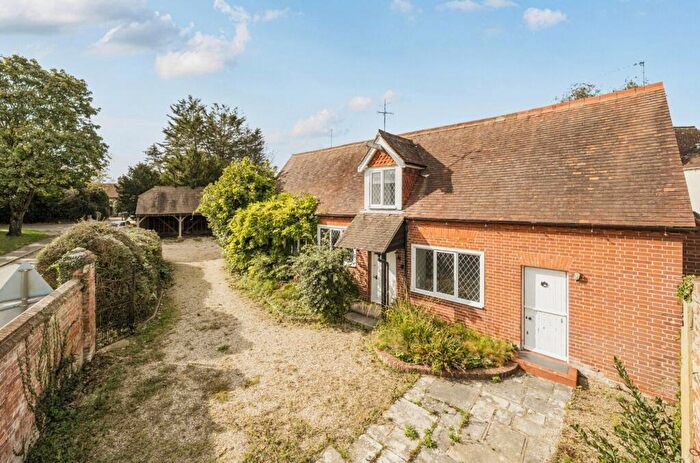
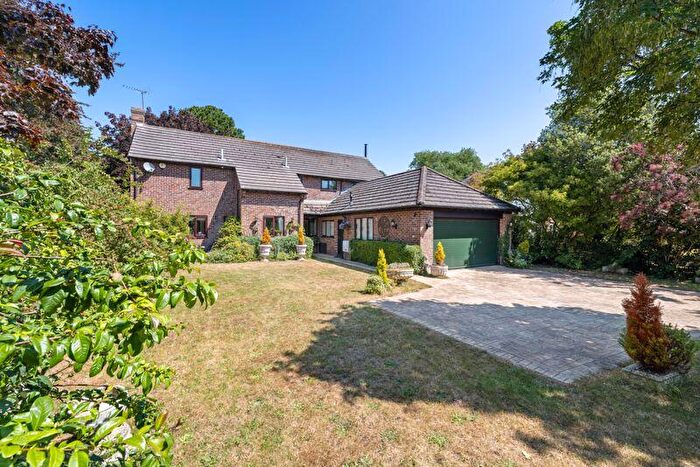
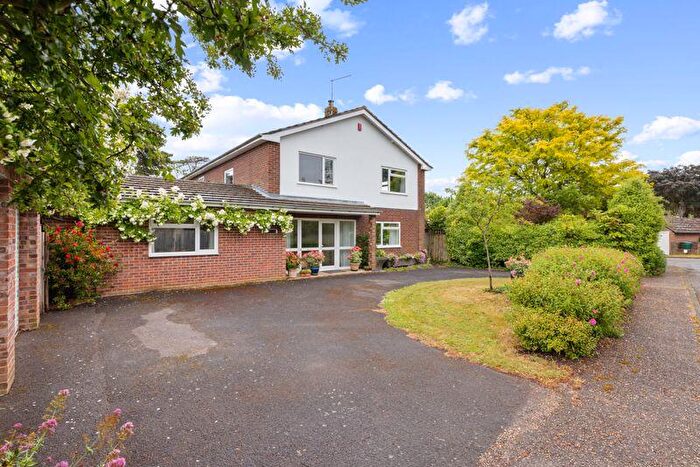
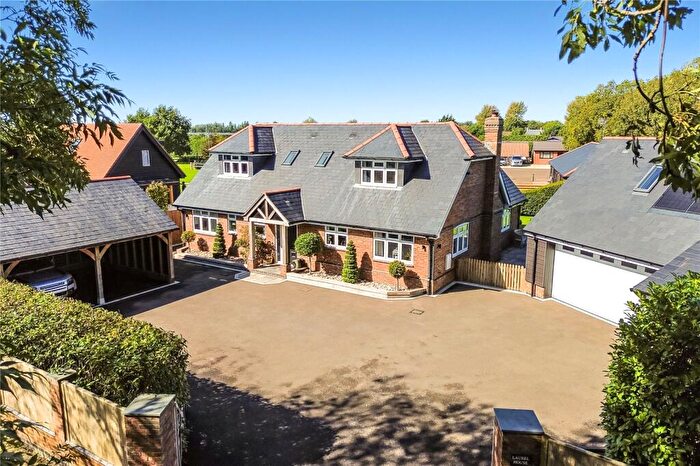
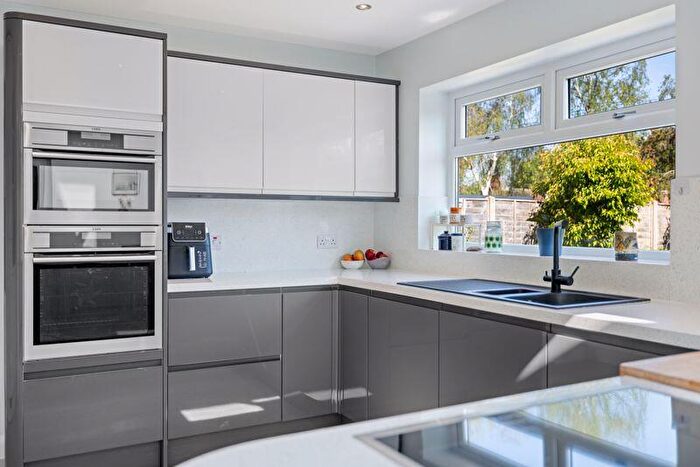
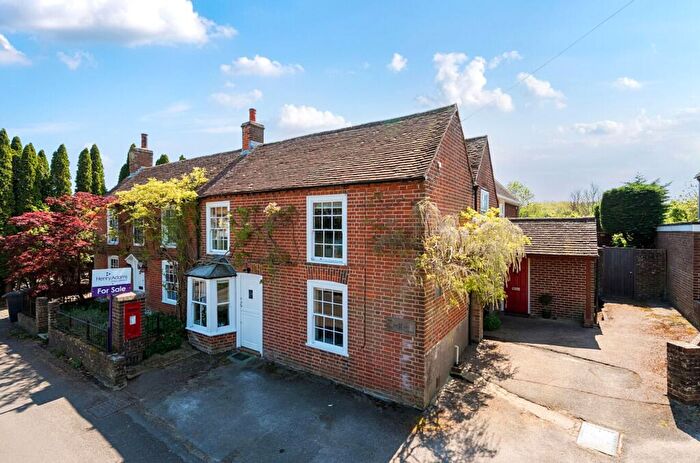
Properties for sale near PO20 1LQ, Marsh Lane

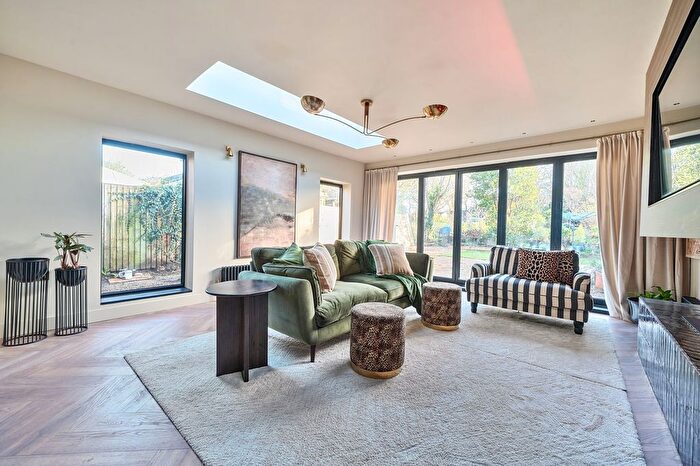
![]()
If you are looking to sell your house, let it out, or receive a property valuation, an expert can help you.
Click the button below to get started.


Price Paid in Marsh Lane, PO20 1LQ, North Mundham
THE CHASE Marsh Lane, PO20 1LQ, North Mundham Chichester
Property THE CHASE has been sold 1 time. The last time it was sold was in 17/06/2021 and the sold price was £570,000.00.
This detached house, sold as a freehold on 17/06/2021, is a 130 sqm detached bungalow with an EPC rating of D.
| Date | Price | Property Type | Tenure | Classification |
|---|---|---|---|---|
| 17/06/2021 | £570,000.00 | Detached House | freehold | Established Building |
SPRINGFIELD Marsh Lane, PO20 1LQ, North Mundham Chichester
Property SPRINGFIELD has been sold 2 times. The last time it was sold was in 17/12/2018 and the sold price was £970,000.00.
This detached house, sold as a freehold on 17/12/2018, is a 266 sqm detached house with an EPC rating of D.
| Date | Price | Property Type | Tenure | Classification |
|---|---|---|---|---|
| 17/12/2018 | £970,000.00 | Detached House | freehold | Established Building |
| 07/12/2012 | £620,000.00 | Detached House | freehold | Established Building |
MARSH FARM HOUSE Marsh Lane, PO20 1LQ, North Mundham Chichester
Property MARSH FARM HOUSE has been sold 1 time. The last time it was sold was in 22/07/2004 and the sold price was £740,000.00.
This is a Detached House which was sold as a freehold in 22/07/2004
| Date | Price | Property Type | Tenure | Classification |
|---|---|---|---|---|
| 22/07/2004 | £740,000.00 | Detached House | freehold | Established Building |
Transport near PO20 1LQ, Marsh Lane

House price paid reports for PO20 1LQ, Marsh Lane
Click on the buttons below to see price paid reports by year or property price:
- Price Paid By Year
Property Price Paid in PO20 1LQ, Marsh Lane by Year
The average sold property price by year was:
| Year | Average Sold Price | Price Change |
Sold Properties
|
|---|---|---|---|
| 2021 | £570,000 | -70% |
1 Property |
| 2018 | £970,000 | 36% |
1 Property |
| 2012 | £620,000 | -19% |
1 Property |
| 2004 | £740,000 | - |
1 Property |