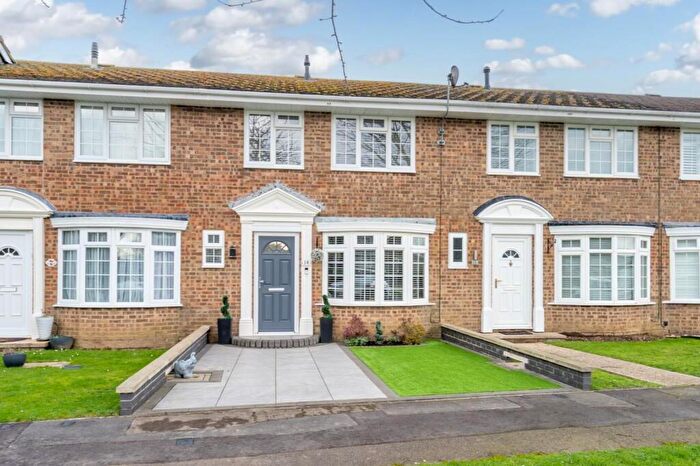
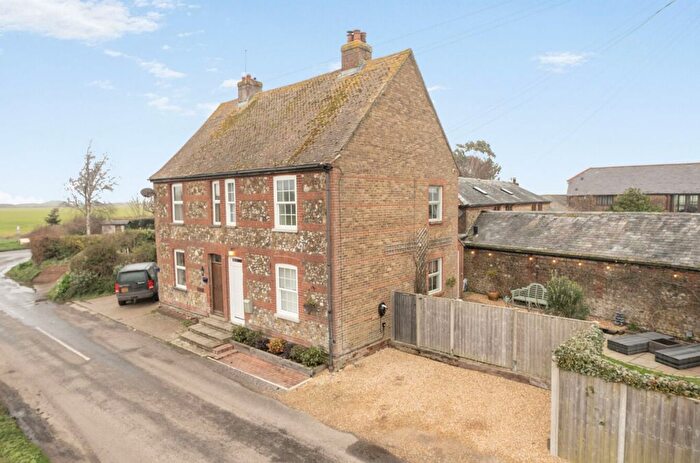
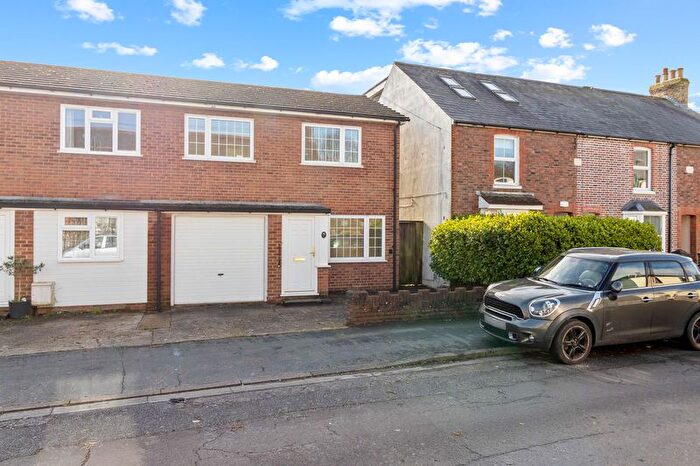
Houses for sale & to rent in North Mundham, Chichester
House Prices in North Mundham
Properties in North Mundham have an average house price of £518,079.00 and had 58 Property Transactions within the last 3 years¹.
North Mundham is an area in Chichester, Surrey with 783 households², where the most expensive property was sold for £1,400,000.00.
Properties for sale in North Mundham
Roads and Postcodes in North Mundham
Navigate through our locations to find the location of your next house in North Mundham, Chichester for sale or to rent.
| Streets | Postcodes |
|---|---|
| Bognor Road | PO20 1EG PO20 1EH |
| Bowley Lane | PO20 1NB |
| Briar Close | PO20 2BY |
| Bridge Cottages | PO20 2DT |
| Brookside | PO20 1PX PO20 1PZ |
| Brookside Close | PO20 1PY |
| Church Lane | PO20 2BT PO20 2DE PO20 2DG |
| Church Mews | PO20 1JH |
| Church Road | PO20 1JG PO20 1JU |
| Coach Road | PO20 2BG |
| Decoy Lane | PO20 3TR |
| Drewitts Mews | PO20 2AZ |
| Elm Close | PO20 1JS |
| Elm Grove | PO20 1PW |
| Fisher Lane | PO20 1ND |
| Fletcher Close | PO20 1JP |
| Fletcher Place | PO20 1JR |
| Goodwood Gardens | PO20 1SP |
| Green Lane | PO20 1EQ PO20 1LH |
| Gribble Lane | PO20 2AE PO20 2BS |
| Hermitage Close | PO20 1JZ |
| High Street | PO20 2DD PO20 2DQ |
| Highfield Lane | PO20 2AB PO20 2DL PO20 2NN |
| Honer Lane | PO20 1LY |
| Hop Garden Lane | PO20 1JX |
| Lagness Road | PO20 1LD PO20 1LJ PO20 1QA |
| Manor Cottages | PO20 1EE |
| Marsh Barns | PO20 1LG |
| Marsh Lane | PO20 1LQ |
| Mill Lane | PO20 1AA PO20 1PN PO20 1PP |
| Oving Road | PO20 2AG |
| Palmer Place | PO20 1JW |
| Peckhams Copse Lane | PO20 1LB |
| Post Office Lane | PO20 1JY |
| Punches Lane | PO20 1NA |
| Redbrick Cottage | PO20 2DR |
| Ruffs Cottages | PO20 2DP |
| Runcton Lane | PO20 1AD PO20 1PS PO20 1PT |
| Saltham Lane | PO20 1PU |
| Sampsons Drive | PO20 2AY |
| School Lane | PO20 1LA |
| Shopwhyke Road | PO20 2AA |
| Slate Cottages | PO20 1LX |
| St Andrews Close | PO20 2DN |
| Tangmere Road | PO20 2BL PO20 2EU |
| The Hermitage | PO20 1LE |
| Vinnetrow Road | PO20 1QB PO20 1QH |
| Whitaker Place | PO20 2AF |
| Willowmead Close | PO20 1NH |
| Woodhorn Lane | PO20 2BU PO20 2BX |
| PO20 1DY PO20 1ED PO20 1EF PO20 1LU PO20 2BP PO20 2DS PO20 2DU PO20 2DW PO20 2FH PO20 2GL |
Transport near North Mundham
- FAQ
- Price Paid By Year
- Property Type Price
Frequently asked questions about North Mundham
What is the average price for a property for sale in North Mundham?
The average price for a property for sale in North Mundham is £518,079. This amount is 7% higher than the average price in Chichester. There are 4,505 property listings for sale in North Mundham.
What streets have the most expensive properties for sale in North Mundham?
The streets with the most expensive properties for sale in North Mundham are Church Lane at an average of £785,000, Slate Cottages at an average of £715,000 and Post Office Lane at an average of £696,000.
What streets have the most affordable properties for sale in North Mundham?
The streets with the most affordable properties for sale in North Mundham are Gribble Lane at an average of £215,000, Oving Road at an average of £266,000 and Highfield Lane at an average of £292,500.
Which train stations are available in or near North Mundham?
Some of the train stations available in or near North Mundham are Chichester, Fishbourne and Bognor Regis.
Property Price Paid in North Mundham by Year
The average sold property price by year was:
| Year | Average Sold Price | Price Change |
Sold Properties
|
|---|---|---|---|
| 2025 | £440,960 | -43% |
25 Properties |
| 2024 | £630,596 | 17% |
16 Properties |
| 2023 | £525,591 | -1% |
17 Properties |
| 2022 | £531,044 | 11% |
24 Properties |
| 2021 | £474,395 | 5% |
33 Properties |
| 2020 | £449,636 | -16% |
22 Properties |
| 2019 | £521,886 | 5% |
22 Properties |
| 2018 | £493,634 | 1% |
26 Properties |
| 2017 | £486,263 | 6% |
19 Properties |
| 2016 | £456,715 | 6% |
29 Properties |
| 2015 | £429,726 | -10% |
21 Properties |
| 2014 | £472,623 | 14% |
28 Properties |
| 2013 | £405,105 | 16% |
19 Properties |
| 2012 | £339,840 | -9% |
22 Properties |
| 2011 | £371,101 | -10% |
24 Properties |
| 2010 | £409,037 | -11% |
27 Properties |
| 2009 | £454,875 | 24% |
20 Properties |
| 2008 | £347,671 | -1% |
22 Properties |
| 2007 | £350,912 | 13% |
47 Properties |
| 2006 | £305,725 | 28% |
35 Properties |
| 2005 | £221,507 | -45% |
49 Properties |
| 2004 | £320,978 | 13% |
49 Properties |
| 2003 | £278,558 | 24% |
41 Properties |
| 2002 | £211,109 | 6% |
47 Properties |
| 2001 | £199,094 | 10% |
40 Properties |
| 2000 | £178,592 | 10% |
36 Properties |
| 1999 | £160,562 | 1% |
29 Properties |
| 1998 | £159,369 | 8% |
46 Properties |
| 1997 | £145,826 | 16% |
47 Properties |
| 1996 | £122,379 | -15% |
34 Properties |
| 1995 | £140,305 | - |
30 Properties |
Property Price per Property Type in North Mundham
Here you can find historic sold price data in order to help with your property search.
The average Property Paid Price for specific property types in the last three years are:
| Property Type | Average Sold Price | Sold Properties |
|---|---|---|
| Semi Detached House | £493,225.00 | 20 Semi Detached Houses |
| Detached House | £664,277.00 | 22 Detached Houses |
| Terraced House | £383,166.00 | 12 Terraced Houses |
| Flat | £243,000.00 | 4 Flats |

