Houses for sale & to rent in Selsey South, Chichester
House Prices in Selsey South
Properties in Selsey South have an average house price of £386,672.00 and had 225 Property Transactions within the last 3 years¹.
Selsey South is an area in Chichester, Surrey with 1,922 households², where the most expensive property was sold for £1,500,000.00.
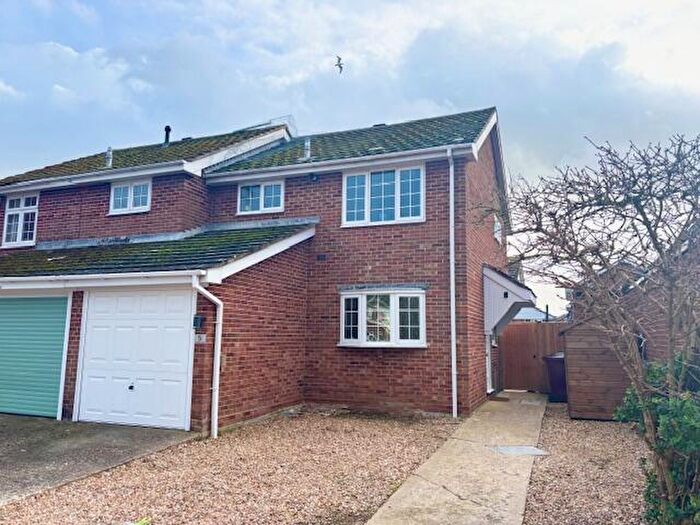
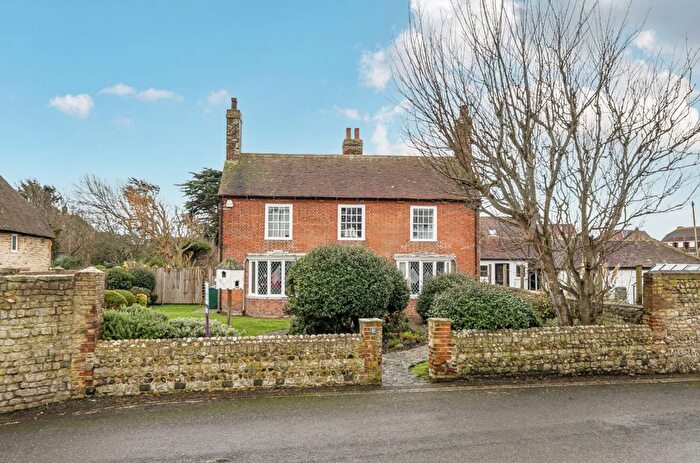
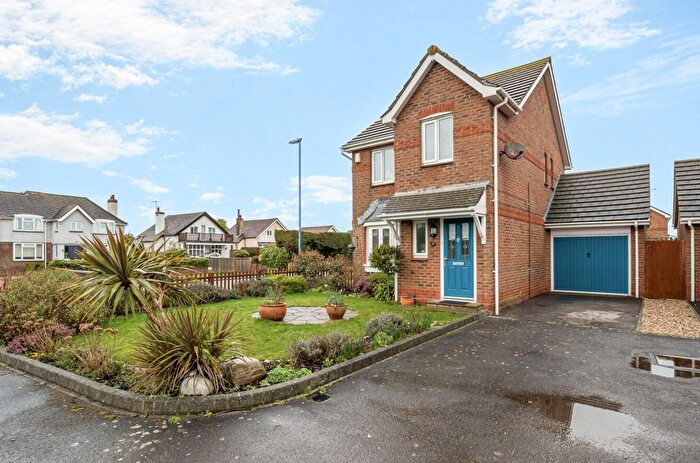
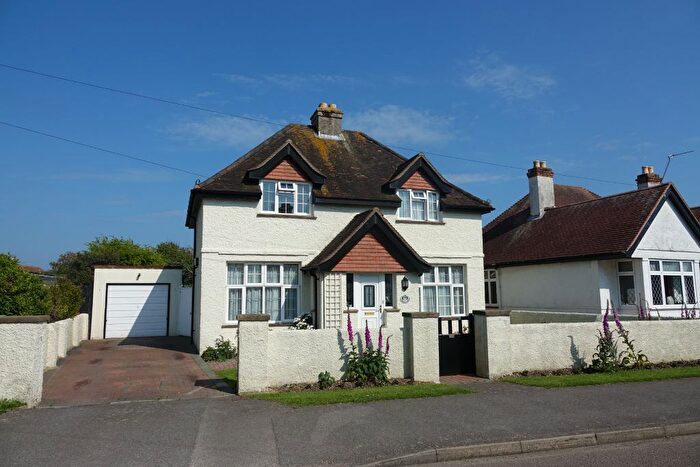
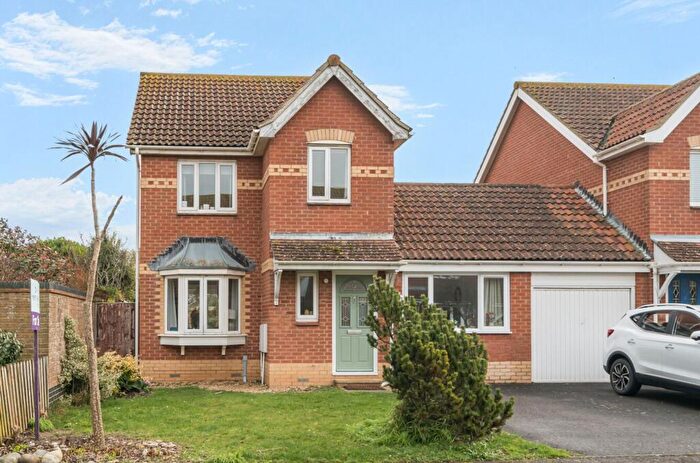
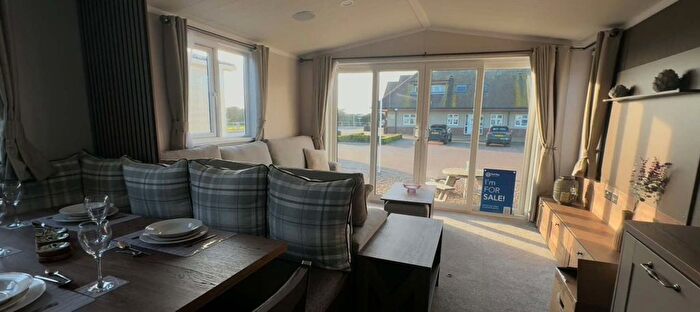
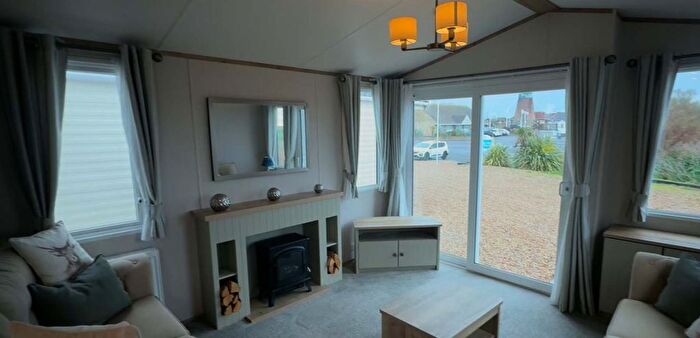
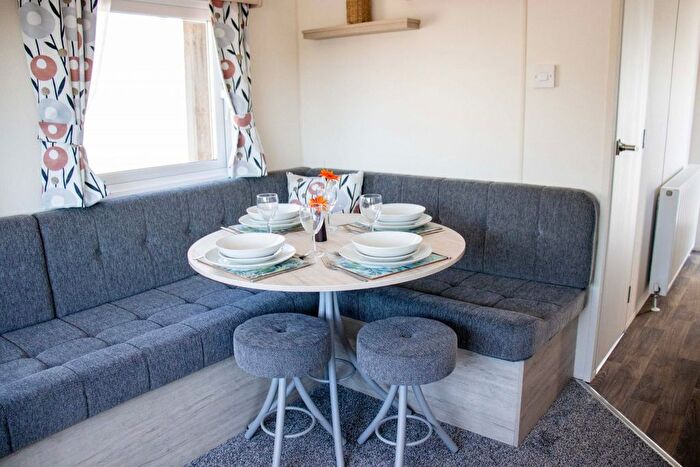
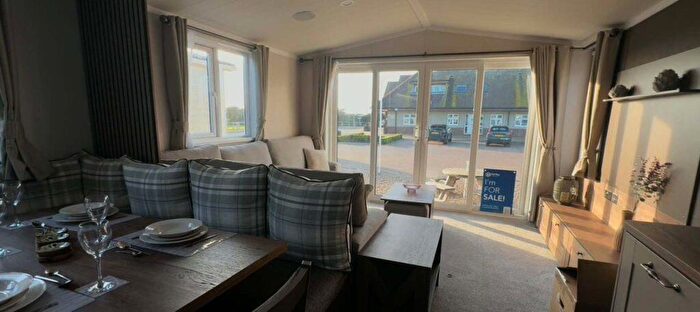
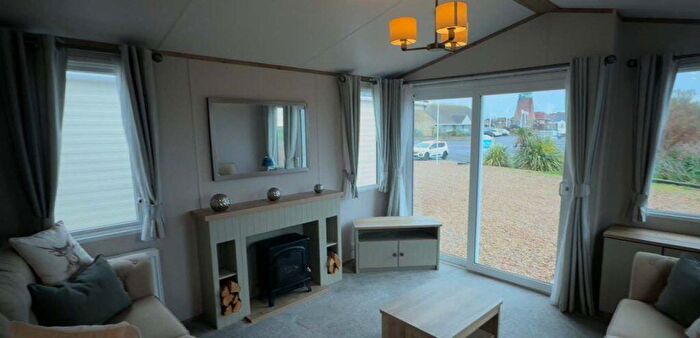
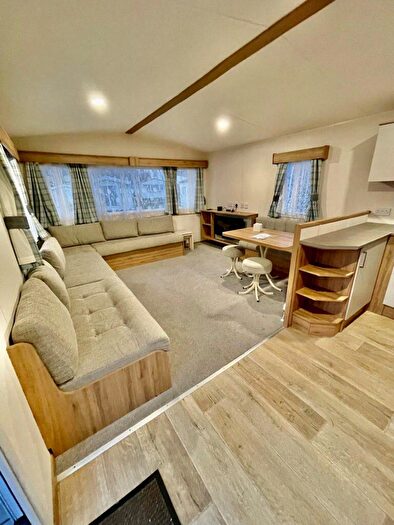
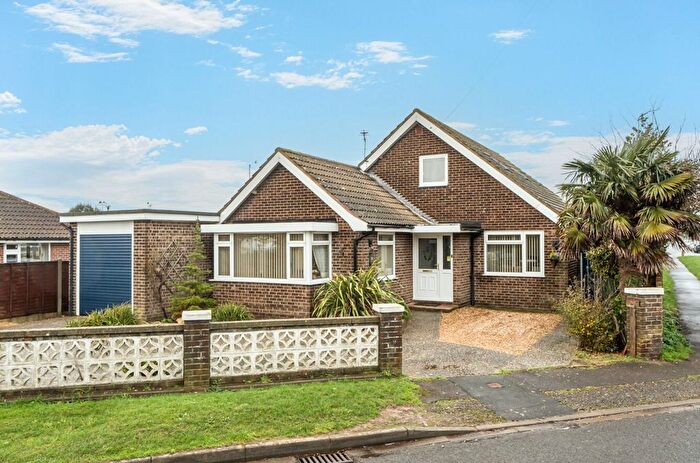
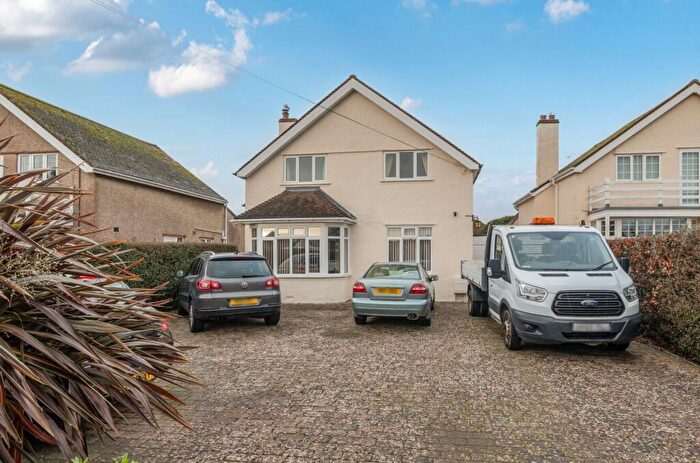
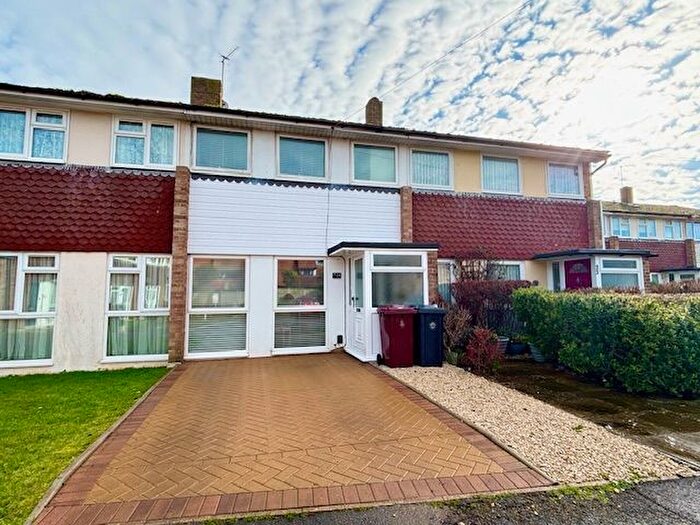
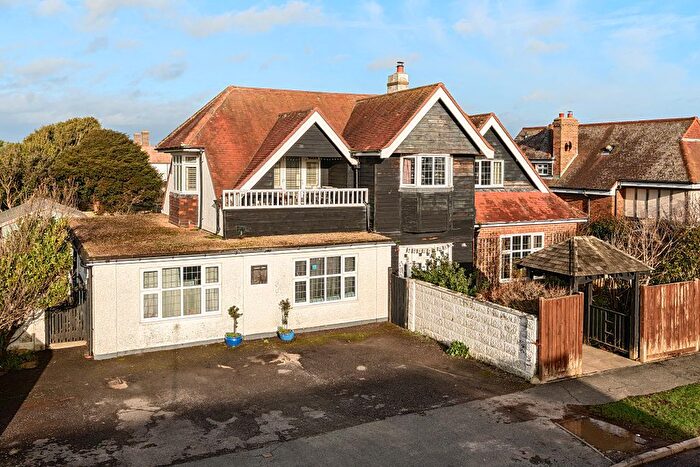
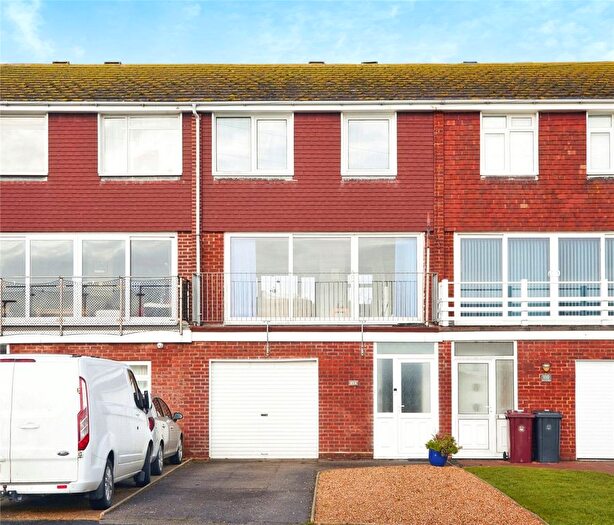
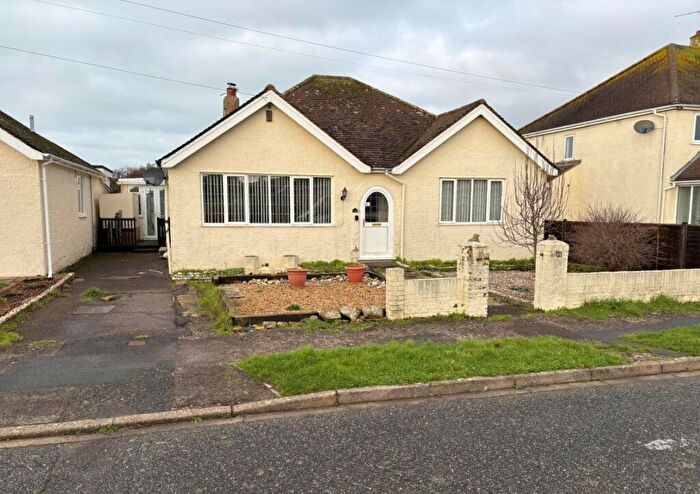
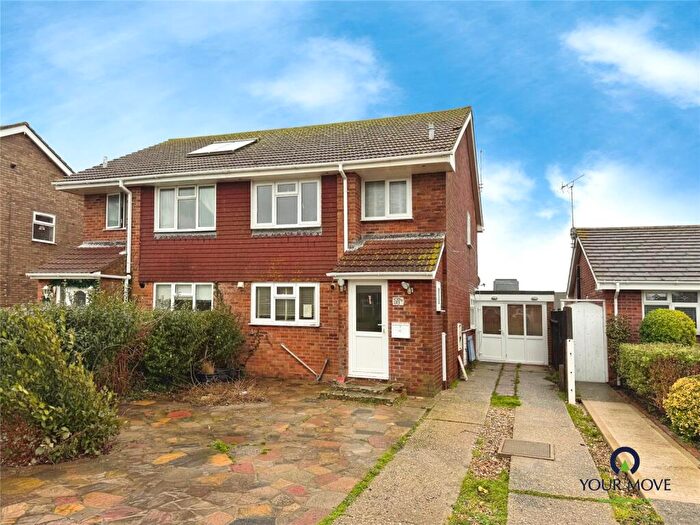
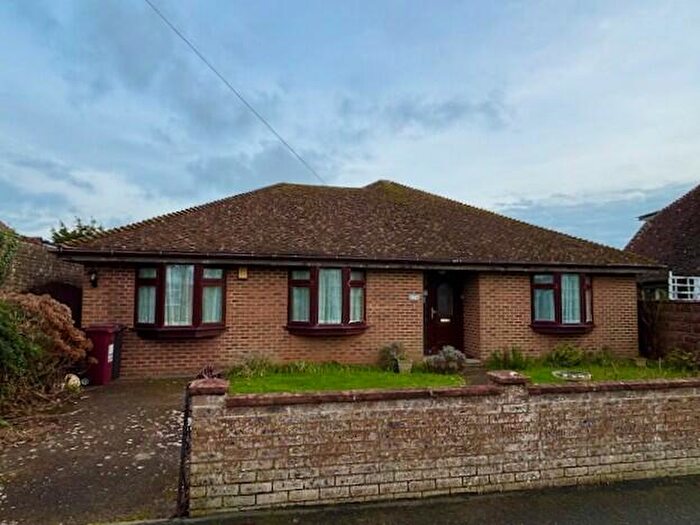
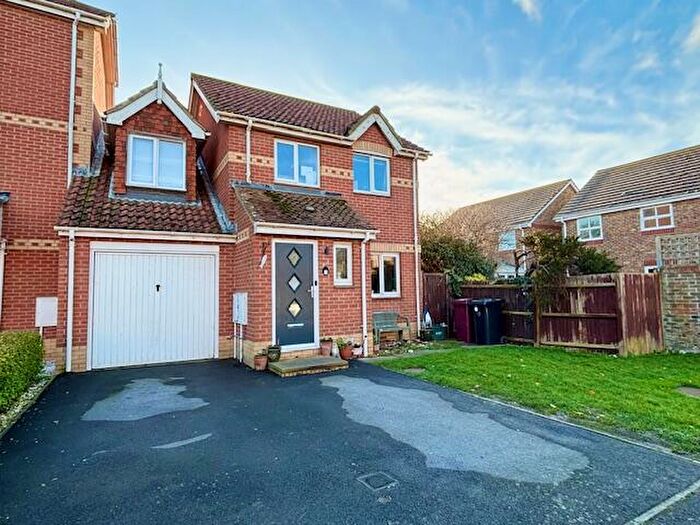
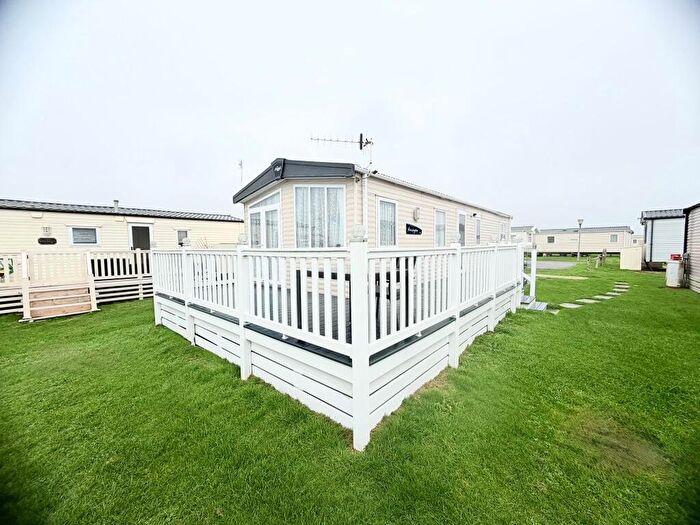
Properties for sale in Selsey South
Roads and Postcodes in Selsey South
Navigate through our locations to find the location of your next house in Selsey South, Chichester for sale or to rent.
| Streets | Postcodes |
|---|---|
| Albion Road | PO20 0DH PO20 0DJ |
| Arnell Avenue | PO20 0BY |
| Barnes Close | PO20 0UG |
| Beach Gardens | PO20 0HX |
| Beacon Drive | PO20 0TW |
| Beaufield Close | PO20 0BB |
| Bonnar Close | PO20 9AS |
| Bonnar Road | PO20 9AP PO20 9AT PO20 9AU |
| Brampton Close | PO20 0PX |
| Byways | PO20 0HY |
| Canadian Crescent | PO20 0UQ |
| Chayle Gardens | PO20 0JD |
| Cherry Gardens | PO20 0AR |
| Clayton Road | PO20 9DB PO20 9DF PO20 9DG PO20 9HJ |
| Cotland Road | PO20 0DQ |
| Coxes Road | PO20 9AN PO20 9AW |
| Coxswain Way | PO20 0UA |
| Croft Road | PO20 0RL |
| Dairy Mews | PO20 0FS |
| Danefield Road | PO20 9DA |
| Domehouse Close | PO20 0UB |
| East Street | PO20 0AT PO20 0BE PO20 0BH PO20 0BJ PO20 0BL PO20 0BN PO20 0BS PO20 0BT PO20 0BU PO20 0BX PO20 0DA PO20 0ED |
| Elm Grove | PO20 0RP |
| Grafton Road | PO20 0JA PO20 0JB PO20 0JE PO20 0JH PO20 0JJ PO20 0JL |
| Grant Close | PO20 0RU |
| Green Lane | PO20 0AG PO20 0AJ PO20 0AQ |
| Green Lawns Caravan Park Road | PO20 0ND |
| Grove Road | PO20 0AS |
| Hersee Way | PO20 9AF |
| High Street | PO20 0PT PO20 0PZ PO20 0QB PO20 0QE PO20 0QG PO20 0QY PO20 0LP PO20 0QH PO20 0QL PO20 0QQ PO20 0QW PO20 0RE |
| Hillfield Road | PO20 0FP PO20 0JS PO20 0JX PO20 0LB PO20 0LD PO20 0LF PO20 0LH |
| James Street | PO20 0JG PO20 0JQ PO20 0JF |
| Jones Square | PO20 0TU |
| Landerry Industrial Estate | PO20 9ER |
| Langton Close | PO20 0JZ |
| Latham Road | PO20 0JY PO20 0JU |
| Lawrence Close | PO20 0TN |
| Lewis Road | PO20 0QZ PO20 0RG PO20 0RH PO20 0RQ PO20 0RR |
| Lifeboat Way | PO20 0TT PO20 0TX |
| Longacre | PO20 0AD |
| Longacre Lane | PO20 0BA |
| Malden Way | PO20 0RW |
| Marine Gardens | PO20 0LJ |
| Meadowland | PO20 0LA |
| Mill Lane | PO20 9BH |
| Mixon Close | PO20 0TZ |
| Montalan Crescent | PO20 9BF |
| Murray Road | PO20 9AR |
| Netherton Close | PO20 0BP |
| New Parade | PO20 0QA |
| North Road | PO20 0BW |
| Orchard Avenue | PO20 0AW |
| Otard Close | PO20 0DD |
| Oval Lane | PO20 0JN |
| Pacific Way | PO20 0TY |
| Paddock Lane | PO20 9EJ |
| Peachey Road | PO20 0LG |
| Pennycord Close | PO20 0UF |
| School Lane | PO20 9EH |
| Sea Grove | PO20 9HT |
| Seal Road | PO20 0HU PO20 0HW |
| Seal Square | PO20 0HP |
| Solent Way | PO20 0JR |
| Southern Road | PO20 0BD |
| Sparshott Road | PO20 0UE |
| St Hildas Close | PO20 0AP |
| St Itha Close | PO20 0AB |
| St Itha Road | PO20 0AA PO20 0AH |
| St Wilfreds View | PO20 9BU |
| Sunnymead Close | PO20 0DB |
| Sunnymead Drive | PO20 0DF PO20 0DG |
| The Bridgeway | PO20 0LQ |
| The Bridleway | PO20 0RJ PO20 0RS |
| The Forge | PO20 9BP |
| Thorney Drive | PO20 9AQ |
| Tythe Barn Road | PO20 0AZ |
| Ursula Avenue | PO20 0HT |
| Ursula Avenue North | PO20 0RT |
| Ursula Square | PO20 0HR PO20 0HS |
| Vincent Road | PO20 9DH PO20 9DJ PO20 9DQ PO20 9DW |
| Wade End | PO20 9HR |
| Warner Road | PO20 9AL PO20 9DD PO20 9DE |
| West Street | PO20 9AA PO20 9AB PO20 9AD PO20 9AE PO20 9AG PO20 9AH |
| Westcroft | PO20 9HD |
| Western Road | PO20 0JP |
| Wight Way | PO20 0UD |
| Windsor Road | PO20 0AU |
| Woodland Road | PO20 0AL PO20 0AN |
| York Road | PO20 0HZ |
| PO20 0WD PO20 9WZ |
Transport near Selsey South
-
Bognor Regis Station
-
Chichester Station
-
Fishbourne Station
-
Bosham Station
-
Nutbourne Station
-
Barnham Station
-
Southbourne Station
- FAQ
- Price Paid By Year
- Property Type Price
Frequently asked questions about Selsey South
What is the average price for a property for sale in Selsey South?
The average price for a property for sale in Selsey South is £386,672. This amount is 20% lower than the average price in Chichester. There are 1,623 property listings for sale in Selsey South.
What streets have the most expensive properties for sale in Selsey South?
The streets with the most expensive properties for sale in Selsey South are Ursula Square at an average of £870,000, Bonnar Road at an average of £600,000 and Wight Way at an average of £585,000.
What streets have the most affordable properties for sale in Selsey South?
The streets with the most affordable properties for sale in Selsey South are New Parade at an average of £140,000, Thorney Drive at an average of £180,000 and Grant Close at an average of £194,000.
Which train stations are available in or near Selsey South?
Some of the train stations available in or near Selsey South are Bognor Regis, Chichester and Fishbourne.
Property Price Paid in Selsey South by Year
The average sold property price by year was:
| Year | Average Sold Price | Price Change |
Sold Properties
|
|---|---|---|---|
| 2025 | £442,550 | 14% |
64 Properties |
| 2024 | £381,598 | 10% |
85 Properties |
| 2023 | £345,290 | -27% |
76 Properties |
| 2022 | £438,350 | 14% |
82 Properties |
| 2021 | £376,708 | 4% |
129 Properties |
| 2020 | £363,044 | 7% |
81 Properties |
| 2019 | £335,874 | -1% |
89 Properties |
| 2018 | £339,844 | -0,2% |
79 Properties |
| 2017 | £340,625 | 10% |
83 Properties |
| 2016 | £307,036 | 3% |
92 Properties |
| 2015 | £298,211 | 6% |
98 Properties |
| 2014 | £278,986 | 7% |
107 Properties |
| 2013 | £260,274 | 1% |
89 Properties |
| 2012 | £258,651 | 1% |
85 Properties |
| 2011 | £255,009 | -6% |
75 Properties |
| 2010 | £270,579 | 21% |
88 Properties |
| 2009 | £212,888 | -10% |
80 Properties |
| 2008 | £235,230 | -4% |
74 Properties |
| 2007 | £244,823 | 3% |
142 Properties |
| 2006 | £236,575 | 1% |
152 Properties |
| 2005 | £234,510 | 11% |
105 Properties |
| 2004 | £208,991 | 6% |
125 Properties |
| 2003 | £196,729 | 13% |
109 Properties |
| 2002 | £171,270 | 23% |
152 Properties |
| 2001 | £131,518 | 4% |
137 Properties |
| 2000 | £126,624 | 15% |
157 Properties |
| 1999 | £108,026 | 6% |
222 Properties |
| 1998 | £101,504 | 8% |
192 Properties |
| 1997 | £93,735 | 21% |
159 Properties |
| 1996 | £74,479 | 4% |
129 Properties |
| 1995 | £71,726 | - |
93 Properties |
Property Price per Property Type in Selsey South
Here you can find historic sold price data in order to help with your property search.
The average Property Paid Price for specific property types in the last three years are:
| Property Type | Average Sold Price | Sold Properties |
|---|---|---|
| Semi Detached House | £347,322.00 | 45 Semi Detached Houses |
| Detached House | £482,434.00 | 124 Detached Houses |
| Terraced House | £321,906.00 | 16 Terraced Houses |
| Flat | £159,985.00 | 40 Flats |

