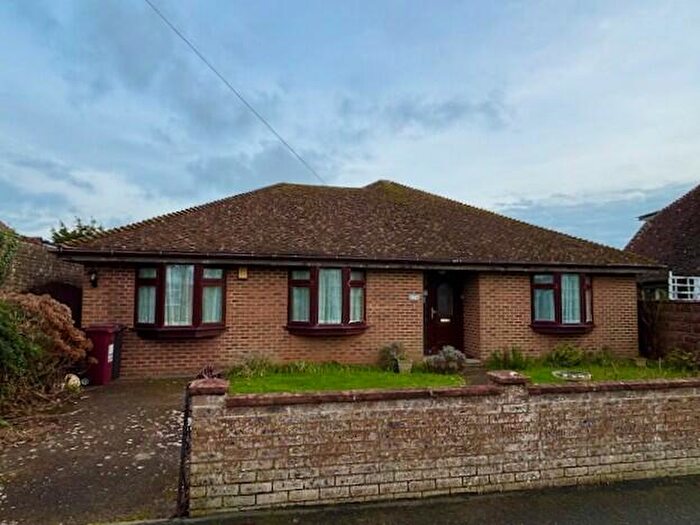
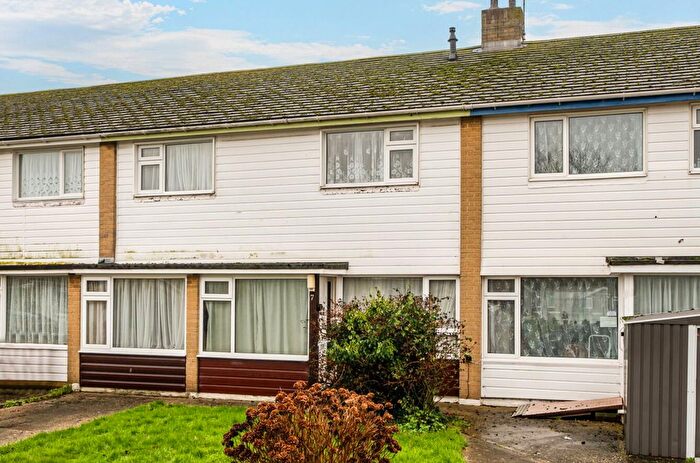
Houses for sale & to rent in Selsey North, Chichester
House Prices in Selsey North
Properties in Selsey North have an average house price of £333,677.00 and had 273 Property Transactions within the last 3 years¹.
Selsey North is an area in Chichester, Surrey with 2,862 households², where the most expensive property was sold for £1,130,000.00.
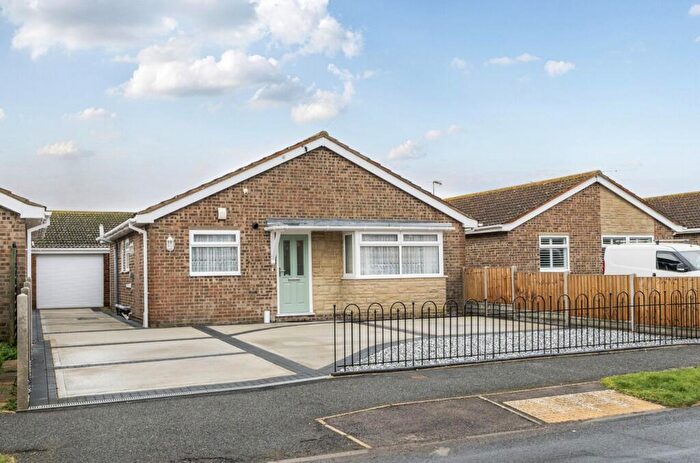
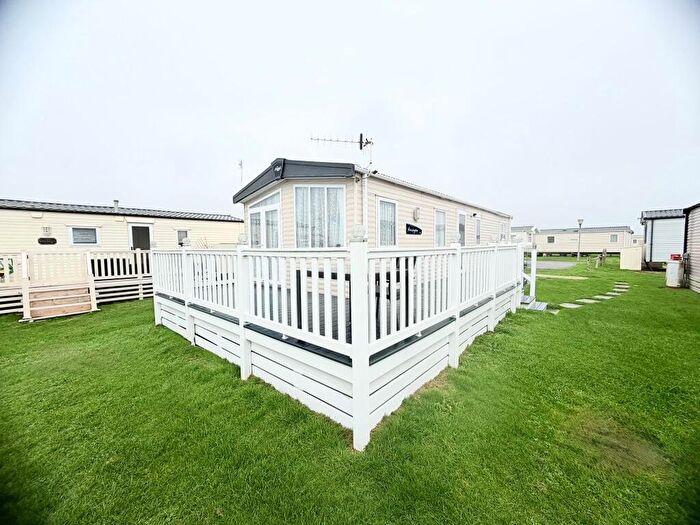
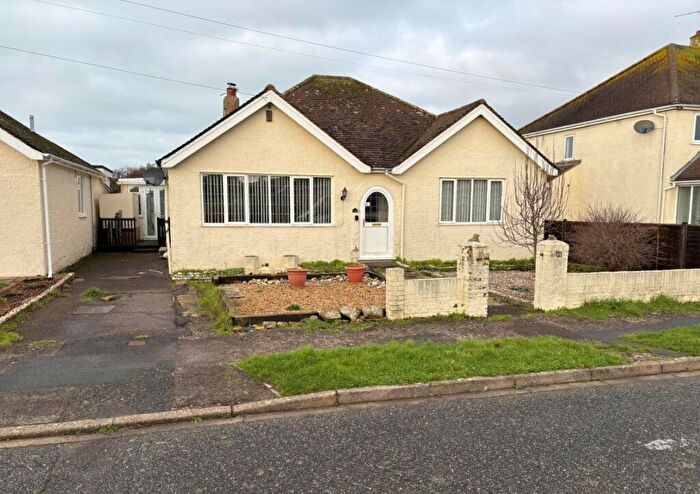
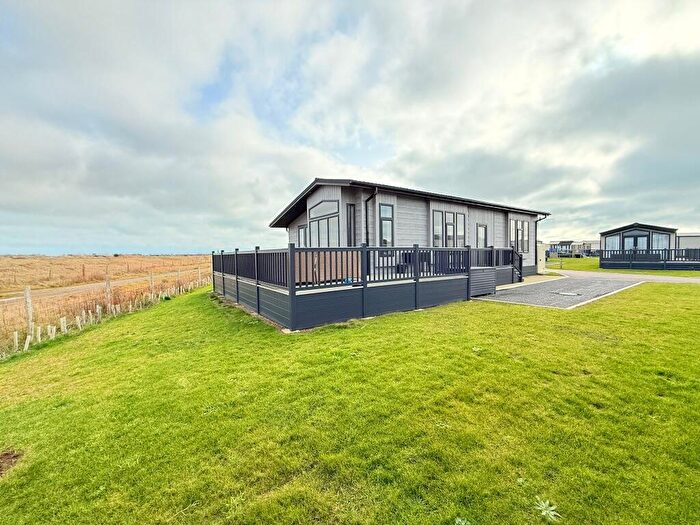
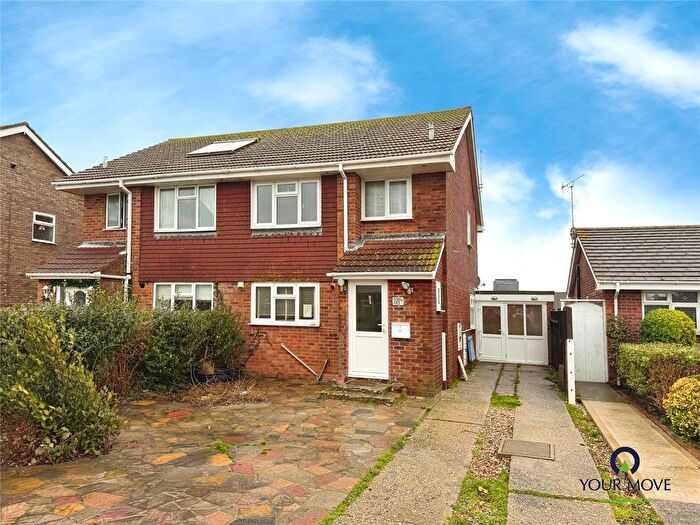
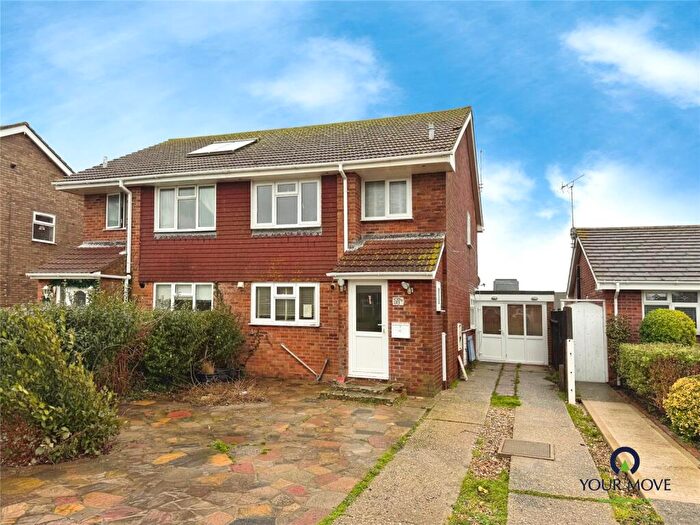
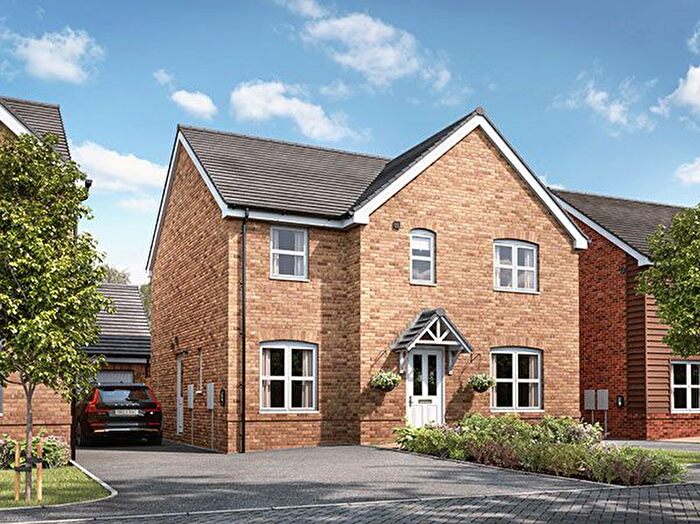
Properties for sale in Selsey North
Roads and Postcodes in Selsey North
Navigate through our locations to find the location of your next house in Selsey North, Chichester for sale or to rent.
| Streets | Postcodes |
|---|---|
| Acorn Close | PO20 9HL |
| Allandale Close | PO20 0SA |
| Beach Road | PO20 0LT PO20 0LU PO20 0NR PO20 0SZ PO20 0TA |
| Beverley Close | PO20 0DR |
| Birches Close | PO20 9EP |
| Blackberry Lane | PO20 9JW |
| Broad View | PO20 0SU PO20 0SX |
| Broadway | PO20 9DL |
| Broomfield Road | PO20 0PB |
| Burlington Gardens | PO20 0DP |
| Chichester Road | PO20 0NB PO20 0NH PO20 0NL PO20 0NQ PO20 9DY PO20 9DZ PO20 9EA PO20 9EB PO20 9ED |
| Chichester Way | PO20 0PJ |
| Church Road | PO20 0LR PO20 0LS |
| Coach House Close | PO20 0QS |
| Colt Street | PO20 9EU |
| Constable Drive | PO20 0EG |
| Coppice Lane | PO20 9EX |
| Crablands | PO20 9AX PO20 9AY PO20 9BD |
| Crablands Close | PO20 9BE |
| Croft Way | PO20 0QP |
| Dennys Close | PO20 0RA PO20 0RX |
| Denshare Road | PO20 0SJ |
| Donaldson Close | PO20 9JP |
| Drift Lane | PO20 9BG |
| Drift Road | PO20 0PN PO20 0PP PO20 0PW |
| East Bank | PO20 0SP |
| East Beach Road | PO20 0ER PO20 0ES PO20 0EZ PO20 0HA PO20 9BS |
| East Way | PO20 0SL |
| Elm Tree Close | PO20 0SQ PO20 0TG PO20 0TQ |
| Fidler Close | PO20 0FA |
| Fishermans Walk | PO20 0BZ |
| Fontwell Road | PO20 0PE PO20 0PG PO20 0PL |
| Fraser Close | PO20 0DY |
| Gainsborough Drive | PO20 0EL PO20 0EW PO20 0HG PO20 0HH |
| Gill Way | PO20 0EX |
| Glen Crescent | PO20 0QT |
| Glyn House Close | PO20 0QD |
| Golf Links Lane | PO20 9DP PO20 9DR |
| Granary Lane | PO20 9JA |
| Grange Lane | PO20 9DS |
| Hanover Close | PO20 0DT |
| Harcourt Way | PO20 0PF |
| Harding Close | PO20 0FG |
| High Street | PO20 0QJ PO20 0RB PO20 0RD PO20 0TR |
| Holford Green | PO20 0NT |
| Honeysuckle Lane | PO20 9JN |
| Horse Field Road | PO20 9ET |
| Horsefield Road | PO20 9EZ |
| Hunnisett Close | PO20 0FH |
| Kilnwood Close | PO20 0HQ |
| Kingsway | PO20 0DL PO20 0SY |
| Landseer Drive | PO20 0EQ |
| Large Acres | PO20 9BA |
| Lingfield Way | PO20 0DX |
| Littlefield Close | PO20 0DZ |
| Malthouse Road | PO20 0BG PO20 0QR PO20 0QU |
| Manor Farm Close | PO20 0LZ |
| Manor Farm Court | PO20 0LY |
| Manor Lane | PO20 0NU PO20 0NX PO20 0NZ |
| Manor Road | PO20 0RY PO20 0RZ PO20 0SB PO20 0SD PO20 0SE PO20 0SF PO20 0SG PO20 0SH PO20 0SS |
| Marine Drive | PO20 0SN PO20 0SR PO20 0ST PO20 0SW |
| Marisfield Place | PO20 0PD |
| Mayridge | PO20 9HA |
| Mcnair Close | PO20 9JB |
| Medmerry | PO20 9BJ |
| Merryfield Drive | PO20 0DN PO20 0DS PO20 0DU |
| Mill Lane | PO20 9BQ |
| Millington Drive | PO20 0FE PO20 0FF |
| Montalan Crescent | PO20 9BL PO20 9BX PO20 9EE PO20 9HB |
| Mountwood Road | PO20 0PA |
| Newfield Road | PO20 0EU PO20 0EY |
| Northfield | PO20 0EA |
| Orpen Place | PO20 0EN |
| Paddock Lane | PO20 9AZ PO20 9BB |
| Park Copse | PO20 9BT |
| Park Crescent | PO20 0HB |
| Park Lane | PO20 0HD PO20 0HE PO20 0HF |
| Park Road | PO20 0PR |
| Petts Close | PO20 0FB |
| Rectory Lane | PO20 9DT PO20 9DU |
| Robins Close | PO20 0QX |
| Robinson Close | PO20 0FD |
| Romney Garth | PO20 0EJ |
| Roundstone Way | PO20 0PH |
| Ruskin Close | PO20 0TE |
| Saddle Lane | PO20 9EY |
| Slattsfield Close | PO20 0EB |
| Spinney Close | PO20 9JD |
| St Georges Close | PO20 0TD |
| St Peters Crescent | PO20 0NA PO20 0NP |
| St Wilfreds Close | PO20 0PQ |
| The Causeway | PO20 9BY |
| The Close | PO20 0ET |
| The Horseshoe | PO20 9ES |
| The Wadeway | PO20 9BZ |
| The Willows | PO20 0JT |
| Tretawn Gardens | PO20 0DW |
| Turner Way | PO20 0EH |
| Upways Close | PO20 0NJ |
| Warners Lane | PO20 9EL |
| Wellington Gardens | PO20 0EE PO20 0RF |
| Wheatfield Road | PO20 0NY |
Transport near Selsey North
-
Bognor Regis Station
-
Chichester Station
-
Fishbourne Station
-
Bosham Station
-
Nutbourne Station
-
Barnham Station
-
Southbourne Station
- FAQ
- Price Paid By Year
- Property Type Price
Frequently asked questions about Selsey North
What is the average price for a property for sale in Selsey North?
The average price for a property for sale in Selsey North is £333,677. This amount is 31% lower than the average price in Chichester. There are 1,907 property listings for sale in Selsey North.
What streets have the most expensive properties for sale in Selsey North?
The streets with the most expensive properties for sale in Selsey North are East Beach Road at an average of £717,000, Golf Links Lane at an average of £700,000 and The Close at an average of £600,000.
What streets have the most affordable properties for sale in Selsey North?
The streets with the most affordable properties for sale in Selsey North are The Willows at an average of £154,857, Slattsfield Close at an average of £200,000 and St Peters Crescent at an average of £210,000.
Which train stations are available in or near Selsey North?
Some of the train stations available in or near Selsey North are Bognor Regis, Chichester and Fishbourne.
Property Price Paid in Selsey North by Year
The average sold property price by year was:
| Year | Average Sold Price | Price Change |
Sold Properties
|
|---|---|---|---|
| 2025 | £336,039 | 1% |
69 Properties |
| 2024 | £331,927 | -1% |
100 Properties |
| 2023 | £333,794 | -5% |
104 Properties |
| 2022 | £350,151 | 6% |
125 Properties |
| 2021 | £327,585 | 9% |
179 Properties |
| 2020 | £297,438 | 4% |
111 Properties |
| 2019 | £285,203 | 1% |
98 Properties |
| 2018 | £281,464 | 6% |
118 Properties |
| 2017 | £263,703 | 2% |
125 Properties |
| 2016 | £259,352 | 10% |
145 Properties |
| 2015 | £232,930 | 1% |
150 Properties |
| 2014 | £230,362 | 10% |
186 Properties |
| 2013 | £207,586 | 3% |
118 Properties |
| 2012 | £201,342 | 4% |
103 Properties |
| 2011 | £192,834 | -0,2% |
120 Properties |
| 2010 | £193,165 | -6% |
135 Properties |
| 2009 | £204,167 | 1% |
114 Properties |
| 2008 | £202,492 | -7% |
74 Properties |
| 2007 | £217,429 | 9% |
224 Properties |
| 2006 | £198,508 | 5% |
220 Properties |
| 2005 | £188,338 | 2% |
158 Properties |
| 2004 | £183,630 | 13% |
203 Properties |
| 2003 | £160,285 | 19% |
175 Properties |
| 2002 | £130,519 | 16% |
216 Properties |
| 2001 | £109,634 | 10% |
222 Properties |
| 2000 | £98,538 | 17% |
191 Properties |
| 1999 | £81,361 | 7% |
252 Properties |
| 1998 | £75,368 | 10% |
206 Properties |
| 1997 | £67,743 | 8% |
195 Properties |
| 1996 | £62,409 | 4% |
193 Properties |
| 1995 | £59,699 | - |
123 Properties |
Property Price per Property Type in Selsey North
Here you can find historic sold price data in order to help with your property search.
The average Property Paid Price for specific property types in the last three years are:
| Property Type | Average Sold Price | Sold Properties |
|---|---|---|
| Flat | £176,758.00 | 28 Flats |
| Semi Detached House | £328,010.00 | 106 Semi Detached Houses |
| Detached House | £423,424.00 | 87 Detached Houses |
| Terraced House | £279,572.00 | 52 Terraced Houses |

