
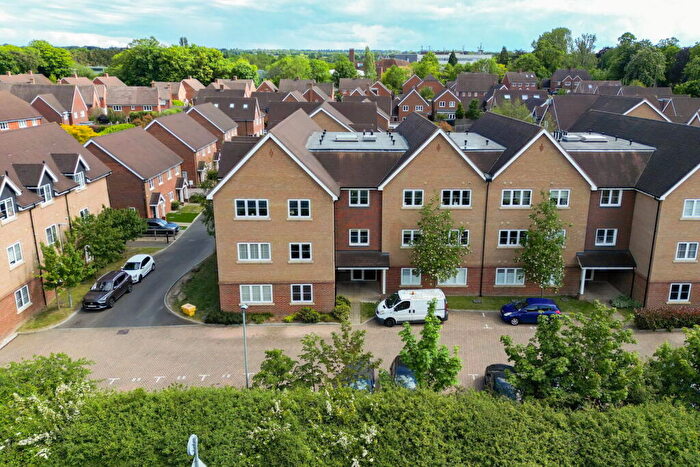
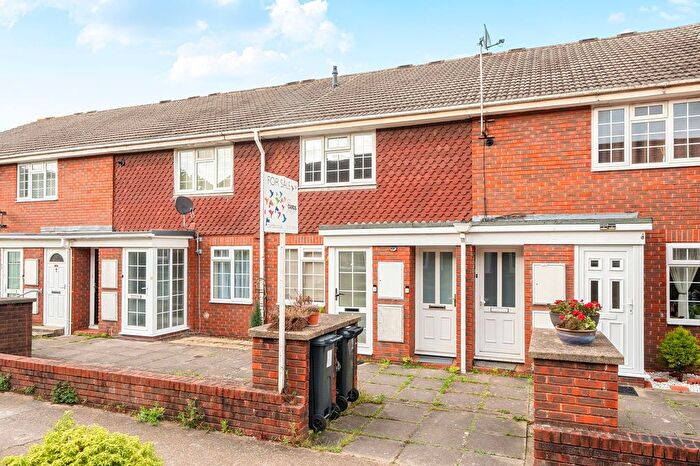
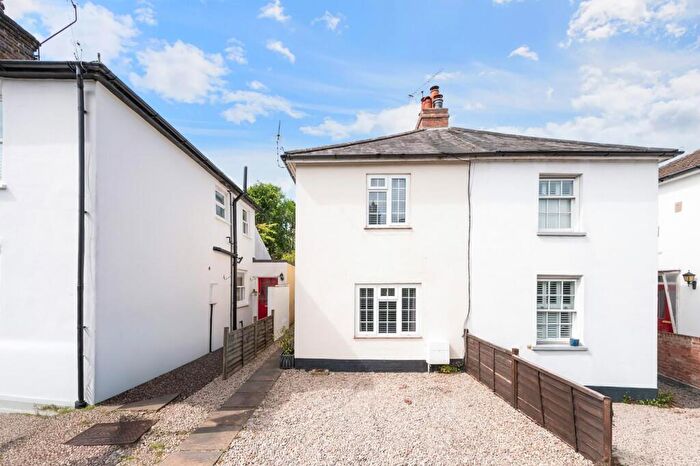
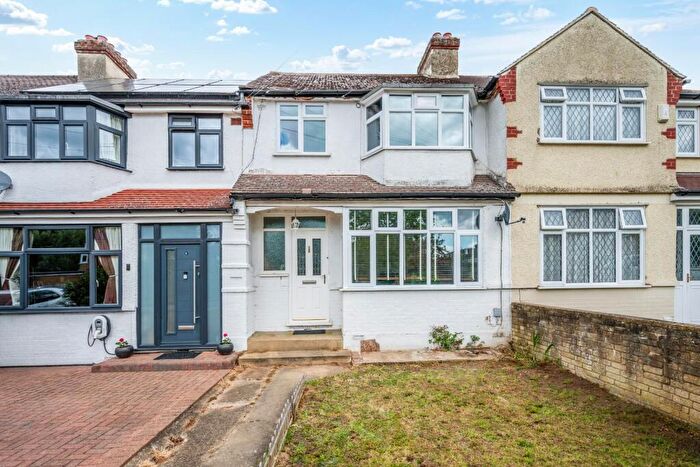
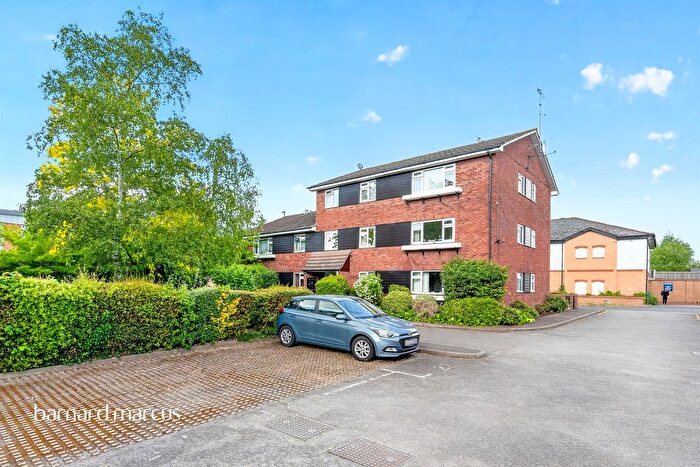
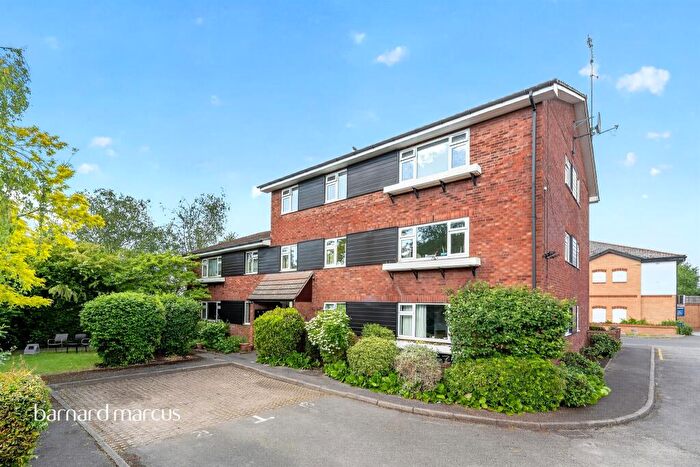
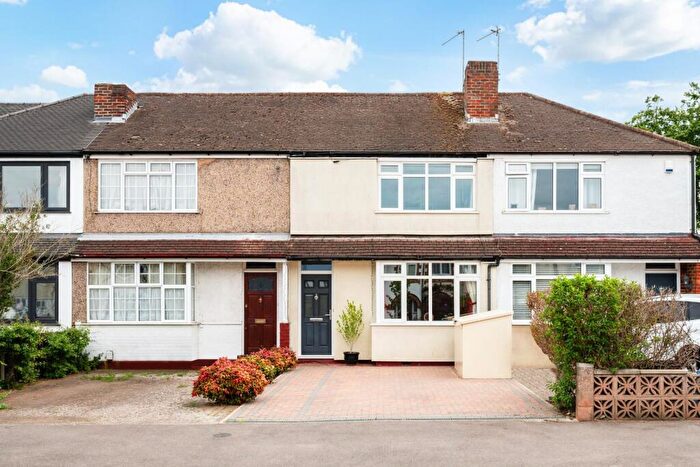
Houses for sale & to rent in KT17 1XP, Larby Place, Ewell, Epsom
House Prices in KT17 1XP, Larby Place, Ewell
Properties in KT17 1XP have no sales history available within the last 3 years. KT17 1XP is a postcode in Larby Place located in Ewell, an area in Epsom, Surrey, with 16 households².
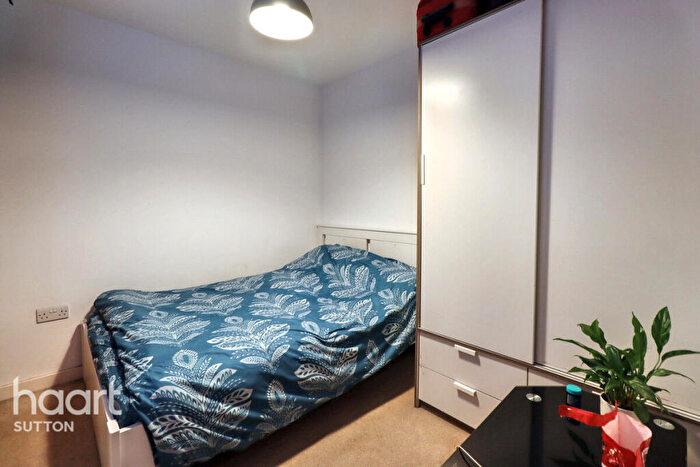
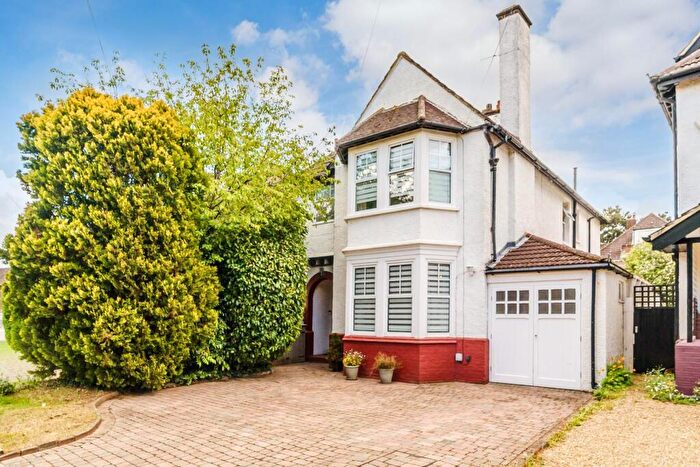
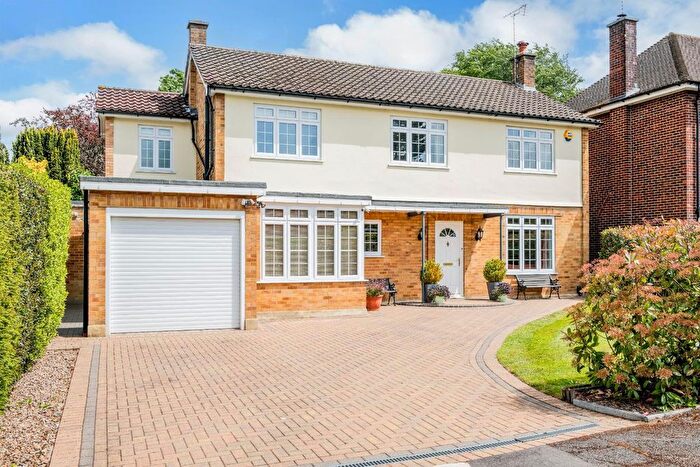
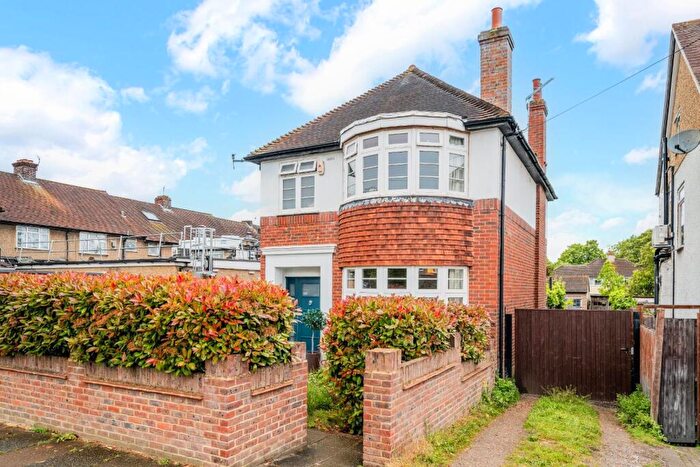
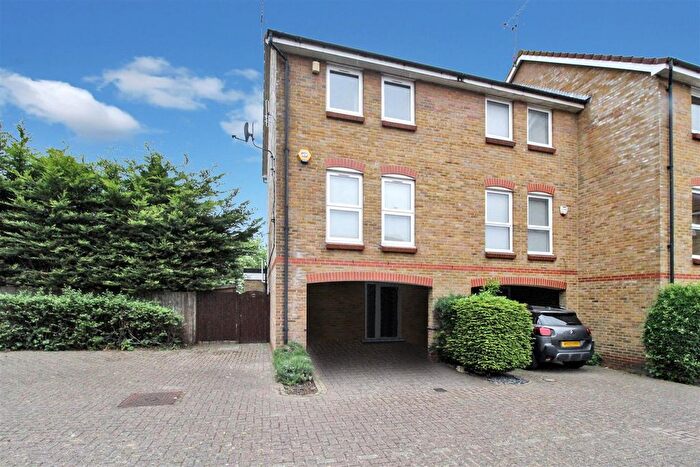
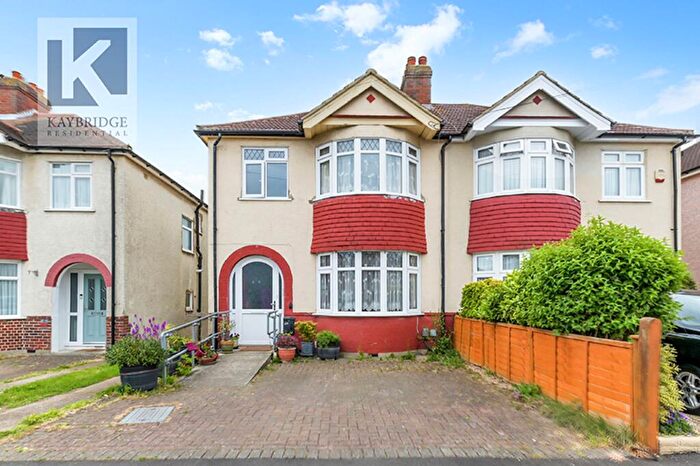
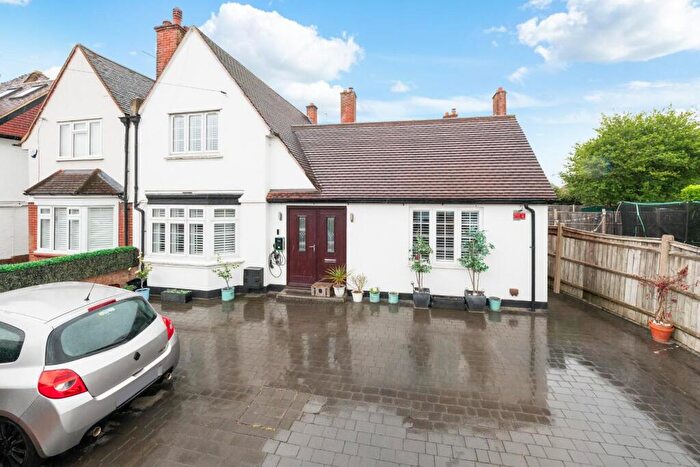
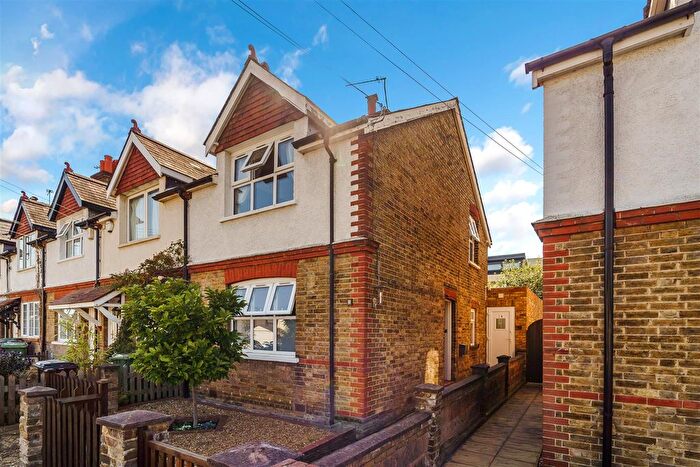
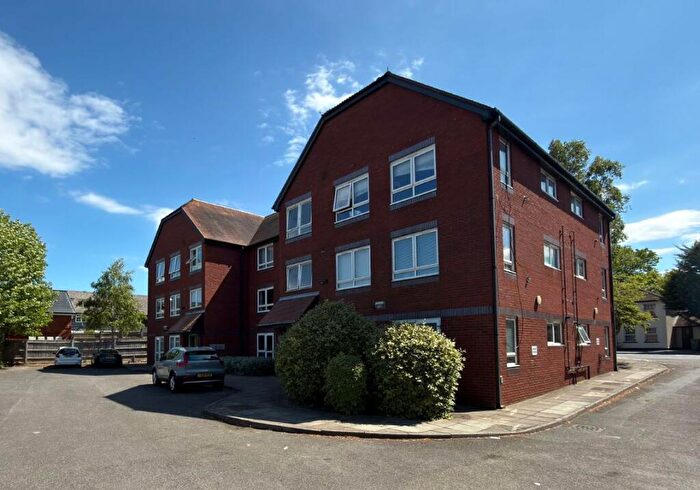
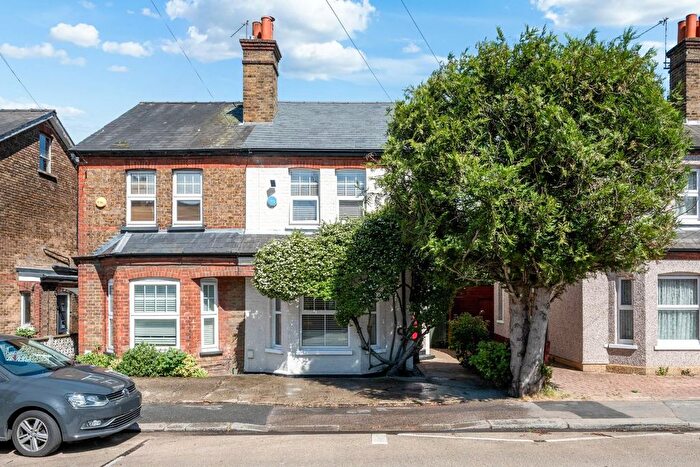
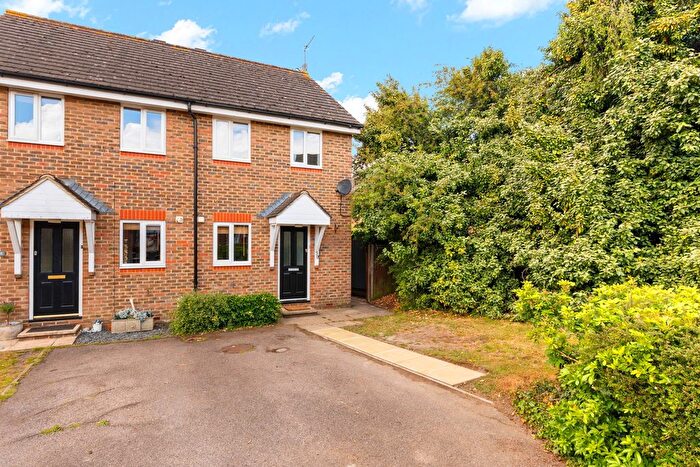
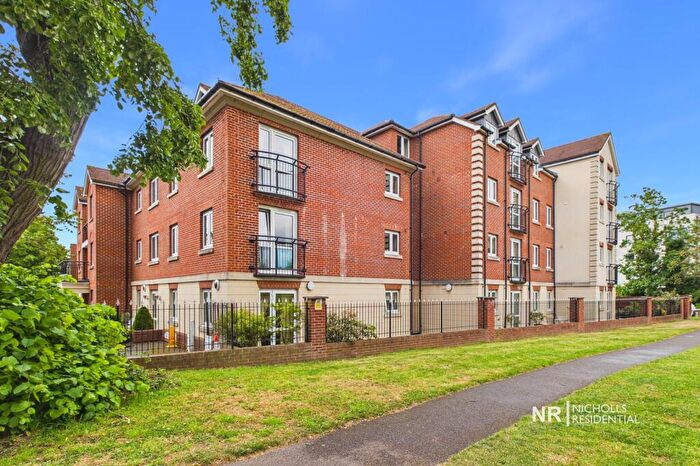
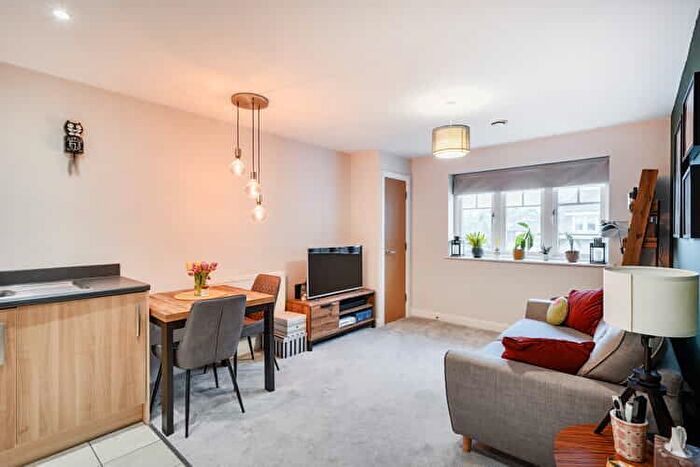
Properties for sale near KT17 1XP, Larby Place

![]()
If you are looking to sell your house, let it out, or receive a property valuation, an expert can help you.
Click the button below to get started.

Price Paid in Larby Place, KT17 1XP, Ewell
12 Larby Place, KT17 1XP, Ewell Epsom
Property 12 has been sold 4 times. The last time it was sold was in 22/02/2022 and the sold price was £285,000.00.
This flat, sold as a leasehold on 22/02/2022, is a 67 sqm top-floor flat with an EPC rating of D.
| Date | Price | Property Type | Tenure | Classification |
|---|---|---|---|---|
| 22/02/2022 | £285,000.00 | Flat | leasehold | Established Building |
| 27/07/2006 | £177,500.00 | Flat | leasehold | Established Building |
| 30/10/2001 | £118,500.00 | Flat | leasehold | Established Building |
| 04/06/1999 | £69,000.00 | Flat | leasehold | Established Building |
9 Larby Place, KT17 1XP, Ewell Epsom
Property 9 has been sold 5 times. The last time it was sold was in 28/06/2021 and the sold price was £348,000.00.
This flat, sold as a leasehold on 28/06/2021, is a 68 sqm ground-floor flat with an EPC rating of D.
| Date | Price | Property Type | Tenure | Classification |
|---|---|---|---|---|
| 28/06/2021 | £348,000.00 | Flat | leasehold | Established Building |
| 06/12/2017 | £350,000.00 | Flat | leasehold | Established Building |
| 16/08/2013 | £222,500.00 | Flat | leasehold | Established Building |
| 30/06/2005 | £177,500.00 | Flat | leasehold | Established Building |
| 23/01/1996 | £45,000.00 | Flat | leasehold | Established Building |
2 Larby Place, KT17 1XP, Ewell Epsom
Property 2 has been sold 2 times. The last time it was sold was in 06/03/2015 and the sold price was £239,950.00.
This flat, sold as a leasehold on 06/03/2015, is a 43 sqm ground-floor flat with an EPC rating of D.
| Date | Price | Property Type | Tenure | Classification |
|---|---|---|---|---|
| 06/03/2015 | £239,950.00 | Flat | leasehold | Established Building |
| 08/07/2005 | £141,000.00 | Terraced House | leasehold | Established Building |
1 Larby Place, KT17 1XP, Ewell Epsom
Property 1 has been sold 2 times. The last time it was sold was in 30/10/2009 and the sold price was £145,000.00.
This flat, sold as a leasehold on 30/10/2009, is a 48 sqm ground-floor flat with an EPC rating of E.
| Date | Price | Property Type | Tenure | Classification |
|---|---|---|---|---|
| 30/10/2009 | £145,000.00 | Flat | leasehold | Established Building |
| 06/09/2000 | £83,950.00 | Flat | leasehold | Established Building |
15 Larby Place, KT17 1XP, Ewell Epsom
Property 15 has been sold 2 times. The last time it was sold was in 09/03/2007 and the sold price was £200,000.00.
This is a Flat which was sold as a leasehold in 09/03/2007
| Date | Price | Property Type | Tenure | Classification |
|---|---|---|---|---|
| 09/03/2007 | £200,000.00 | Flat | leasehold | Established Building |
| 12/07/2005 | £155,000.00 | Flat | leasehold | Established Building |
5 Larby Place, KT17 1XP, Ewell Epsom
This is a 45 square meter Mid-floor Flat with an EPC rating of C. Currently, there is no transaction history available for this property.
3 LARBY PLACE EWELL, KT17 1XP, Ewell Epsom
This is a 45 square meter Top-floor Flat with an EPC rating of D. Currently, there is no transaction history available for this property.
4 Larby Place, KT17 1XP, Ewell Epsom
This is a 46 square meter Top-floor Flat with an EPC rating of D. Currently, there is no transaction history available for this property.
Transport near KT17 1XP, Larby Place
-
 Ewell West Station
 -
Ewell East Station
-
Epsom Station
-
Stoneleigh Station
-
Epsom Downs Station
-
Cheam Station
-
Chessington North Station
-
Chessington South Station
-
Banstead Station
-
Tolworth Station
House price paid reports for KT17 1XP, Larby Place
Click on the buttons below to see price paid reports by year or property price:
- Price Paid By Year
Property Price Paid in KT17 1XP, Larby Place by Year
The average sold property price by year was:
| Year | Average Sold Price | Price Change |
Sold Properties
|
|---|---|---|---|
| 2022 | £285,000 | -22% |
1 Property |
| 2021 | £348,000 | -1% |
1 Property |
| 2017 | £350,000 | 31% |
1 Property |
| 2015 | £239,950 | 7% |
1 Property |
| 2013 | £222,500 | 35% |
1 Property |
| 2009 | £145,000 | -38% |
1 Property |
| 2007 | £200,000 | 11% |
1 Property |
| 2006 | £177,500 | 11% |
1 Property |
| 2005 | £157,833 | 25% |
3 Properties |
| 2001 | £118,500 | 29% |
1 Property |
| 2000 | £83,950 | 18% |
1 Property |
| 1999 | £69,000 | 35% |
1 Property |
| 1996 | £45,000 | - |
1 Property |