
Houses for sale & to rent in KT8 2ND, Dunvegan Close, Molesey South, West Molesey
House Prices in KT8 2ND, Dunvegan Close, Molesey South
Properties in KT8 2ND have no sales history available within the last 3 years. KT8 2ND is a postcode in Dunvegan Close located in Molesey South, an area in West Molesey, Surrey, with 11 households².
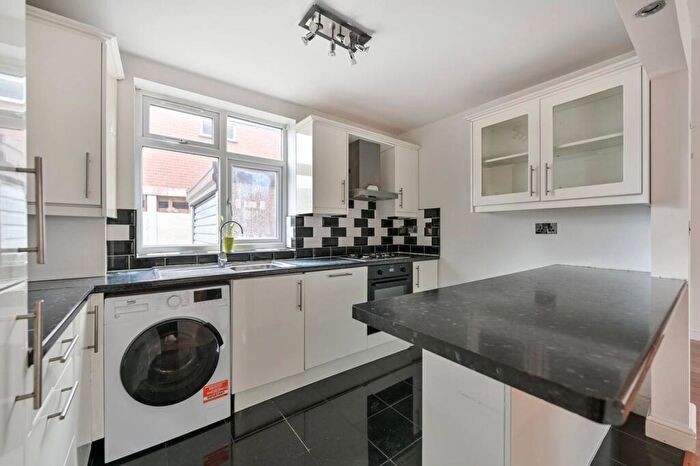
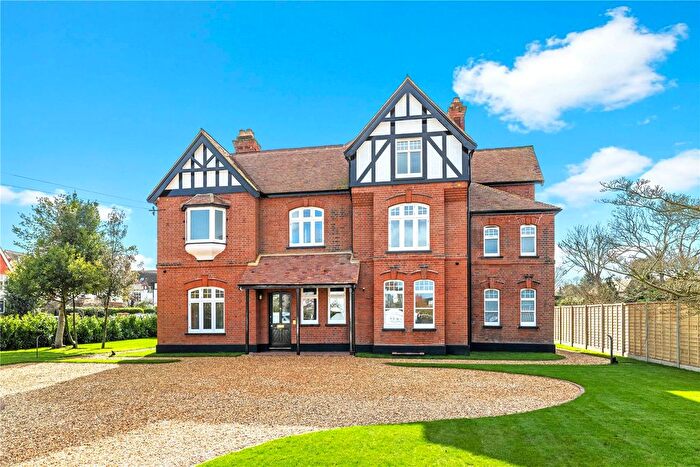
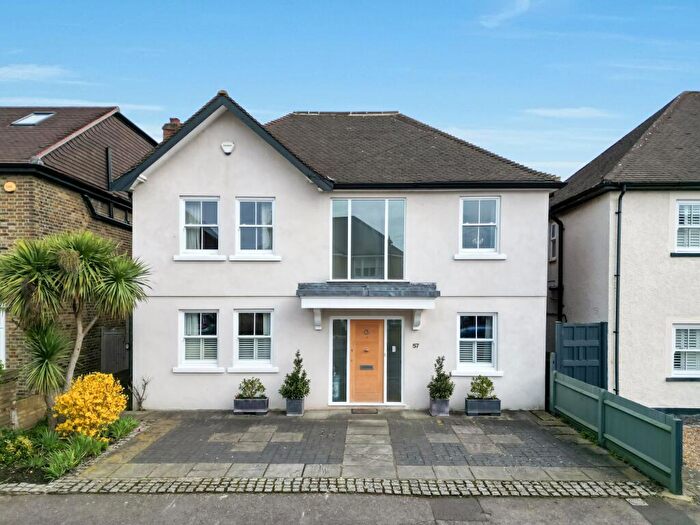
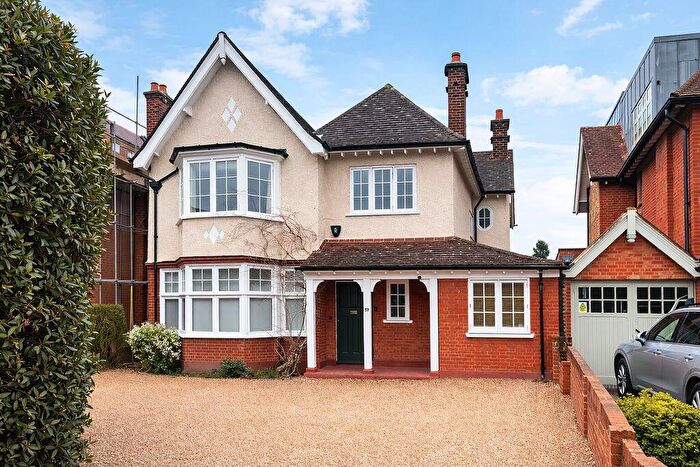
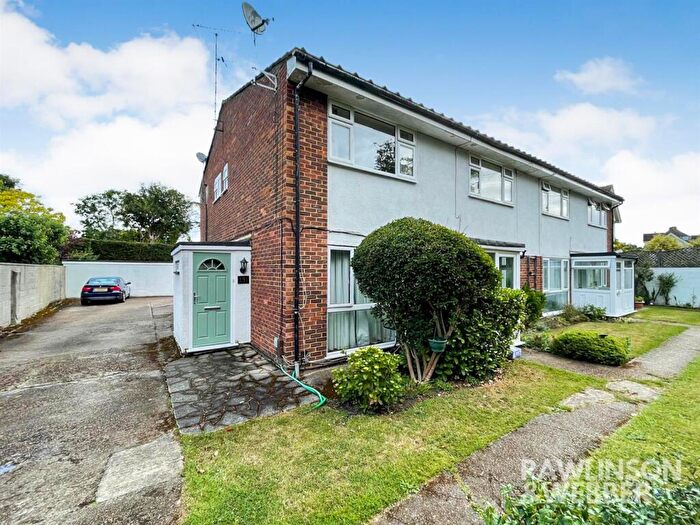
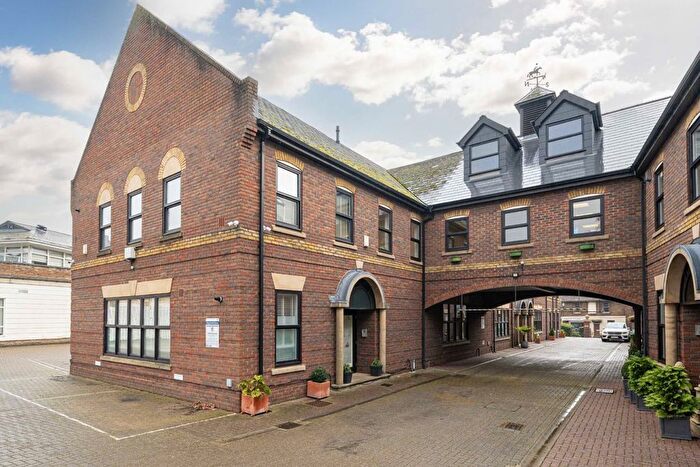
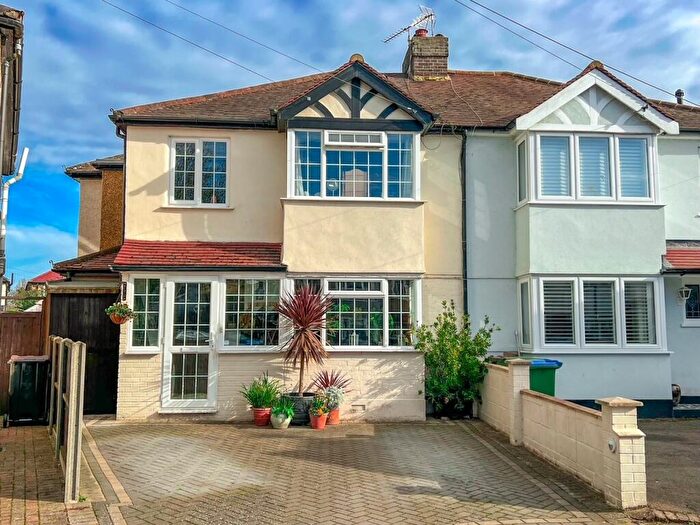
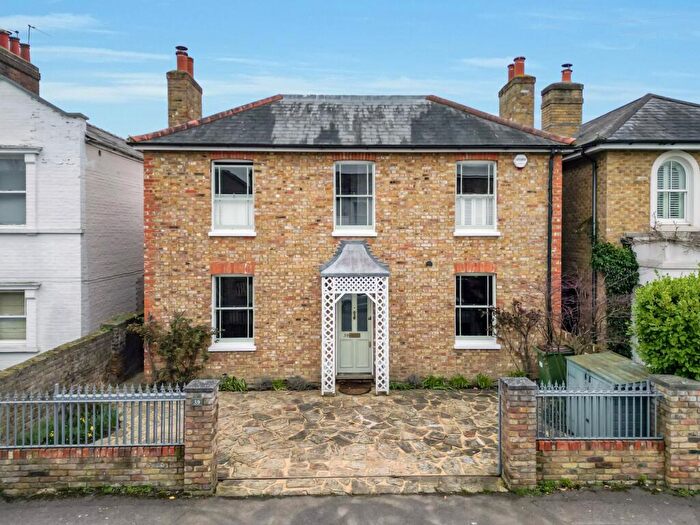
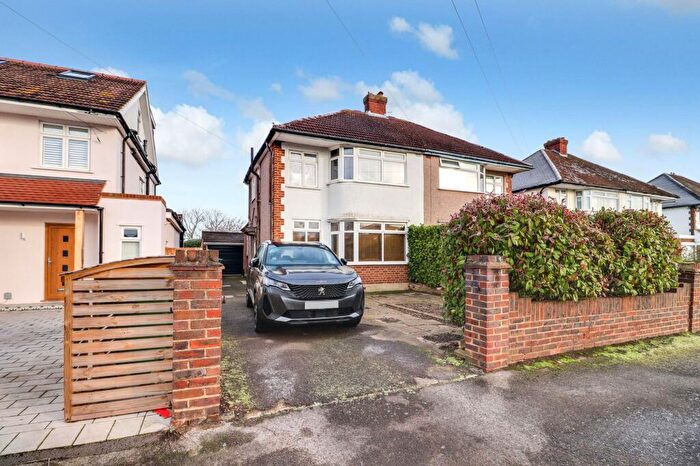
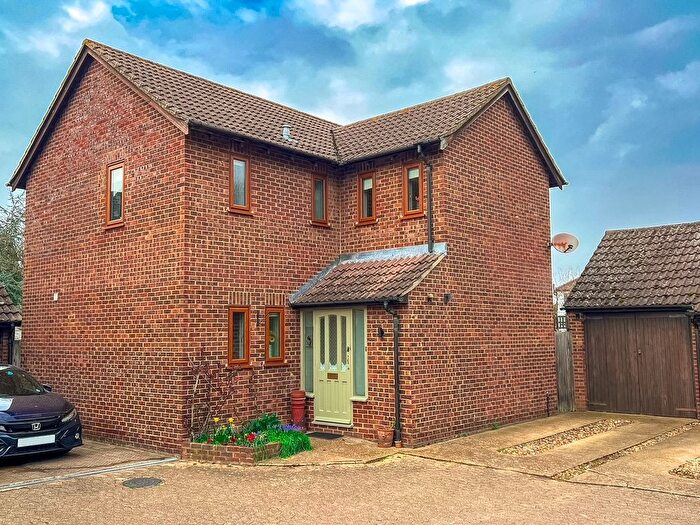
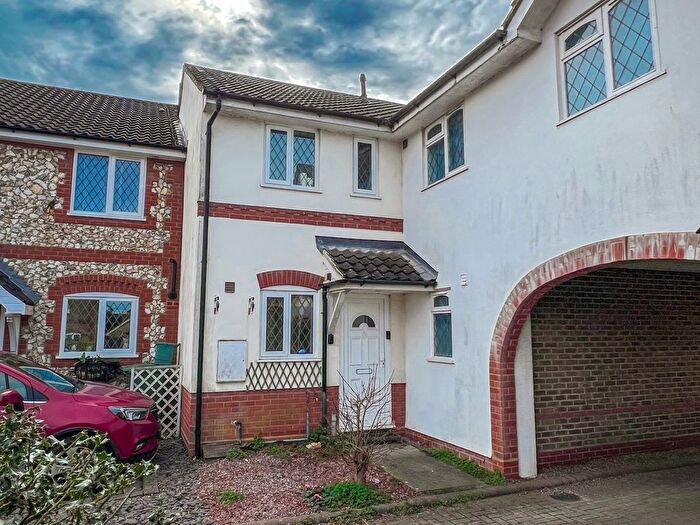
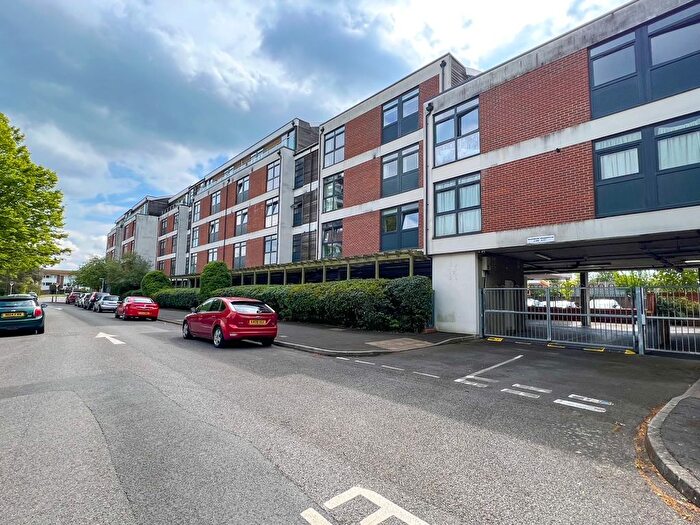
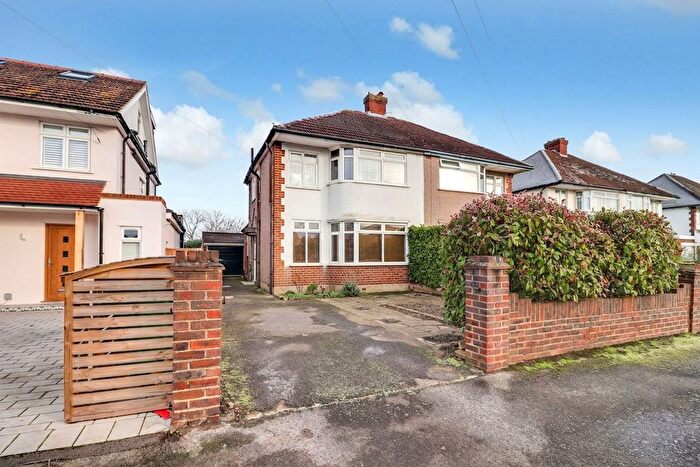
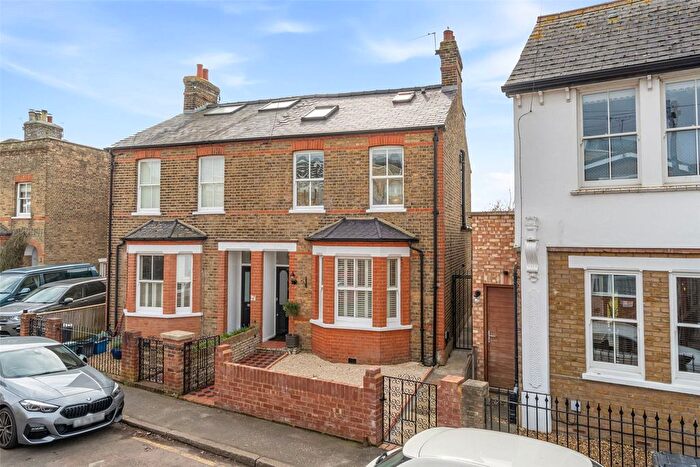
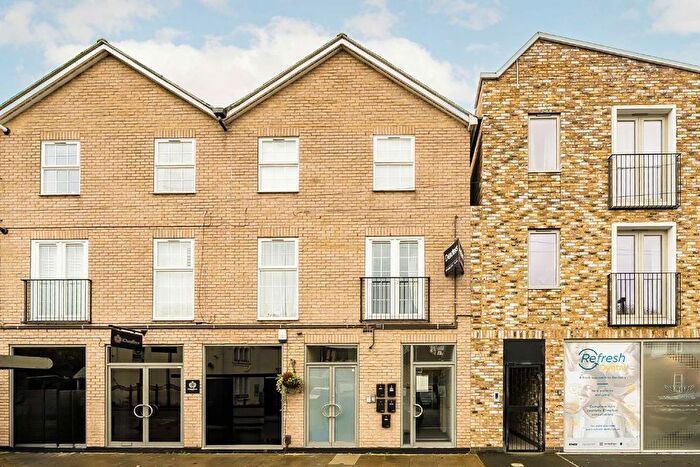
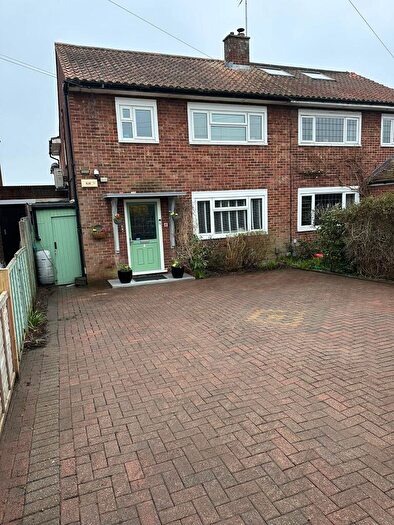
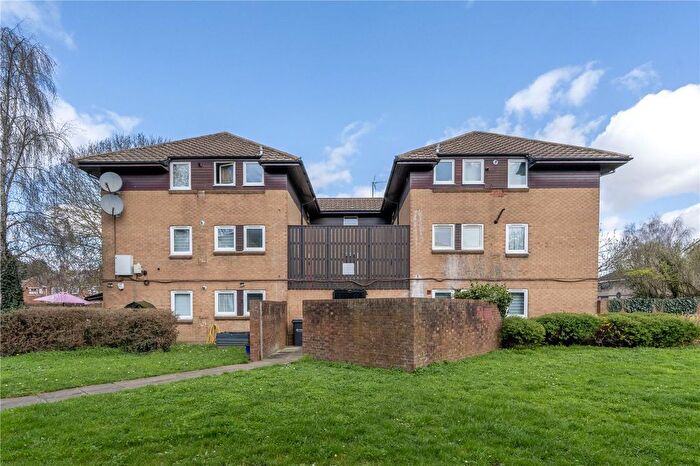
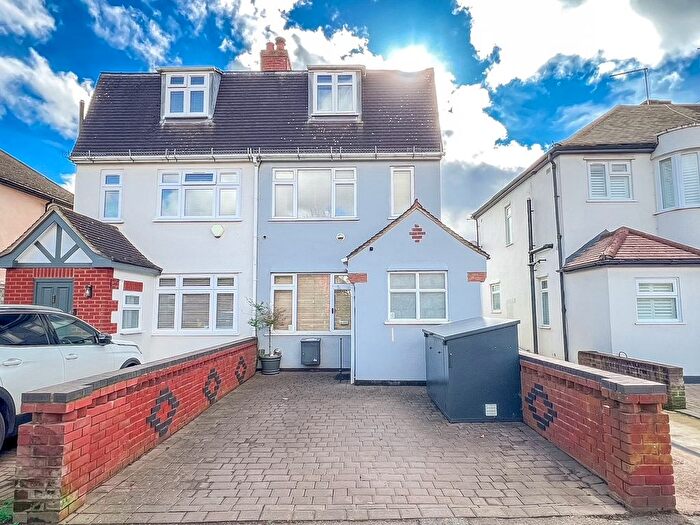
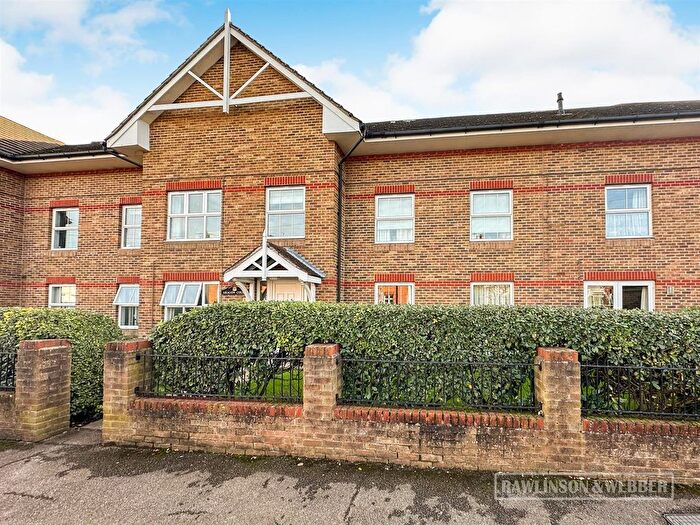
Properties for sale near KT8 2ND, Dunvegan Close

![]()
If you are looking to sell your house, let it out, or receive a property valuation, an expert can help you.
Click the button below to get started.


Price Paid in Dunvegan Close, KT8 2ND, Molesey South
7 Dunvegan Close, KT8 2ND, Molesey South West Molesey
Property 7 has been sold 2 times. The last time it was sold was in 29/07/2021 and the sold price was £445,000.00.
This terraced house, sold as a freehold on 29/07/2021, is a 90 sqm mid-terrace house with an EPC rating of C.
| Date | Price | Property Type | Tenure | Classification |
|---|---|---|---|---|
| 29/07/2021 | £445,000.00 | Terraced House | freehold | Established Building |
| 16/08/2013 | £318,000.00 | Terraced House | freehold | Established Building |
5 Dunvegan Close, KT8 2ND, Molesey South West Molesey
Property 5 has been sold 4 times. The last time it was sold was in 13/11/2020 and the sold price was £450,000.00.
This terraced house, sold as a freehold on 13/11/2020, is a 84 sqm mid-terrace house with an EPC rating of C.
| Date | Price | Property Type | Tenure | Classification |
|---|---|---|---|---|
| 13/11/2020 | £450,000.00 | Terraced House | freehold | Established Building |
| 18/07/2014 | £390,000.00 | Terraced House | freehold | Established Building |
| 04/10/2002 | £187,000.00 | Detached House | freehold | Established Building |
| 03/04/2000 | £149,950.00 | Detached House | freehold | Established Building |
2 Dunvegan Close, KT8 2ND, Molesey South West Molesey
Property 2 has been sold 3 times. The last time it was sold was in 06/08/2018 and the sold price was £560,000.00.
This terraced house, sold as a freehold on 06/08/2018, is a 79 sqm semi-detached house with an EPC rating of E.
| Date | Price | Property Type | Tenure | Classification |
|---|---|---|---|---|
| 06/08/2018 | £560,000.00 | Terraced House | freehold | Established Building |
| 11/09/2015 | £368,500.00 | Terraced House | freehold | Established Building |
| 06/01/2006 | £160,000.00 | Terraced House | freehold | Established Building |
6 Dunvegan Close, KT8 2ND, Molesey South West Molesey
Property 6 has been sold 1 time. The last time it was sold was in 22/06/2016 and the sold price was £485,000.00.
This terraced house, sold as a freehold on 22/06/2016, is a 91 sqm end-terrace house with an EPC rating of D.
| Date | Price | Property Type | Tenure | Classification |
|---|---|---|---|---|
| 22/06/2016 | £485,000.00 | Terraced House | freehold | Established Building |
9 Dunvegan Close, KT8 2ND, Molesey South West Molesey
Property 9 has been sold 2 times. The last time it was sold was in 26/06/2014 and the sold price was £360,000.00.
This terraced house, sold as a freehold on 26/06/2014, is a 76 sqm end-terrace house with an EPC rating of D.
| Date | Price | Property Type | Tenure | Classification |
|---|---|---|---|---|
| 26/06/2014 | £360,000.00 | Terraced House | freehold | Established Building |
| 14/11/2003 | £203,750.00 | Terraced House | freehold | Established Building |
3 Dunvegan Close, KT8 2ND, Molesey South West Molesey
Property 3 has been sold 1 time. The last time it was sold was in 29/11/2002 and the sold price was £190,000.00.
This detached house, sold as a freehold on 29/11/2002, is a 93 sqm mid-terrace house with an EPC rating of C.
| Date | Price | Property Type | Tenure | Classification |
|---|---|---|---|---|
| 29/11/2002 | £190,000.00 | Detached House | freehold | Established Building |
Transport near KT8 2ND, Dunvegan Close
-
 Hampton Station
 -
Hampton Court Station
-
Thames Ditton Station
-
Esher Station
-
Hersham Station
-
Kempton Park Station
-
Teddington Station
-
Hinchley Wood Station
-
Sunbury Station
-
Fulwell Station
House price paid reports for KT8 2ND, Dunvegan Close
Click on the buttons below to see price paid reports by year or property price:
- Price Paid By Year
Property Price Paid in KT8 2ND, Dunvegan Close by Year
The average sold property price by year was:
| Year | Average Sold Price | Price Change |
Sold Properties
|
|---|---|---|---|
| 2021 | £445,000 | -1% |
1 Property |
| 2020 | £450,000 | -24% |
1 Property |
| 2018 | £560,000 | 13% |
1 Property |
| 2016 | £485,000 | 24% |
1 Property |
| 2015 | £368,500 | -2% |
1 Property |
| 2014 | £375,000 | 15% |
2 Properties |
| 2013 | £318,000 | 50% |
1 Property |
| 2006 | £160,000 | -27% |
1 Property |
| 2003 | £203,750 | 7% |
1 Property |
| 2002 | £188,500 | 20% |
2 Properties |
| 2000 | £149,950 | - |
1 Property |