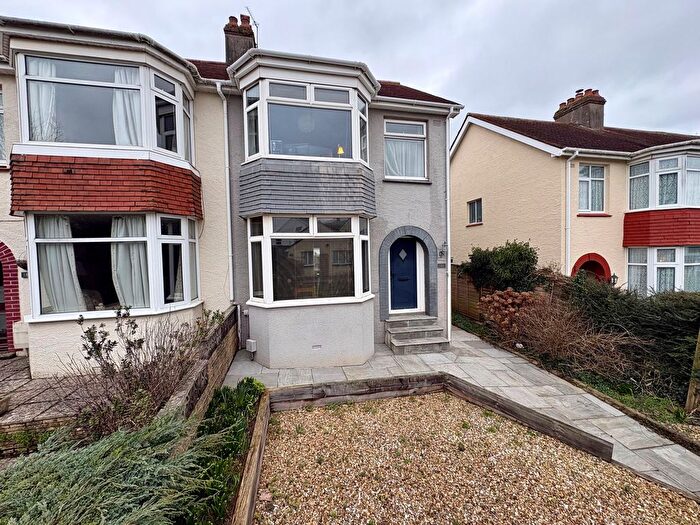
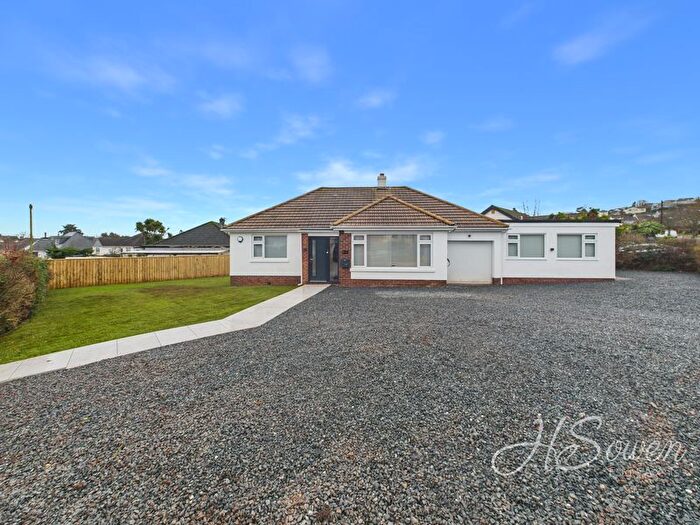
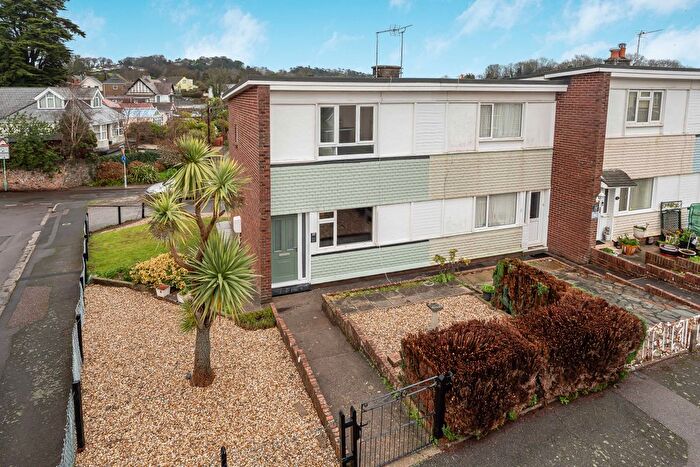
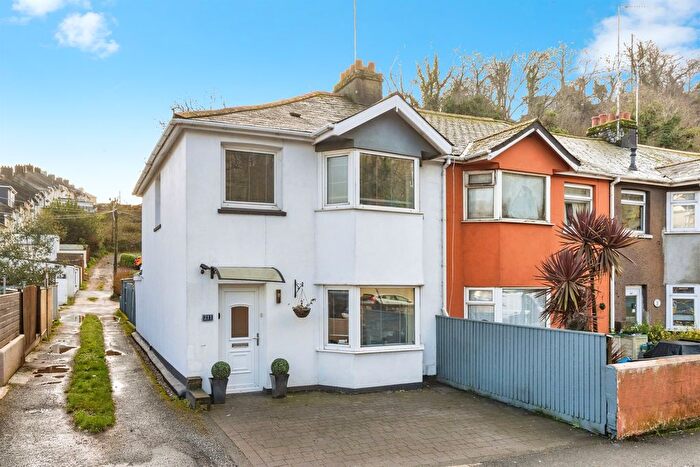
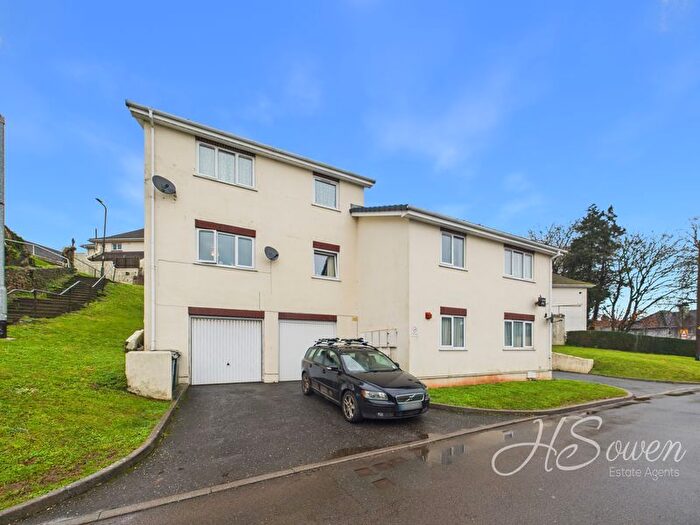
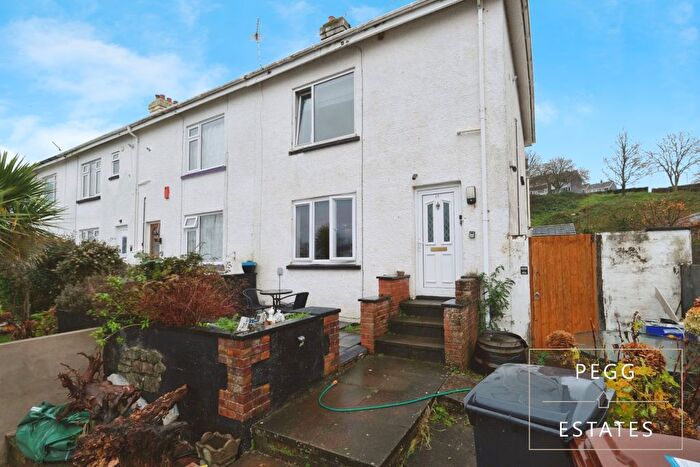
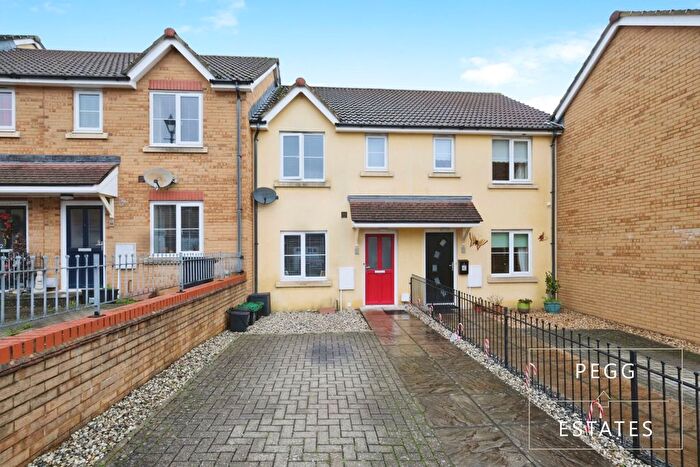
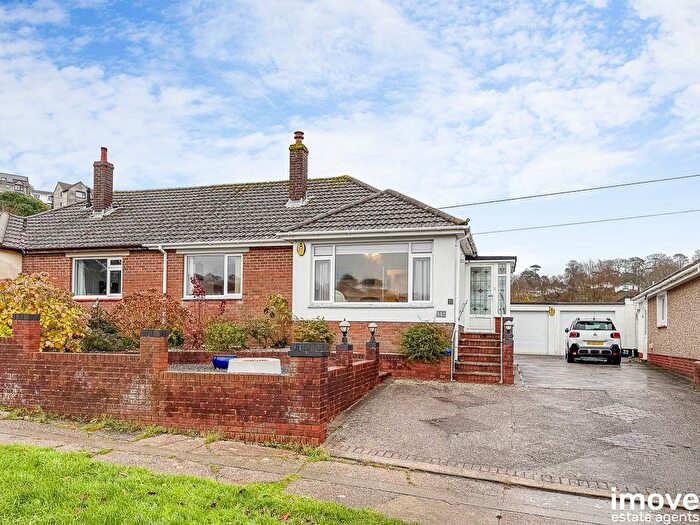
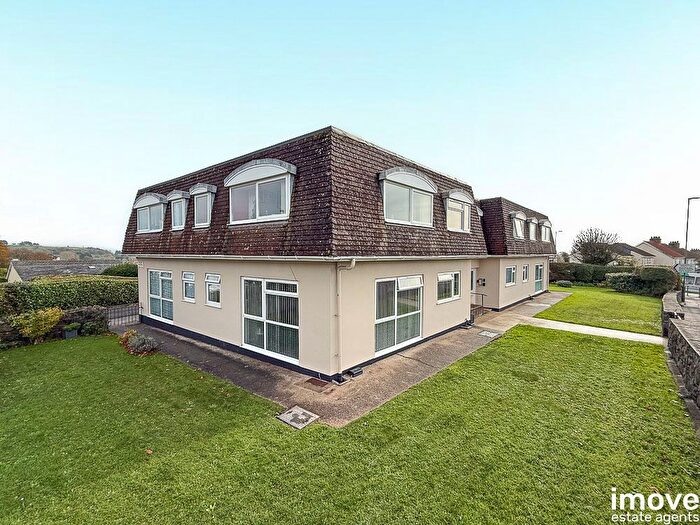
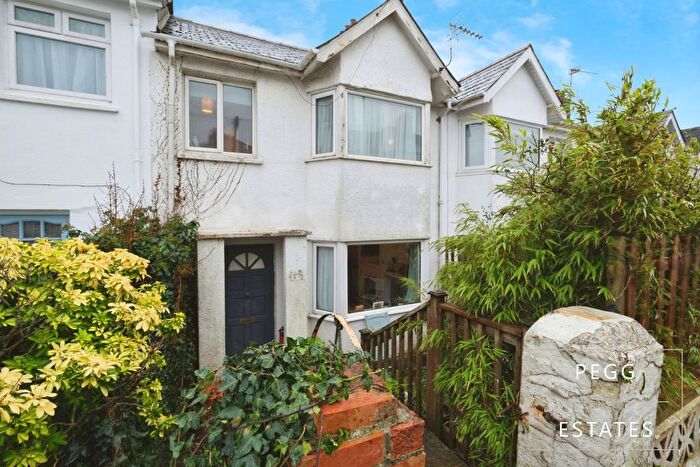
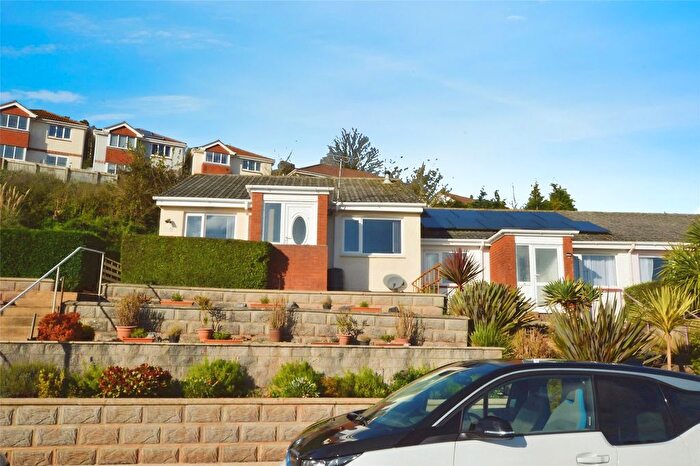
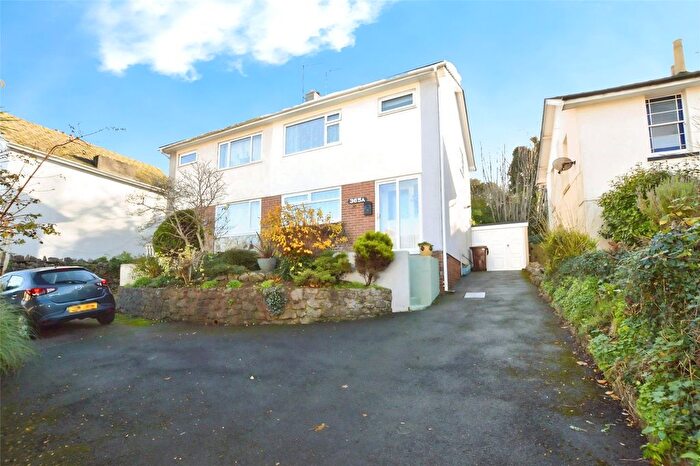
Houses for sale & to rent in Watcombe, Torquay
House Prices in Watcombe
Properties in Watcombe have an average house price of £281,003.00 and had 245 Property Transactions within the last 3 years¹.
Watcombe is an area in Torquay, Torbay with 2,877 households², where the most expensive property was sold for £810,000.00.
Properties for sale in Watcombe
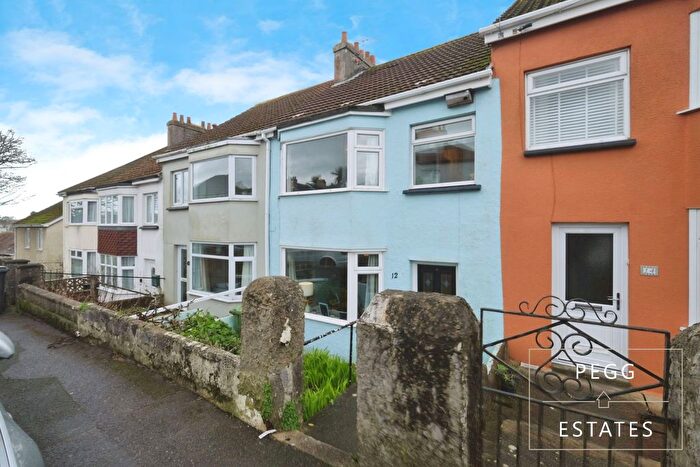
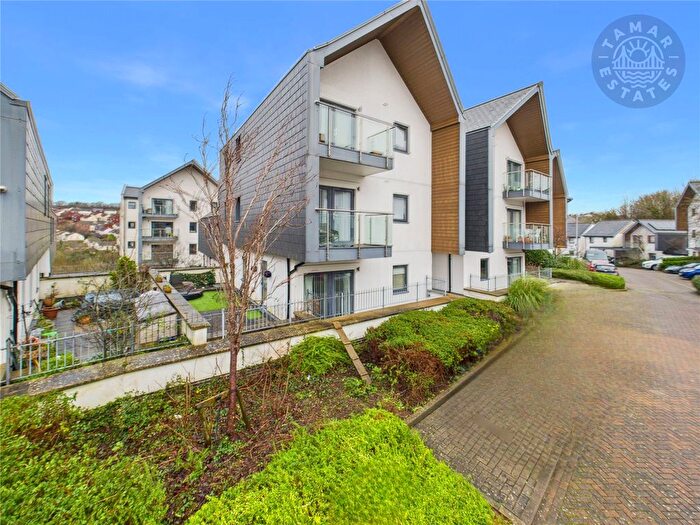
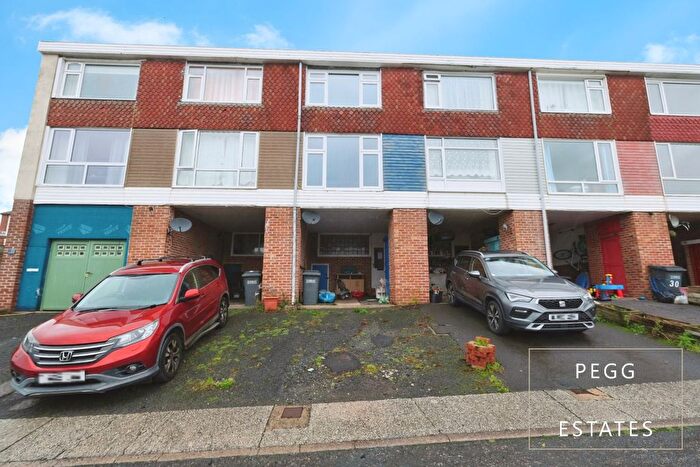
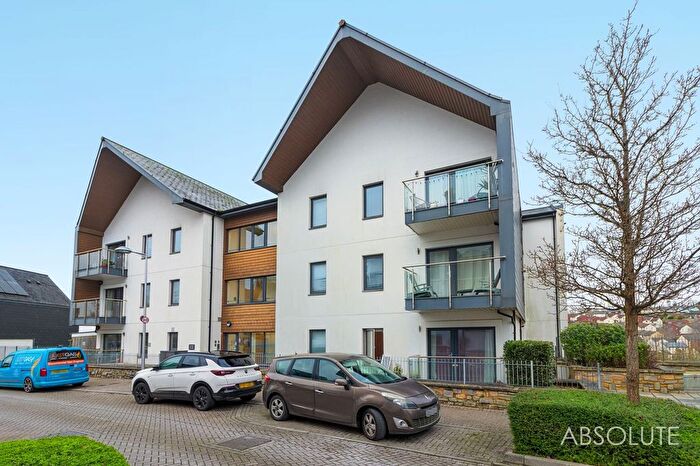
Previously listed properties in Watcombe
Roads and Postcodes in Watcombe
Navigate through our locations to find the location of your next house in Watcombe, Torquay for sale or to rent.
| Streets | Postcodes |
|---|---|
| Allendale Gardens | TQ2 8PR |
| Ashleigh Close | TQ2 8HP |
| Barchington Avenue | TQ2 8LB |
| Barradon Close | TQ2 8QE |
| Bellrock Close | TQ2 8DD |
| Bove Park Road | TQ2 8NZ |
| Bowerland Avenue | TQ2 8QH |
| Braeside Road | TQ2 8QR |
| Brunel Avenue | TQ2 8NW |
| Chalfield Close | TQ2 8LN |
| Church Road | TQ2 8PN |
| Clennon Lane | TQ2 8HH TQ2 8HL |
| Coker Avenue | TQ2 8LQ |
| Combe Road | TQ2 8EQ |
| Coombe Lane | TQ2 8HE |
| Coombe Road | TQ2 8EJ |
| Cornfield Green | TQ2 8DX |
| Dorchester Grove | TQ2 8JQ |
| East Pafford Avenue | TQ2 8BZ TQ2 8DA TQ2 8DB |
| Edgeley Road | TQ2 8ND |
| Falloway Close | TQ2 8EY |
| Firlands Road | TQ2 8EL TQ2 8EW |
| Fore Street | TQ2 8BE TQ2 8BG TQ2 8BJ TQ2 8BL TQ2 8BN TQ2 8BP TQ2 8DN TQ2 8DP |
| Froude Avenue | TQ2 8NS |
| Gard Close | TQ2 8QU |
| Garth Road | TQ2 8HA |
| Gloucester Close | TQ2 8AP |
| Golden Park Avenue | TQ2 8LD TQ2 8LR TQ2 8LS |
| Greenway Close | TQ2 8EF |
| Greenway Gardens | TQ2 8EG |
| Halsteads Road | TQ2 8EX TQ2 8EZ TQ2 8HB |
| Happaway Road | TQ2 8EE TQ2 8EP TQ2 8ES TQ2 8EU TQ2 8HF |
| Heaviside Close | TQ2 8NR |
| Helens Mead Close | TQ2 8PB |
| Helens Mead Road | TQ2 8PD |
| Horace Road | TQ2 8AS |
| Idewell Road | TQ2 8EN |
| Isaacs Road | TQ2 8NA TQ2 8NB |
| Jacks Lane | TQ2 8QX |
| Kingsgate Close | TQ2 8QA |
| Langford Crescent | TQ2 8DR |
| Lawn Close | TQ2 8JZ |
| Lea Road | TQ2 8NT |
| Lichfield Avenue | TQ2 8AH TQ2 8AJ TQ2 8AL TQ2 8AN TQ2 8AQ TQ2 8AW |
| Linacre Road | TQ2 8LE TQ2 8LF TQ2 8LG |
| Lincoln Green | TQ2 8AB |
| Lummaton Cross | TQ2 8ET |
| Merrivale Close | TQ2 8PZ |
| Mincent Hill | TQ2 8DE TQ2 8DF TQ2 8DG |
| Moor Lane | TQ2 8NJ TQ2 8NU TQ2 8NX TQ2 8PJ |
| Moor Lane Close | TQ2 8PL |
| Orange Grove | TQ2 8NE |
| Overdale Close | TQ2 8RD |
| Padacre Road | TQ2 8PU TQ2 8PX TQ2 8QQ |
| Pafford Avenue | TQ2 8BS |
| Peasland Road | TQ2 8NY TQ2 8PA |
| Roberts Close | TQ2 8DU |
| Rocombe Close | TQ2 8QF |
| Ryde Close | TQ2 8HD |
| Salisbury Avenue | TQ2 8AT TQ2 8AU TQ2 8AX |
| Scoresby Close | TQ2 8NP |
| Seymour Drive | TQ2 8PY |
| Shrewsbury Avenue | TQ2 8AE TQ2 8AF |
| Southern Close | TQ2 8QJ |
| St Augustines Close | TQ2 8PW |
| Staddon Gardens | TQ2 8BB |
| Starpitten Grove | TQ2 8BX |
| Starpitten Lane West | TQ2 8DL |
| Steps Lane | TQ2 8NL TQ2 8NN |
| Sutherland Drive | TQ2 8BR |
| Sutton Close | TQ2 8LL |
| Sutton Mews | TQ2 8LW |
| Swale Close | TQ2 8PH |
| Swedwell Road | TQ2 8QL TQ2 8QN TQ2 8QP TQ2 8QS TQ2 8QT TQ2 8QW |
| Teignmouth Road | TQ1 4SJ |
| The Conifers | TQ2 8NG |
| The Mount | TQ2 8JS |
| Truro Avenue | TQ2 8AA TQ2 8AG |
| Velland Avenue | TQ2 8LH TQ2 8LJ |
| Wembury Drive | TQ2 8DT |
| Wesley Close | TQ2 8RA TQ2 8SH |
| Wesley Mews | TQ2 8DS |
| West Pafford Avenue | TQ2 8BT TQ2 8BY |
| Willow Avenue | TQ2 8DH TQ2 8DJ |
| Winchester Avenue | TQ2 8AR |
Transport near Watcombe
- FAQ
- Price Paid By Year
- Property Type Price
Frequently asked questions about Watcombe
What is the average price for a property for sale in Watcombe?
The average price for a property for sale in Watcombe is £281,003. This amount is 5% higher than the average price in Torquay. There are 1,108 property listings for sale in Watcombe.
What streets have the most expensive properties for sale in Watcombe?
The streets with the most expensive properties for sale in Watcombe are Ashleigh Close at an average of £645,000, Lawn Close at an average of £570,000 and The Mount at an average of £542,500.
What streets have the most affordable properties for sale in Watcombe?
The streets with the most affordable properties for sale in Watcombe are Gloucester Close at an average of £109,000, Wesley Close at an average of £123,583 and Lichfield Avenue at an average of £147,650.
Which train stations are available in or near Watcombe?
Some of the train stations available in or near Watcombe are Torre, Torquay and Newton Abbot.
Property Price Paid in Watcombe by Year
The average sold property price by year was:
| Year | Average Sold Price | Price Change |
Sold Properties
|
|---|---|---|---|
| 2025 | £266,183 | -9% |
82 Properties |
| 2024 | £291,055 | 2% |
81 Properties |
| 2023 | £285,893 | 12% |
82 Properties |
| 2022 | £251,678 | -4% |
81 Properties |
| 2021 | £262,796 | 23% |
125 Properties |
| 2020 | £201,427 | -6% |
90 Properties |
| 2019 | £213,430 | 5% |
117 Properties |
| 2018 | £203,662 | 1% |
101 Properties |
| 2017 | £200,793 | 3% |
117 Properties |
| 2016 | £195,467 | 2% |
97 Properties |
| 2015 | £191,855 | 7% |
99 Properties |
| 2014 | £178,544 | 7% |
111 Properties |
| 2013 | £166,898 | 6% |
94 Properties |
| 2012 | £157,337 | -2% |
76 Properties |
| 2011 | £161,091 | - |
62 Properties |
| 2010 | £161,110 | 2% |
77 Properties |
| 2009 | £158,174 | -20% |
73 Properties |
| 2008 | £190,175 | 6% |
56 Properties |
| 2007 | £177,833 | 11% |
159 Properties |
| 2006 | £159,139 | 3% |
138 Properties |
| 2005 | £153,572 | 2% |
105 Properties |
| 2004 | £150,560 | 16% |
148 Properties |
| 2003 | £125,761 | 16% |
160 Properties |
| 2002 | £105,621 | 13% |
179 Properties |
| 2001 | £91,950 | 21% |
169 Properties |
| 2000 | £72,288 | 6% |
156 Properties |
| 1999 | £68,221 | 8% |
142 Properties |
| 1998 | £62,707 | 4% |
158 Properties |
| 1997 | £59,994 | 6% |
126 Properties |
| 1996 | £56,690 | 2% |
107 Properties |
| 1995 | £55,401 | - |
105 Properties |
Property Price per Property Type in Watcombe
Here you can find historic sold price data in order to help with your property search.
The average Property Paid Price for specific property types in the last three years are:
| Property Type | Average Sold Price | Sold Properties |
|---|---|---|
| Semi Detached House | £263,107.00 | 92 Semi Detached Houses |
| Detached House | £414,485.00 | 69 Detached Houses |
| Terraced House | £207,451.00 | 68 Terraced Houses |
| Flat | £120,862.00 | 16 Flats |

