
Houses for sale & to rent in TQ1 4SJ, Teignmouth Road, Watcombe, Torquay
House Prices in TQ1 4SJ, Teignmouth Road, Watcombe
Properties in TQ1 4SJ have an average house price of £392k and had 1 Property Transaction within the last 3 years.¹ TQ1 4SJ is a postcode in Teignmouth Road located in Watcombe, an area in Torquay, Torbay, with 2 households², where the most expensive property was sold for £392k.
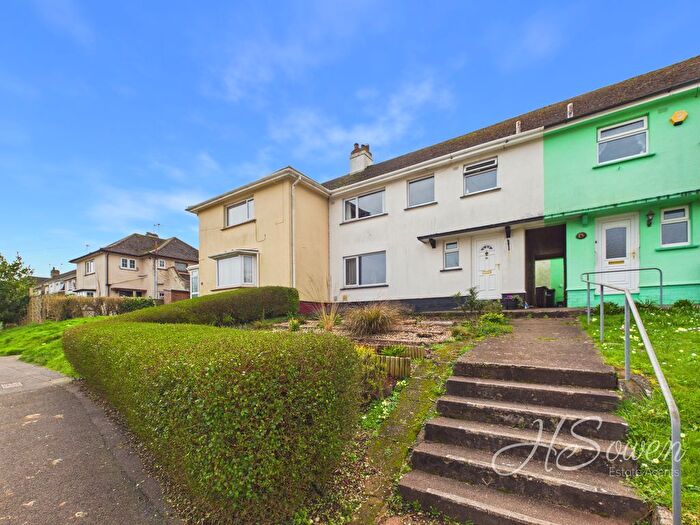
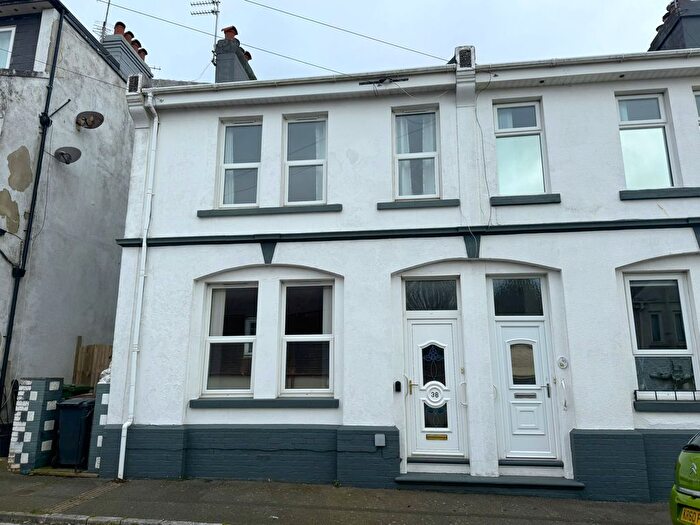
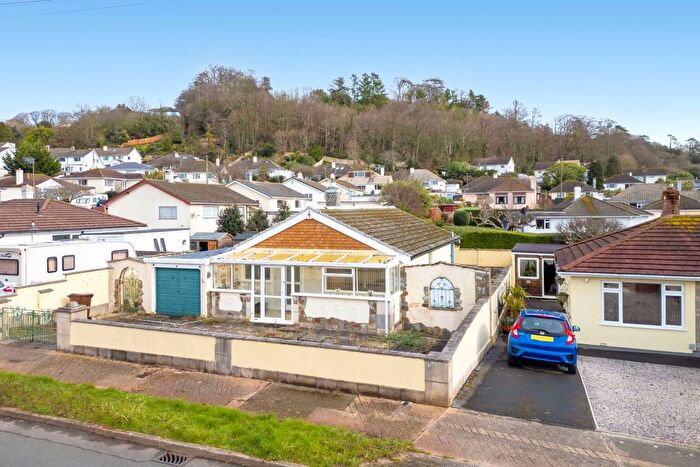
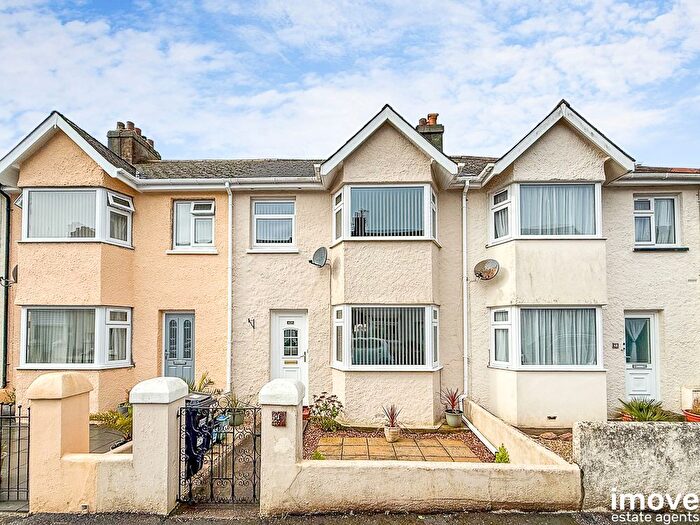
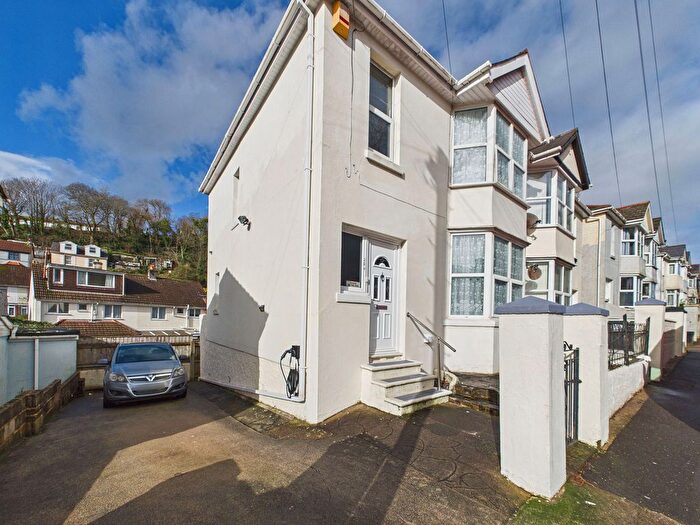
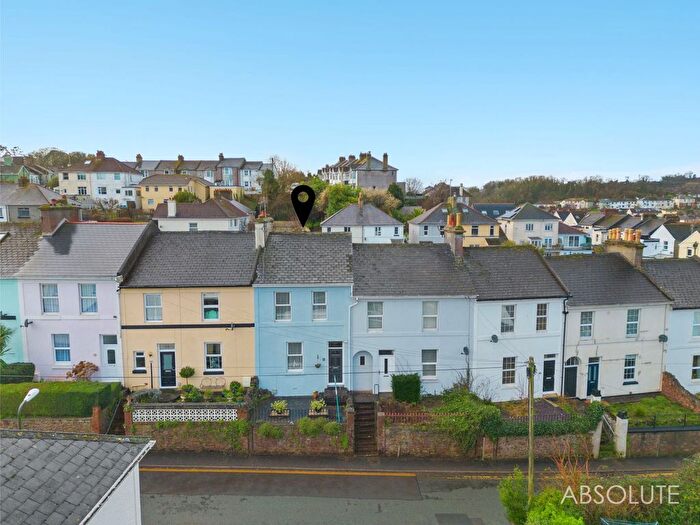
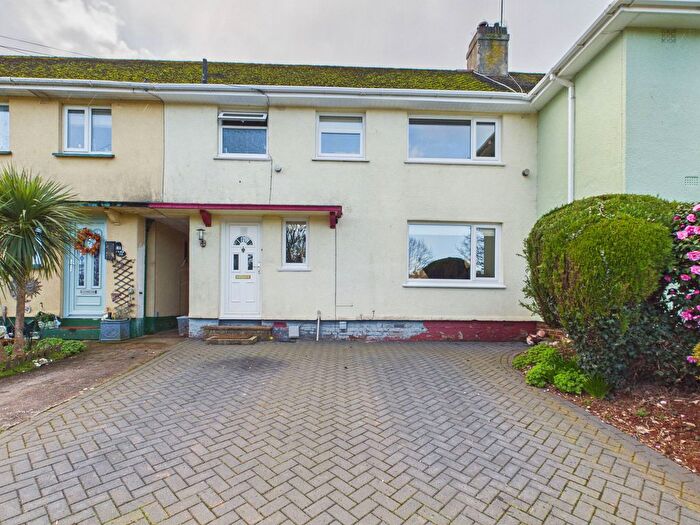
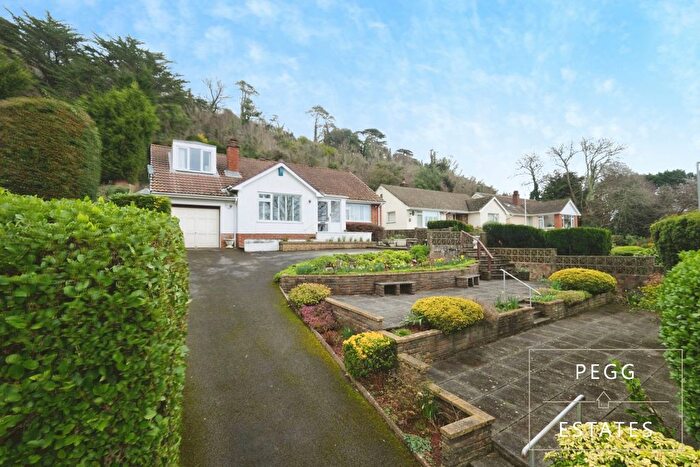
Properties for sale near TQ1 4SJ, Teignmouth Road
![]()
If you are looking to sell your house, let it out, or receive a property valuation, an expert can help you.
Click the button below to get started.
Price Paid in Teignmouth Road, TQ1 4SJ, Watcombe
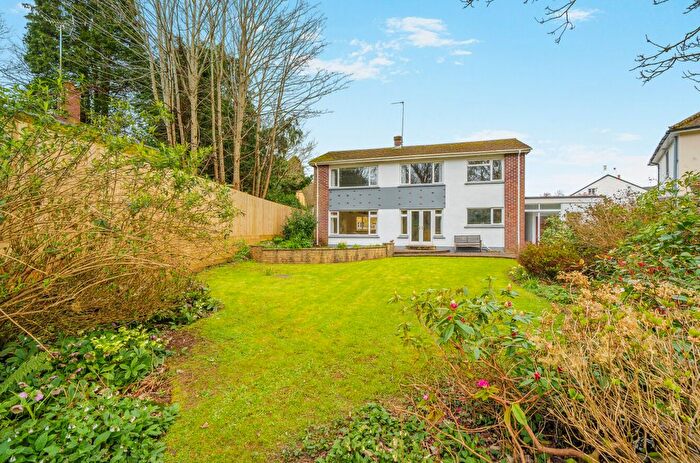
446 Teignmouth Road, TQ1 4SJ, Watcombe Torquay
Property 446 has been sold 3 times. The last time it was sold was in 20/02/2025 and the sold price was £392,000.00.
This detached house, sold as a freehold on 20/02/2025, is a 134 sqm detached house with an EPC rating of E.
| Date | Price | Property Type | Tenure | Classification |
|---|---|---|---|---|
| 20/02/2025 | £392,000.00 | Detached House | freehold | Established Building |
| 10/05/2019 | £378,000.00 | Detached House | freehold | Established Building |
| 02/06/2003 | £147,500.00 | Detached House | freehold | Established Building |
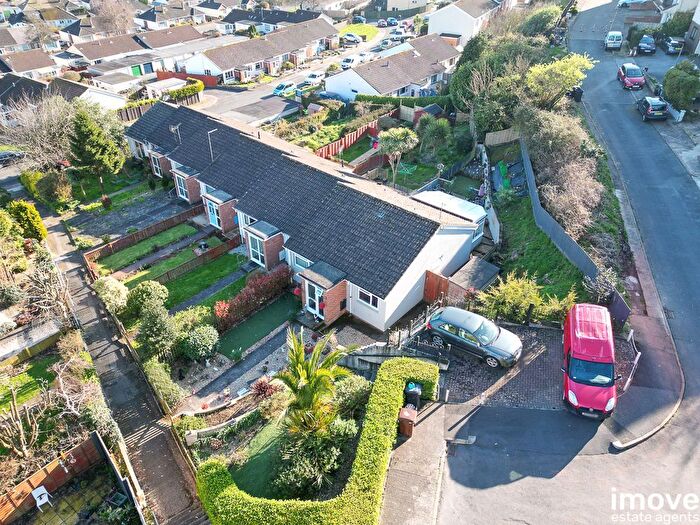
444 Teignmouth Road, TQ1 4SJ, Watcombe Torquay
Property 444 has been sold 4 times. The last time it was sold was in 06/11/2017 and the sold price was £327,500.00.
This detached house, sold as a freehold on 06/11/2017, is a 96 sqm detached bungalow with an EPC rating of D.
| Date | Price | Property Type | Tenure | Classification |
|---|---|---|---|---|
| 06/11/2017 | £327,500.00 | Detached House | freehold | Established Building |
| 23/04/2014 | £277,500.00 | Detached House | freehold | Established Building |
| 30/06/2011 | £250,000.00 | Detached House | freehold | Established Building |
| 20/07/2006 | £172,000.00 | Detached House | freehold | Established Building |
Transport near TQ1 4SJ, Teignmouth Road

House price paid reports for TQ1 4SJ, Teignmouth Road
Click on the buttons below to see price paid reports by year or property price:
- Price Paid By Year
- Property Type Price
Property Price Paid in TQ1 4SJ, Teignmouth Road by Year
The average sold property price by year was:
| Year | Average Sold Price | Price Change |
Sold Properties
|
|---|---|---|---|
| 2025 | £392,000 | 4% |
1 Property |
| 2019 | £378,000 | 13% |
1 Property |
| 2017 | £327,500 | 15% |
1 Property |
| 2014 | £277,500 | 10% |
1 Property |
| 2011 | £250,000 | 31% |
1 Property |
| 2006 | £172,000 | 14% |
1 Property |
| 2003 | £147,500 | - |
1 Property |
Property Price per Property Type in TQ1 4SJ, Teignmouth Road
Here you can find historic sold price data in order to help with your property search.
The average Property Paid Price for specific property types in the last three years are:
| Property Type | Average Sold Price | Sold Properties |
|---|---|---|
| Detached House | £392,000.00 | 1 Detached House |